接上一篇,箱型图适合绘制类别变量与目标变量的关系。这一篇所讲到的散点图适合绘制连续型变量与目标变量的关系。
中文文档
seaborn.scatterplot(x=None, y=None, hue=None, style=None, size=None, data=None, palette=None, hue_order=None,
hue_norm=None, sizes=None, size_order=None, size_norm=None, markers=True, style_order=None, x_bins=None,
y_bins=None, units=None, estimator=None, ci=95, n_boot=1000, alpha='auto', x_jitter=None, y_jitter=None,
legend='brief', ax=None, **kwargs)
这些参数的具体含义及如何使用见文档
案例
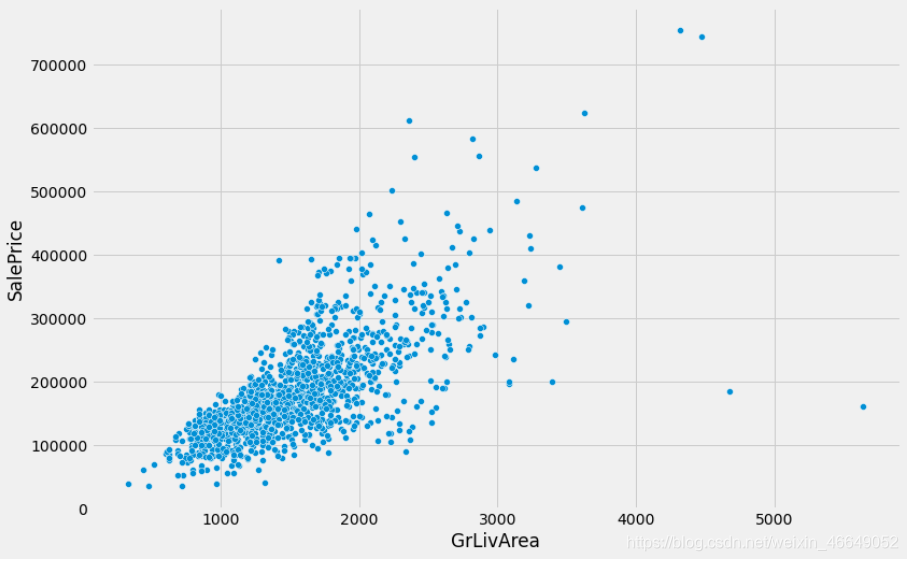
# 散点图适合连续变量,这是为连续变量定制的
def customized_num_scatterplot(y, x):
    style.use('fivethirtyeight')
    plt.subplots(figsize=(12,8))
    sns.scatterplot(y=y,x=x)

customized_num_scatterplot(train.SalePrice, train.GrLivArea)
当然matplotlib.pyplot里面也有绘制散点图的函数
# 散点图适合连续变量,这是为连续变量定制的
def customized_num_scatterplot(y, x):
    style.use('fivethirtyeight')
    fig,ax = plt.subplots(figsize=(12,8))
    ax.scatter(x,y)
    ax.set_xlabel('GrLivArea')
    ax.set_ylabel('SalePrice')

customized_num_scatterplot(train.SalePrice, train.GrLivArea)
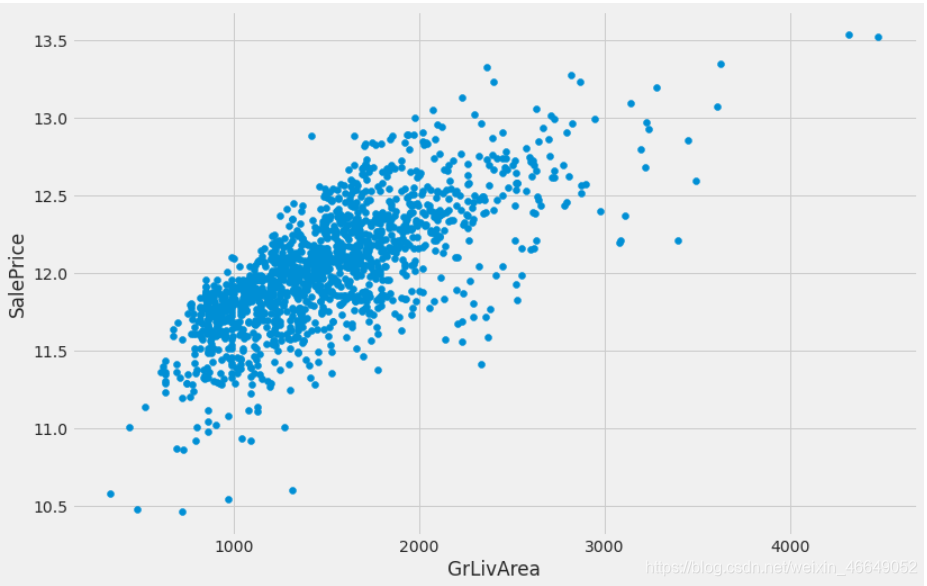
是不是没有上面漂亮!!!
如果对您有帮助,麻烦点赞关注,这真的对我很重要!!!如果需要互关,请评论留言!