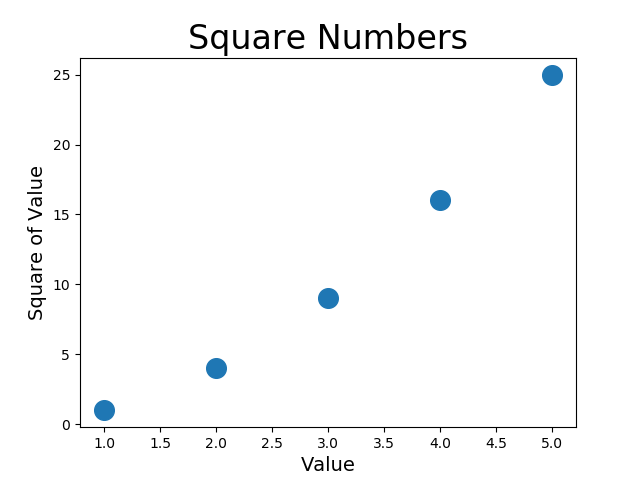
input_value=(1,2,3,4,5)
output_value=(1,4,9,16,25)

plt.scatter(input_value,output_value,s=100)

plt.title("Square Numbers",fontsize=24)
plt.xlabel("Value",fontsize=14)
plt.ylabel("Square of Value",fontsize=14)
input_value=(1,2,3,4,5)
output_value=(1,4,9,16,25)
plt.scatter(input_value,output_value,s=100)
plt.title("Square Numbers",fontsize=24)
plt.xlabel("Value",fontsize=14)
plt.ylabel("Square of Value",fontsize=14)