不能算原创,因为我参考的是别人的博客。包括里面拟合的函数,以及求梯度的方法,还有构造的数据直接用的人家的。但是看他的代码有问题迭代的时候虽然最后c参数的梯度为0,但是不代表就不对他进行求解了。再加上他的图我没怎么看懂含义,所以自己改了改代码,重新画了画错误率的图。
#coding:utf-8
import numpy as np
import matplotlib.pyplot as plt
#y=2 * (x1) + (x2) + 3
rate = 0.001
threshold=1e-15 #停止阈值
x_train = np.array([    [1, 2],    [2, 1],    [2, 3],    [3, 5],    [1, 3],    [4, 2],    [7, 3],    [4, 5],    [11, 3],    [8, 7]    ])
y_train = np.array([7, 8, 10, 14, 8, 13, 20, 16, 28, 26])
x_test  = np.array([    [1, 4],    [2, 2],    [2, 5],    [5, 3],    [1, 5],    [4, 1]    ])

err_avg=[]
a = np.random.normal()
b = np.random.normal()
c = np.random.normal()

def h(x):
    return a*x[0]+b*x[1]+c

for i in range(10000):#最多迭代10000次
    sum_a=0
    sum_b=0
    sum_c=0
    flag=0
    for x, y in zip(x_train, y_train):
        for xi in x:
            sum_a = sum_a + rate * (y - h(x)) * x[0]
            sum_b = sum_b + rate * (y - h(x)) * x[1]
            sum_c = sum_c + rate * (y - h(x))
    a1 = a + sum_a
    b1 = b + sum_b
    c1 = c + sum_c
    if abs(a-a1)<=threshold and abs(b-b1)<=threshold and abs(c-c1)<=threshold  :
        print ("迭代的总次数"+str(i))
        break
    else:
        a = a1
        b = b1
        c = c1
        #plt.plot([yi-h(xi) for xi,yi in zip(x_train,y_train)])
        err = 0
        for xi,yi in zip(x_train,y_train):
            err += yi-h(xi)
        err_avg.append(err/float(len(x_train))) #每次迭代的平均错误率

print(a)
print(b)
print(c)

plt.plot(err_avg)
for i in range(0,len(err_avg)):
    plt.scatter(i,err_avg[i], c='r')

result=[h(xi) for xi in x_train]
print(result)

result=[h(xi) for xi in x_test]
print(result)

plt.show()
运行结果如下:
迭代的总次数8319
2.0
1.0
3.0
[6.9999999999998153, 7.9999999999997655, 9.9999999999998916, 14.000000000000032, 7.9999999999998792, 12.999999999999854, 19.999999999999954, 16.000000000000043, 28.000000000000004, 26.00000000000022]
[8.9999999999999432, 8.9999999999998277, 12.00000000000002, 15.999999999999929, 10.000000000000007, 11.99999999999979]

因为为了等会儿放大好看所以画了散点图,放大看:
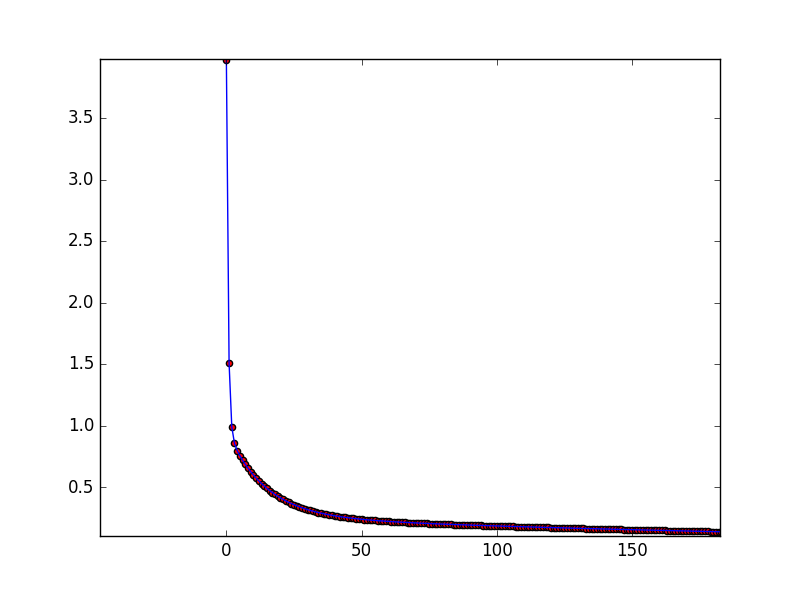
可以看到大概在150次过后其实就算的差不多了。
如果代码还有问题,请看到的各位指正!