官方参考文档:https://prometheus.io/docs/prometheus/latest/getting_started/
1、防火墙配置
firewall-cmd --zone=public --add-port=9090/tcp --permanent

firewall-cmd --reload
2、下载prometheus
mkdir /ssd/prometheus/

mkdir /sas/prometheus/prometheus/
cd /sas/prometheus/prometheus/

wget https://github.com/prometheus/prometheus/releases/download/v2.22.2/prometheus-2.22.2.linux-amd64.tar.gz

tar xvfz prometheus-*.tar.gz
cd prometheus-*
3、修改prometheus,监控自身
vi /sas/prometheus/prometheus/prometheus.yml

# my global config
global:
  scrape_interval:     15s # Set the scrape interval to every 15 seconds. Default is every 1 minute.
  evaluation_interval: 15s # Evaluate rules every 15 seconds. The default is every 1 minute.
  # scrape_timeout is set to the global default (10s).

  # Attach these labels to any time series or alerts when communicating with
  # external systems (federation, remote storage, Alertmanager).
  external_labels:
    monitor: 'devops-monitor01'

# Alertmanager configuration
alerting:
  alertmanagers:
  - static_configs:
    - targets:
      # - alertmanager:9093

# Load rules once and periodically evaluate them according to the global 'evaluation_interval'.
rule_files:
  # - "first_rules.yml"
  # - "second_rules.yml"

# A scrape configuration containing exactly one endpoint to scrape:
# Here it's Prometheus itself.
scrape_configs:
  # The job name is added as a label `job=<job_name>` to any timeseries scraped from this config.
  - job_name: 'prometheus'

    # metrics_path defaults to '/metrics'
    # scheme defaults to 'http'.

    # Override the global default and scrape targets from this job every 5 seconds.
    scrape_interval: 5s

    static_configs:
    - targets: ['10.255.200.1:9090','10.255.200.2:9090','10.255.200.3:9090']
4、编写Systemd服务管理配置文件
vi /usr/lib/systemd/system/prometheus.service

[Unit]
Description=Prometheus Services
After=network.target remote-fs.target

[Service]
Type=simple
ExecStart=/sas/prometheus/prometheus/prometheus --config.file=/sas/prometheus/prometheus/prometheus.yml --storage.tsdb.path=/ssd/prometheus/
Restart=on-failure
RestartSec=5

[Install]
WantedBy=multi-user.target
5、启动prometheus服务
systemctl daemon-reload

systemctl start prometheus
systemctl status prometheus
systemctl enable prometheus
6、查看监控数据
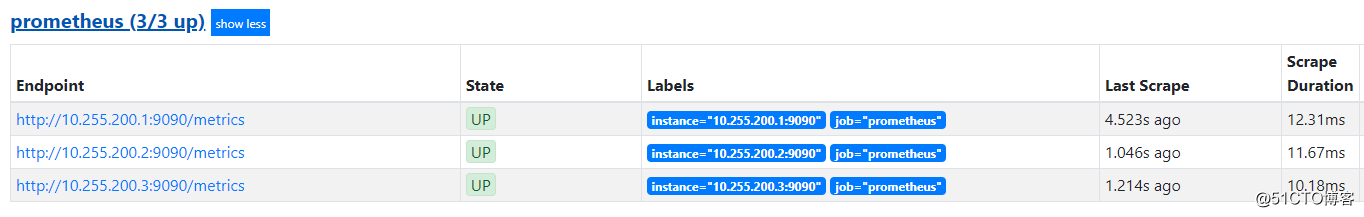
浏览器访问:http://10.255.200.1:9090/targets 。可看到3个节点都正常上线,状态为:UP。
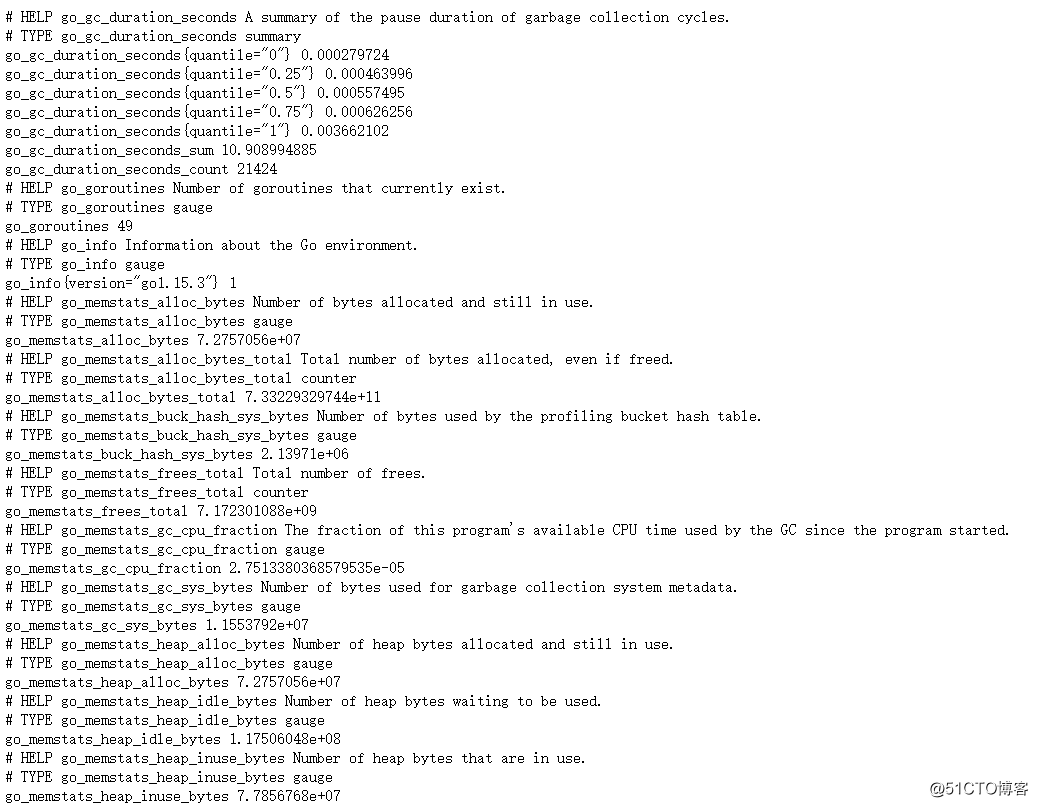
浏览器访问:http://10.255.200.1:9090/metrics 。可看到相应的监控数据。