1. 从官网选择Prometheus版本进行下载
官网地址>> https://github.com/prometheus/prometheus/releases/
2. 实验安排
| 主机 | 所需安装服务 |
|---|---|
| 192.168.153.137 | promethus,grafana |
| 192.168.153.136 | mysql,node_exporter,mysqld_exporter |
3. 上传软件包到137服务器并配置
3.1 将软件包解压到 /usr/local 目录下
tar xzf prometheus-2.24.1.linux-amd64.tar.gz -C /usr/local/
3.2 给目录创建软链接
ln -s /usr/local/prometheus-2.24.1.linux-amd64/ /usr/local/prometheus
3.3 切换到目录下
cd /usr/local/prometheus
3.4 修改配置文件 prometheus.yml,配置要监控的项
vim prometheus.yml
内容修改如下:
scrape_configs:
  # The job name is added as a label `job=<job_name>` to any timeseries scraped from this config.
  - job_name: 'prometheus'

    # metrics_path defaults to '/metrics'
    # scheme defaults to 'http'.

    static_configs:
    - targets: ['localhost:9090']
  #监控Linux主机状态
  - job_name: 'linux'
    static_configs:
    - targets: ['192.168.153.138:9100']
  #监控mysql服务状态
  - job_name: 'mysql'
    static_configs:
    - targets: ['192.168.153.138:9104']
3.5 启动promethus服务
nohup /usr/local/prometheus/prometheus --config.file=/usr/local/prometheus/prometheus.yml &
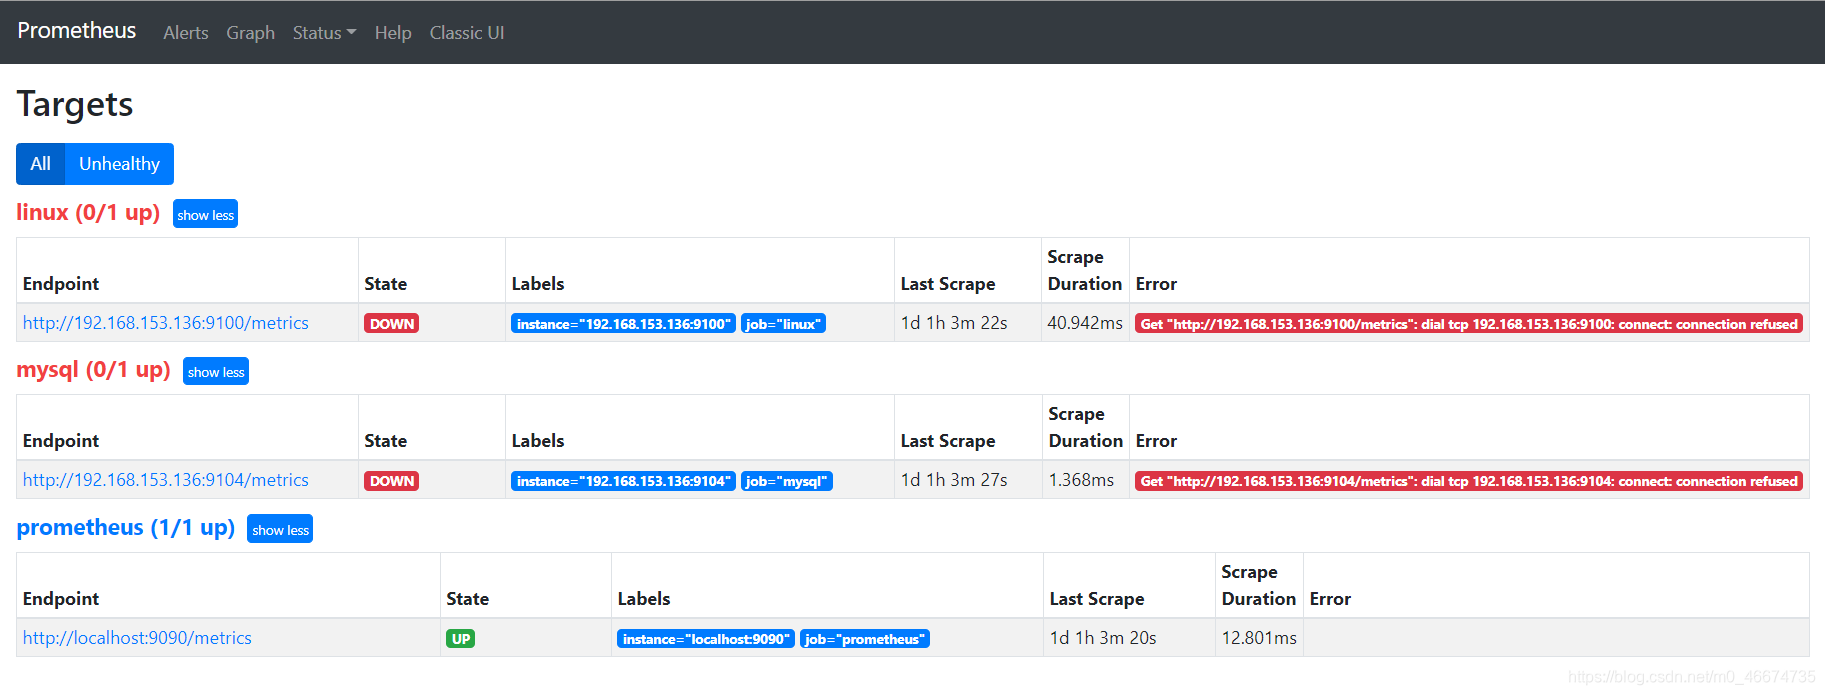
3.6 浏览器输入 IP:9090 查看
在Status->Targets页面下,我们可以看到我们配置的两个Target,它们的State为DOWN。
4. 配置136主机
4.1 下载exporter
下载地址>> https://github.com/prometheus/node_exporter/releases
4.2 将软件包解压到 /usr/local 目录下
tar xzf node_exporter-1.0.1.linux-amd64.tar.gz -C /usr/local/
4.3 启动exporter
nohup /usr/local/node_exporter-1.0.1.linux-amd64/node_exporter &
4.4 下载mysqld_exporter
下载地址>> https://github.com/prometheus/mysqld_exporter/releases
4.5 将软件包解压到 /usr/local 目录下
tar xzf mysqld_exporter-0.12.1.linux-amd64.tar.gz -C /usr/local/
4.6 安装数据库并启动给mysqld_exporter授权
安装
yum -y install mariadb mariadb-server
启动
systemctl start mariadb
登录授权
[root@host-138 ~]# mysql
Welcome to the MariaDB monitor.  Commands end with ; or \g.

MariaDB [(none)]> grant select,replication client, process on *.* to 'mysql_monitor'@'localhost' identified by 'mysql_monitor';
Query OK, 0 rows affected (0.00 sec)
4.7 创建 .my.cnf 配置文件
vim /usr/local/mysqld_exporter-0.12.1.linux-amd64/.my.cnf
内容为:
[client]
user=mysql_monitor
password=mysql_monitor
4.8 运行mysqld_exporter服务
nohup /usr/local/mysqld_exporter-0.12.1.linux-amd64/mysqld_exporter --config.my-cnf="/usr/local/mysqld_exporter-0.12.1.linux-amd64/.my.cnf" &
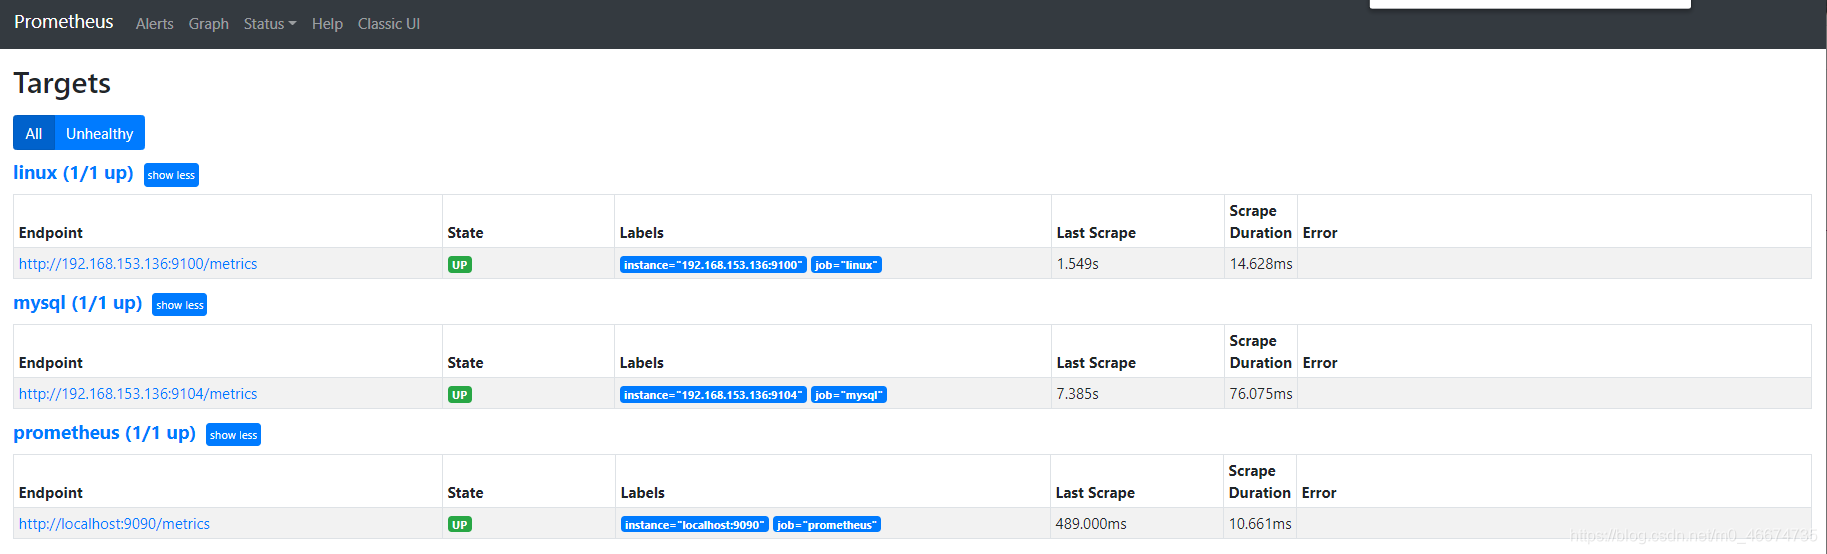
5. 在promethus页面刷新Status->Targets页面,可以看到配置的两个Target的State为UP:
6. 在137主机上安装部署grafana
安装教程链接>> https://blog.csdn.net/m0_46674735/article/details/112109523
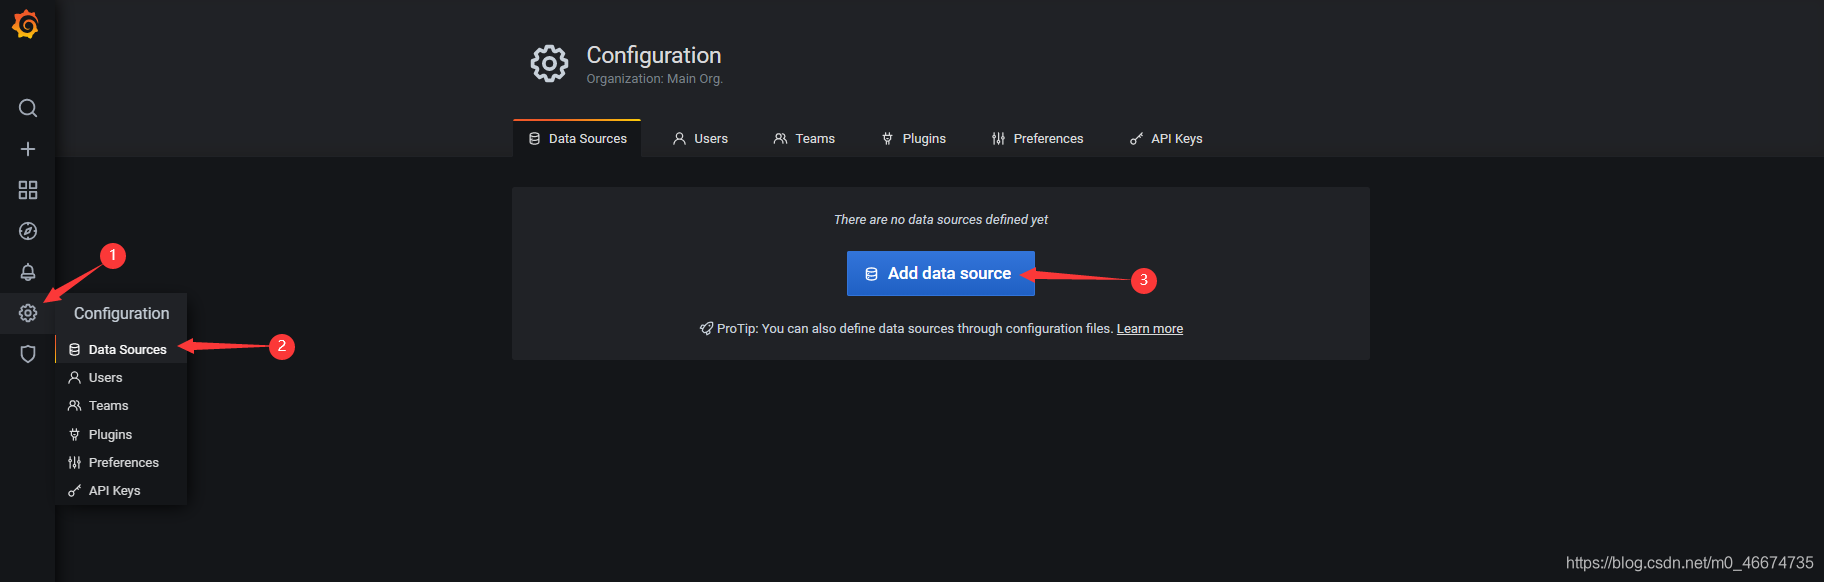
6.1 添加promethus数据源
1)
2)
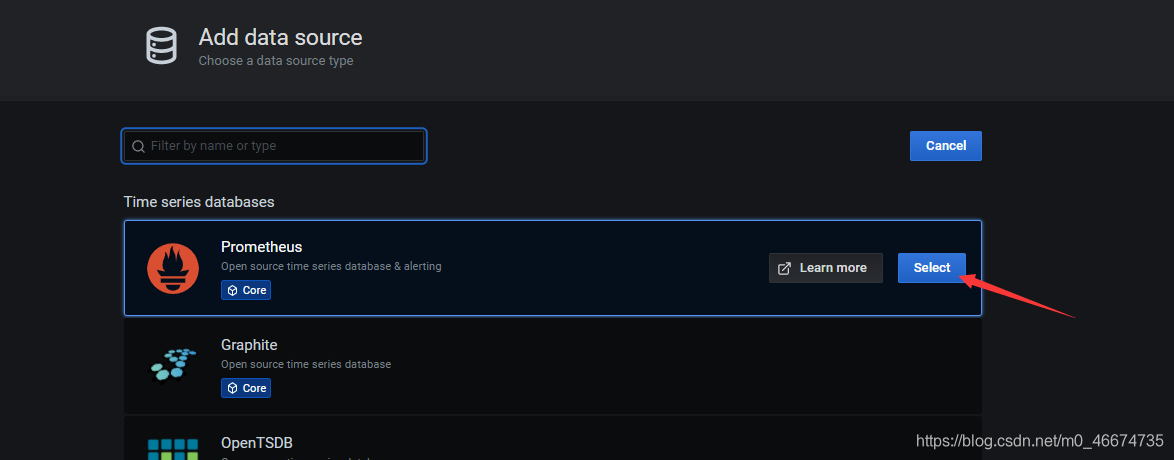
**3)*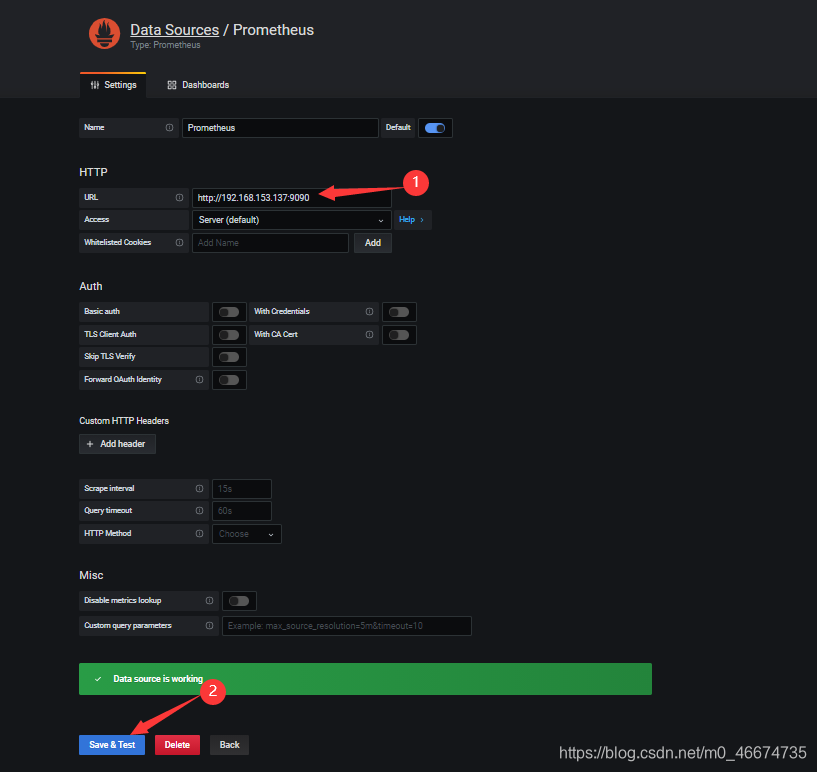
6.2 下载并导入mysql的dashboard
6.2.1 下载并解压
下载地址>> https://github.com/percona/grafana-dashboards
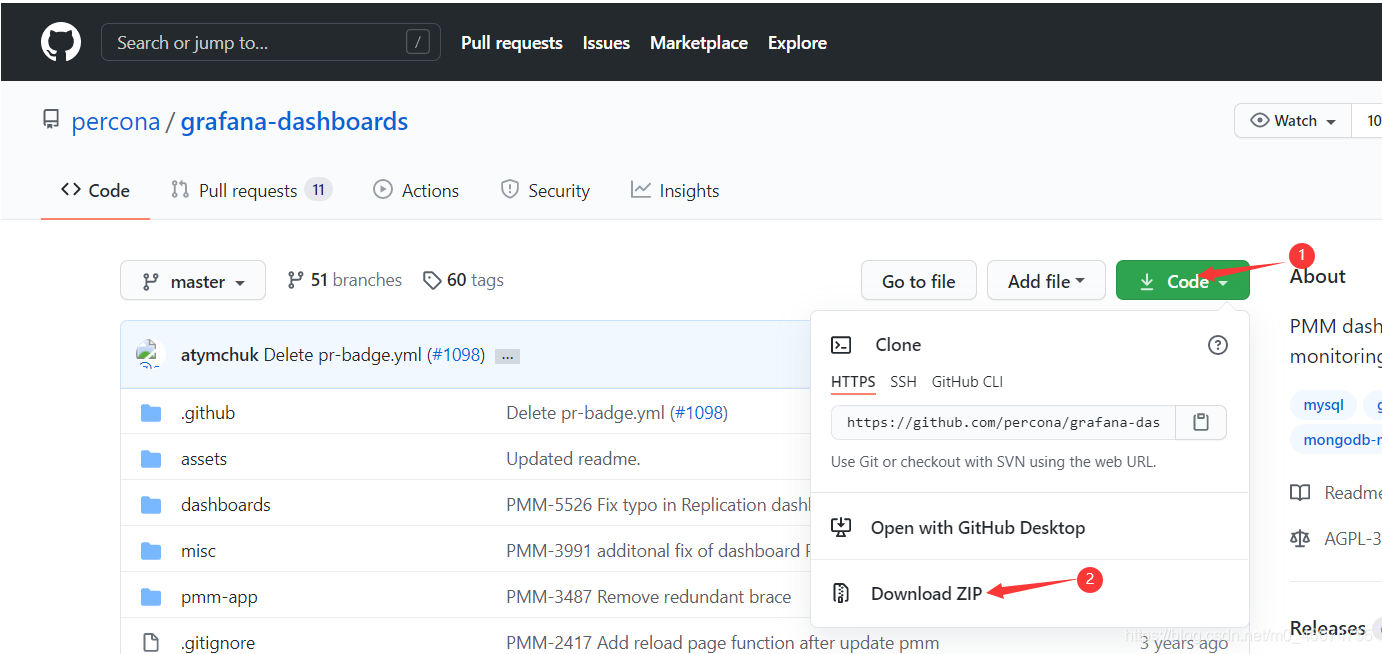
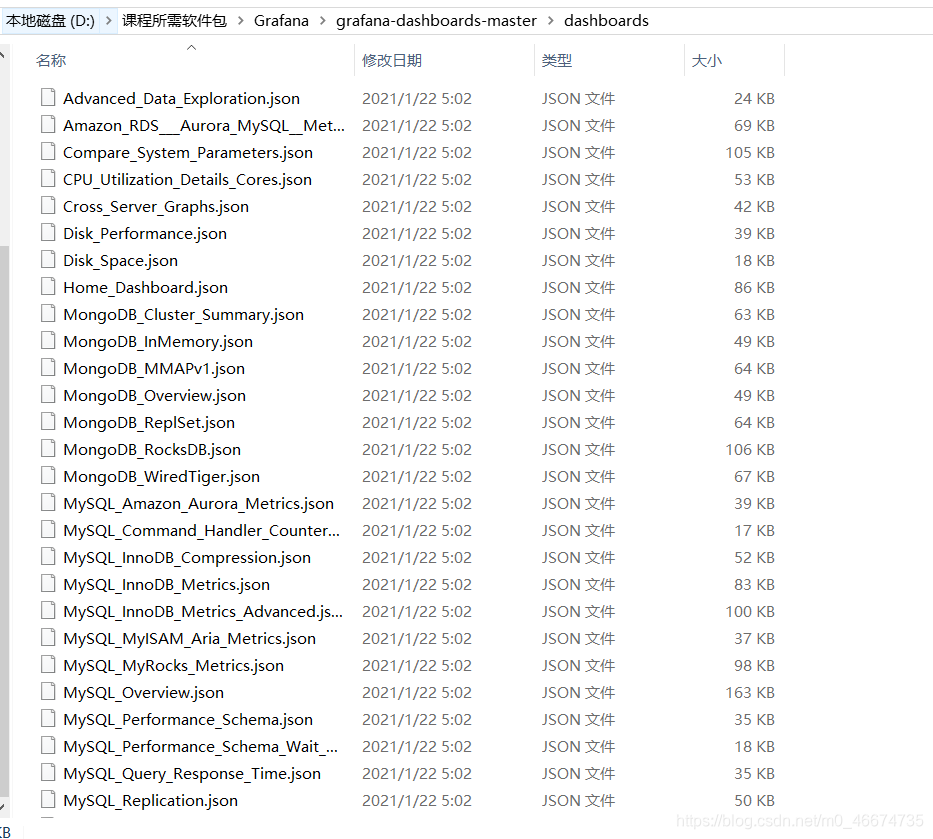
解压得到相关JSON文件
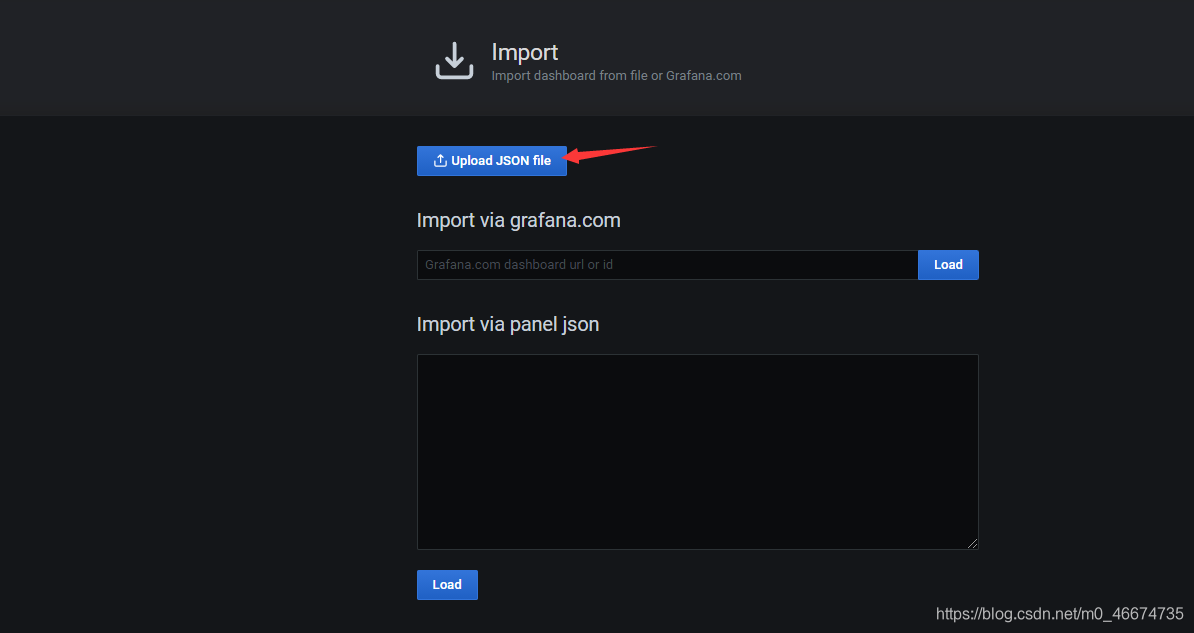
6.2.2 导入
1)
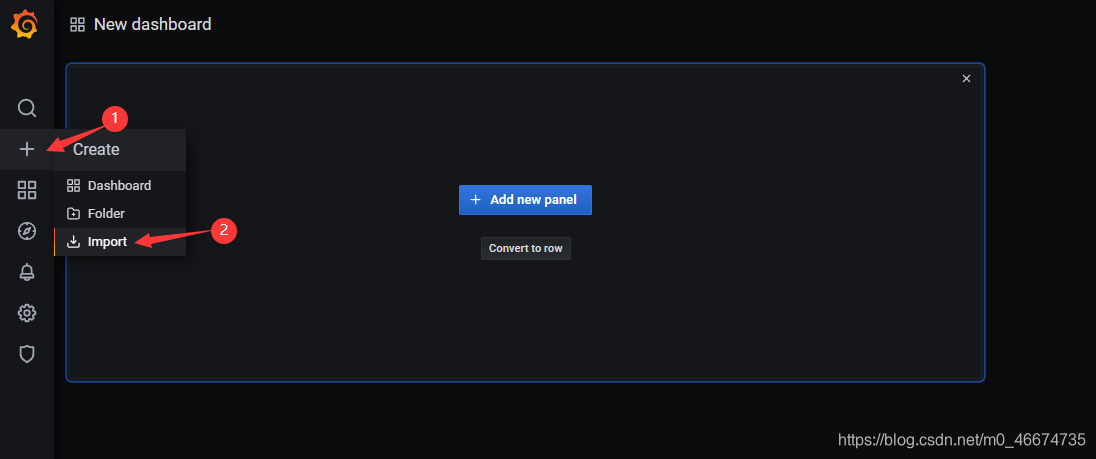
2)
3) 选择解压之后的 grafana-dashboards-master\dashboards 下的MySQL_Overview.json 进行导入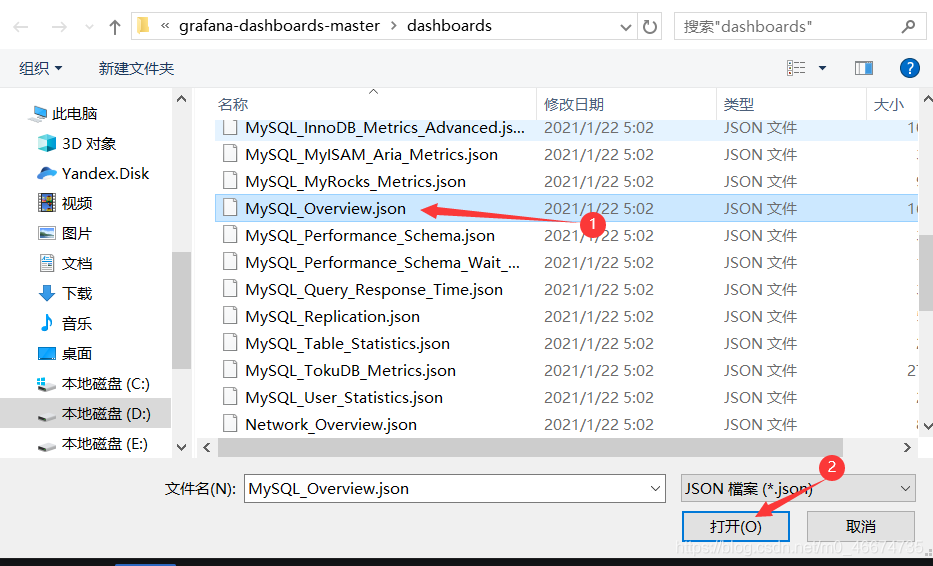
4)
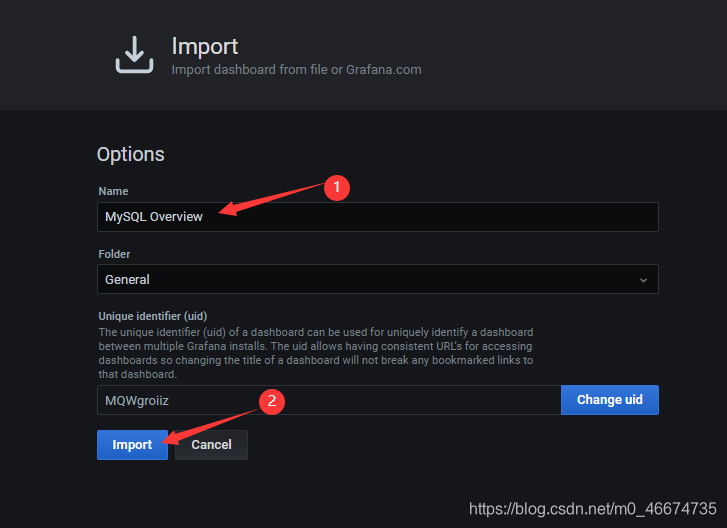
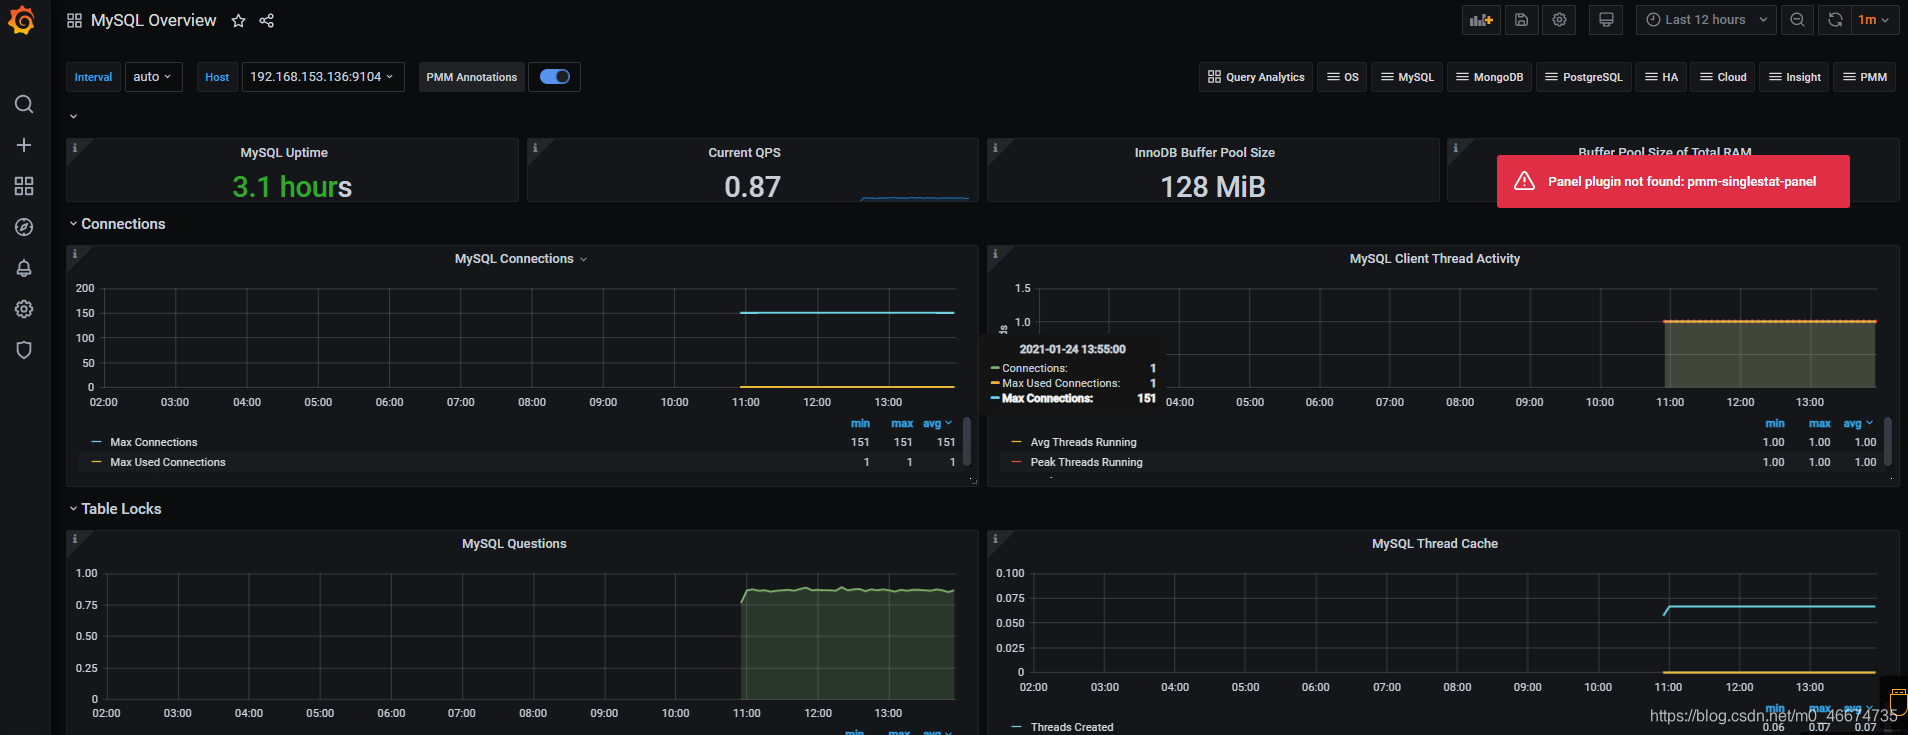
5) 导入成功
6.3 导入9276的dashboard监控系统状态
1)
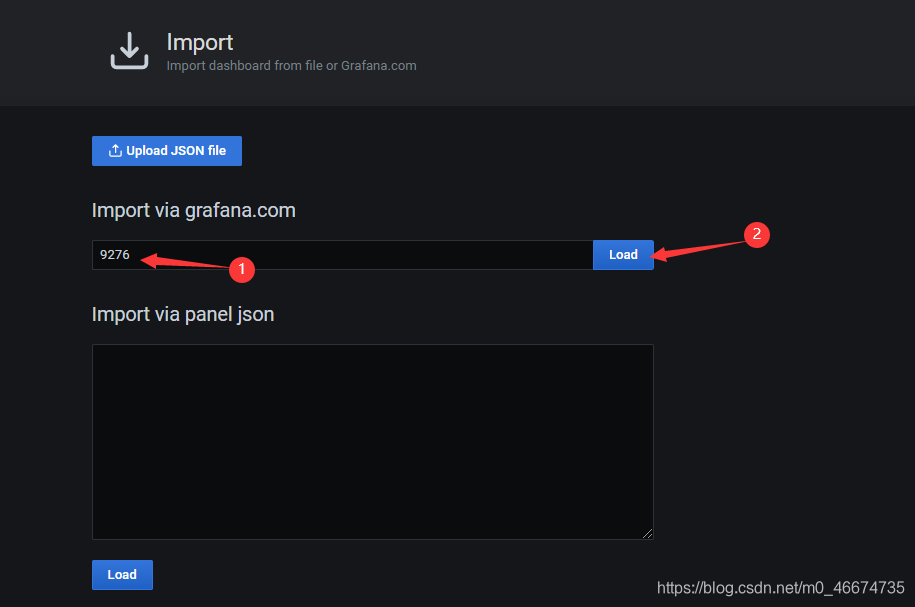
2)
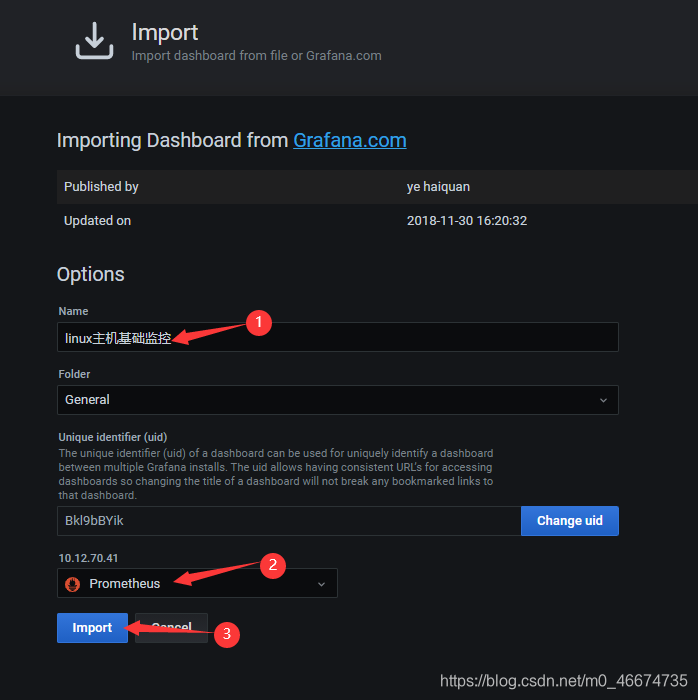
3) 导入成功
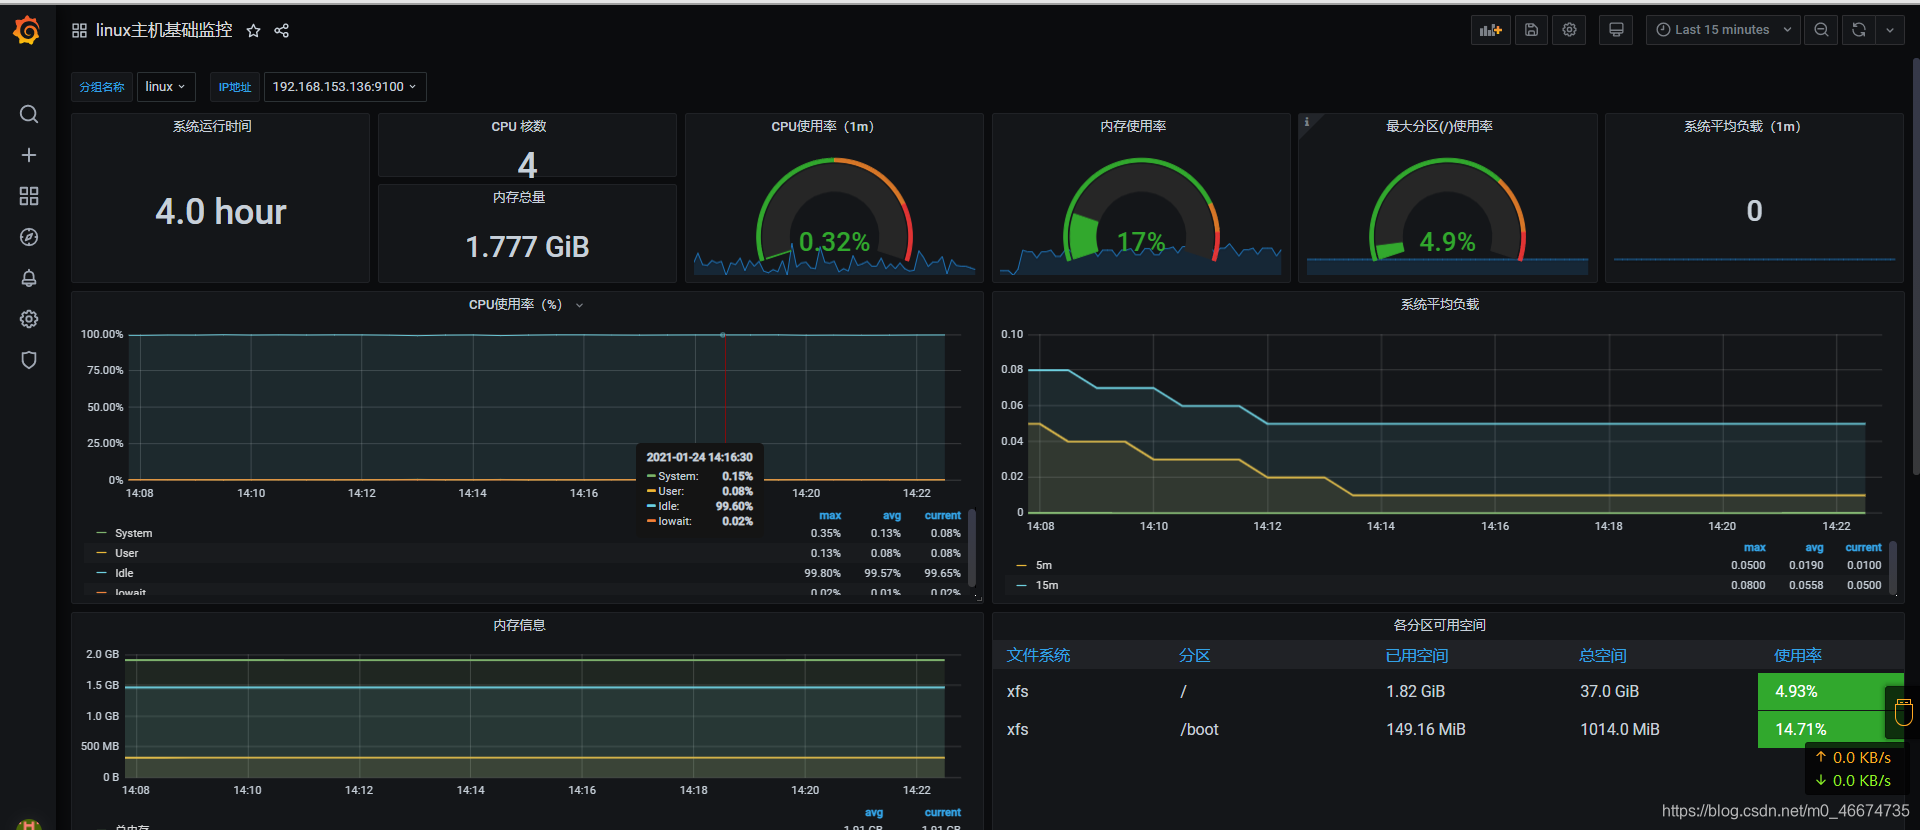
4)网络部分无数据,修改网卡名称
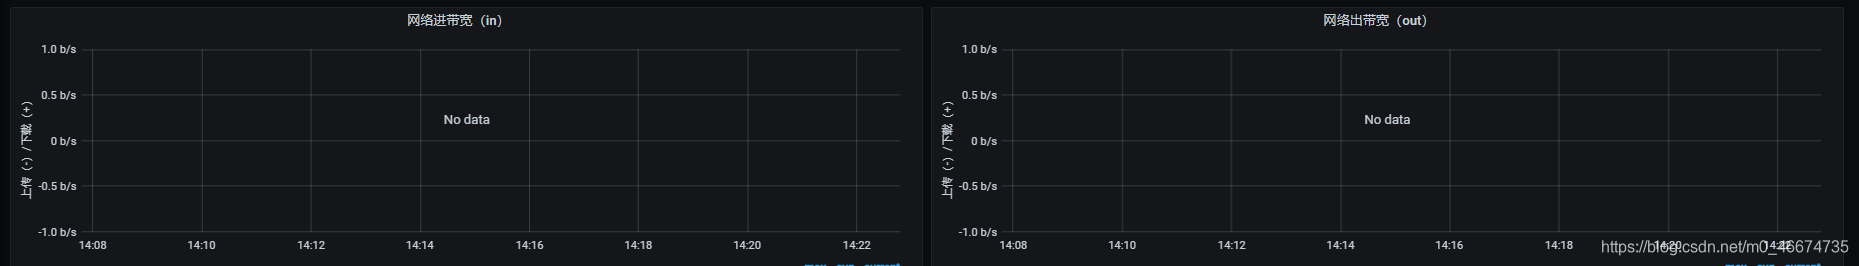 5)
5) 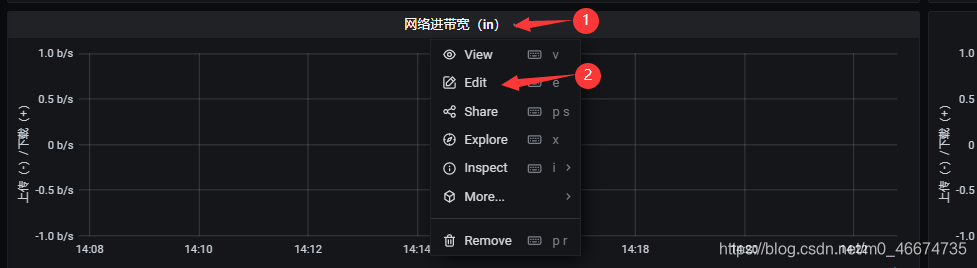
6)
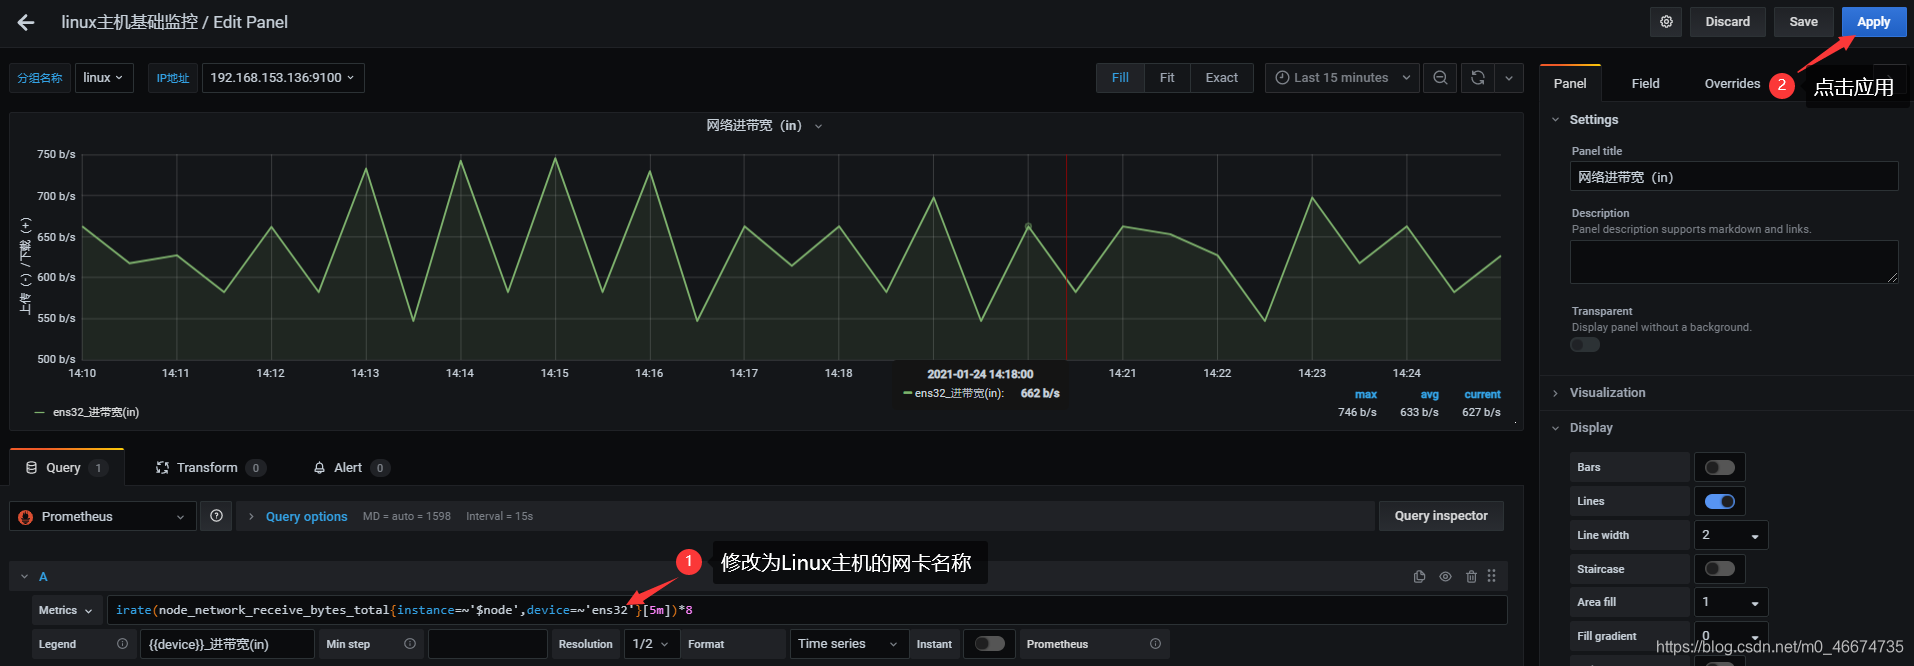
7) 网络出口带宽修改操作相同