此篇博客用来记录使用 ESP-PROG / Jlink 来对 ESP32-Lyrat 进行 JTAG 调试时遇到的一些问题以及解决办法。如果对进行 JTAG 相关操作有疑惑,请参考以下资料:
1. Error: libusb_open() failed with LIBUSB_ERROR_NOT_FOUND
此错误出现的原因是设备没有被找到,相关 log 如下 :
openocd -f interface\ftdi\esp32_devkitj_v1.cfg -f board\
esp32-wrover-kit-1.8v.cfg
Open On-Chip Debugger  v0.10.0-esp32-20200309 (2020-03-09-11:51)
Licensed under GNU GPL v2
For bug reports, read
        http://openocd.org/doc/doxygen/bugs.html
adapter speed: 9600 kHz

Warn : Interface already configured, ignoring
Info : Configured 2 cores
Info : Listening on port 6666 for tcl connections
Info : Listening on port 4444 for telnet connections
Error: libusb_open() failed with LIBUSB_ERROR_NOT_FOUND
Error: no device found
Error: unable to open ftdi device with vid 0403, pid 6010, description '*', seri
al '*' at bus location '*'
Error: no device found
Error: unable to open ftdi device with vid 0403, pid 6014, description '*', seri
al '*' at bus location '*'

Assertion failed!

Program: C:\Users\example\.espressif\tools\openocd-esp32\v0.10.0-esp32-20200309\ope
nocd-esp32\bin\openocd.exe
File: src/jtag/core.c, Line 343

Expression: jtag_trst == 0

This application has requested the Runtime to terminate it in an unusual way.
Please contact the application's support team for more information.
解决办法如后续 1.1 及 1.2。
1.1 检查硬件连线是否正确
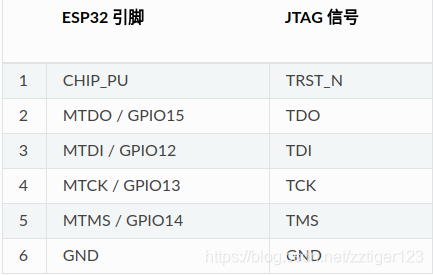
JTAG 调试需要连接的引脚为 MTDO、MTDI、MTCK、MTMS 与 GND。以调试 ESP32 为例,ESP-Prog 与 Jlink 需要连接的引脚对应关系如下。
1.2 检查 JTAG 调试的驱动是否正确
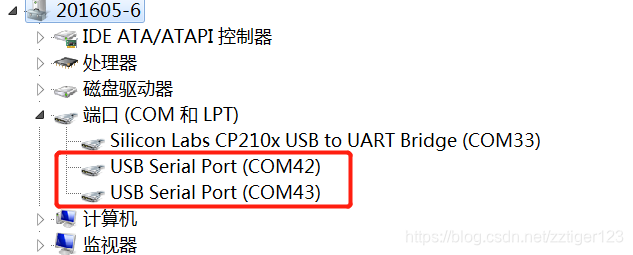
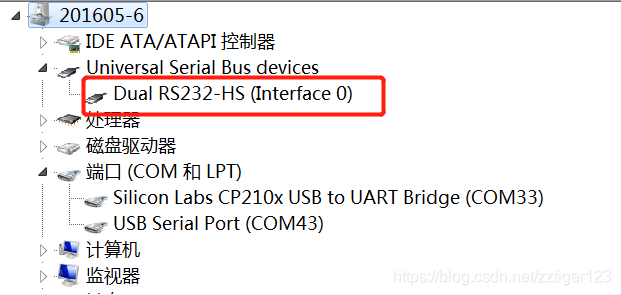
如果硬件连线完全正确,则说明是驱动未正确安装,以 Windows 为例,在接入 ESP-Prog 后,打开 设备管理器(右击 我的电脑-> 左击 属性 -> 界面左上角可查看到 设备管理器) ,显示如下。
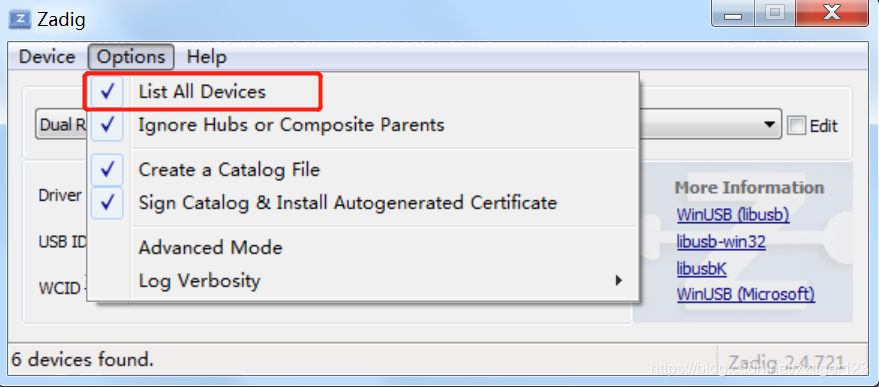
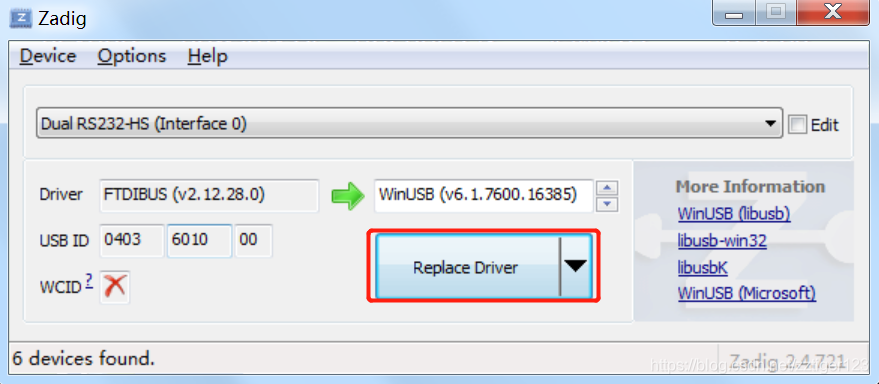
此时需要使用 zadig 来安装正确的驱动,zadig 的下载链接点击 这里。安装完成后,打开 zadig,在 zadig 界面里点击 Options -> List All Devices,如下。
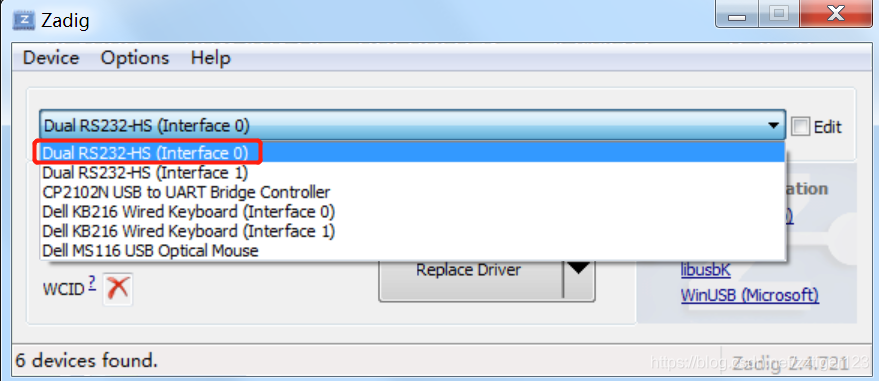
选择 Dual RS2332-HS(Interface 0),然后点击 Install Driver 或 Replace Driver(如果你有类似驱动,则会像下图一样显示 Replace Driver),如下。
zadig 提示驱动安装完成后,可以再次点开设备管理器(右击 我的电脑-> 左击 属性 -> 界面左上角可查看到 设备管理器),发现驱动已经被正确安装。如下。
然后重新使用 OpenOCD 即可发现此错误已消失。关于 Interface 0 与 Interface 1 的介绍请查看此博客第五节。
2. Error: JTAG scan chain interrogation failed: all ones
此错误出现的原因基本是 JTAG 需要的 GPIO 口异常(比如被复用等),相关 log 如下 :
./bin/openocd -s share/openocd /
/scripts -f interface/jlink.cfg -f board/esp32-wrover.cfg
Open On-Chip Debugger  v0.10.0-esp32-20190708 (2019-07-08-11:03)
Licensed under GNU GPL v2
For bug reports, read
	http://openocd.org/doc/doxygen/bugs.html
adapter speed: 9600 kHz
adapter speed: 20000 kHz
Info : Configured 2 cores
esp32 interrupt mask on
Info : Listening on port 6666 for tcl connections
Info : Listening on port 4444 for telnet connections
Info : J-Link V9 compiled Jul 19 2017 16:11:45
Info : Hardware version: 9.70
Info : VTarget = 3.332 V
Info : Reduced speed from 20000 kHz to 15000 kHz (maximum).
Info : Reduced speed from 20000 kHz to 15000 kHz (maximum).
Info : clock speed 20000 kHz
Error: JTAG scan chain interrogation failed: all ones
Error: Check JTAG interface, timings, target power, etc.
Error: Trying to use configured scan chain anyway...
Error: esp32.cpu0: IR capture error; saw 0x1f not 0x01
Warn : Bypassing JTAG setup events due to errors
Info : Listening on port 3333 for gdb connections
解决方法:此时需要检查 JTAG 对应的 GPIO 口是否被其他功能定义与使用(比如 SDIO 等)。
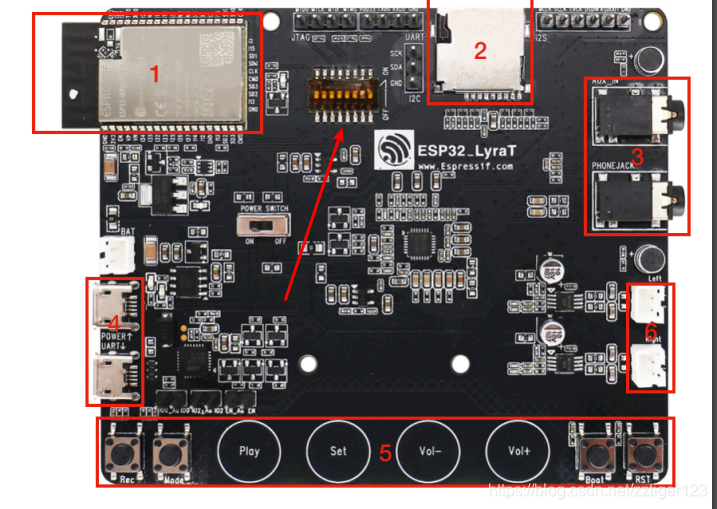
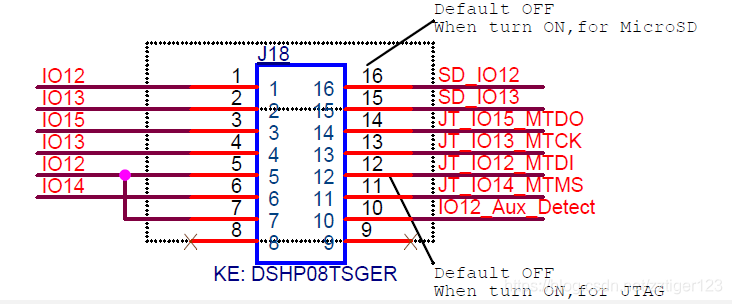
以 ESP32_Lyrat 开发板为例,JTAG 对应的 GPIO 口为 GPIO12 至 GPIO15。 这几个 GPIO 同时被用作 SDIO。如果要进行 JTAG 调试,需要拨动对应的拨码开关,将拨码开关 3-6 拨至 ON,如下
完成上述操作后再进行 JTAG 调试,此错误已经消失。
注:ESP32 在使用 AT 固件时再进行 JTAG 调试,也会因为 GPIO 冲突而导致上述错误,具体信息请参考此博客第五节。
3. Error: JTAG scan chain interrogation failed: all zeroes
此错误出现的原因与第二点相同,基本是 JTAG 需要的 GPIO 口异常(比如被复用等),相关 log 如下 :
./bin/openocd -s share/openocd/scripts -f interface/jlink.cfg -f board/esp32-wrover.cfg
Open On-Chip Debugger  v0.10.0-esp32-20190708 (2019-07-08-11:03)
Licensed under GNU GPL v2
For bug reports, read
	http://openocd.org/doc/doxygen/bugs.html
adapter speed: 9600 kHz
adapter speed: 20000 kHz
Info : Configured 2 cores
esp32 interrupt mask on
Info : Listening on port 6666 for tcl connections
Info : Listening on port 4444 for telnet connections
Info : J-Link V9 compiled Jul 19 2017 16:11:45
Info : Hardware version: 9.70
Info : VTarget = 3.338 V
Info : Reduced speed from 20000 kHz to 15000 kHz (maximum).
Info : Reduced speed from 20000 kHz to 15000 kHz (maximum).
Info : clock speed 20000 kHz
Error: JTAG scan chain interrogation failed: all zeroes
Error: Check JTAG interface, timings, target power, etc.
Error: Trying to use configured scan chain anyway...
Error: esp32.cpu0: IR capture error; saw 0x00 not 0x01
Warn : Bypassing JTAG setup events due to errors
Info : Listening on port 3333 for gdb connections
解决方法同第二点,在这里不多做赘述。
4. Error: No symbols for FreeRTOS
此错误出现的原因是因为没有进行相关软件配置,相关 log 如下 :
./bin/openocd -s share/openocd/scripts -f interface/ftdi/esp32_devkitj_v1.cfg -f board/esp32-wrover.cfg
Open On-Chip Debugger  v0.10.0-esp32-20190708 (2019-07-08-11:03)
Licensed under GNU GPL v2
For bug reports, read
	http://openocd.org/doc/doxygen/bugs.html
none separate
adapter speed: 20000 kHz
Info : Configured 2 cores
esp32 interrupt mask on
Info : Listening on port 6666 for tcl connections
Info : Listening on port 4444 for telnet connections
Info : ftdi: if you experience problems at higher adapter clocks, try the command "ftdi_tdo_sample_edge falling"
Info : clock speed 20000 kHz
Info : JTAG tap: esp32.cpu0 tap/device found: 0x120034e5 (mfg: 0x272 (Tensilica), part: 0x2003, ver: 0x1)
Info : JTAG tap: esp32.cpu1 tap/device found: 0x120034e5 (mfg: 0x272 (Tensilica), part: 0x2003, ver: 0x1)
Info : esp32: Debug controller 0 was reset (pwrstat=0x5F, after clear 0x0F).
Info : esp32: Core 0 was reset (pwrstat=0x5F, after clear 0x0F).
Info : esp32: Debug controller 1 was reset (pwrstat=0x5F, after clear 0x0F).
Info : esp32: Core 1 was reset (pwrstat=0x5F, after clear 0x0F).
Info : Listening on port 3333 for gdb connections
Info : esp32: Debug controller 0 was reset (pwrstat=0x5F, after clear 0x0F).
Info : esp32: Core 0 was reset (pwrstat=0x5F, after clear 0x0F).
Info : esp32: Debug controller 1 was reset (pwrstat=0x5F, after clear 0x0F).
Info : esp32: Core 1 was reset (pwrstat=0x5F, after clear 0x0F).
Info : accepting 'gdb' connection on tcp/3333
Error: No symbols for FreeRTOS
Info : Target halted. PRO_CPU: PC=0x400E568C (active)    APP_CPU: PC=0x400E568C
Info : Target halted. PRO_CPU: PC=0x400916EE (active)    APP_CPU: PC=0x400E568C
解决方法:如果是使用 ST 系列产品,请参考 ST-LINK No symbols for FreeRTOS 。
如果是其他开发板,暂时还没有找到解决办法,但是此 Error 应该不影响 JTAG & GDB 调试,可以暂时忽略此错误,或参考 ST 资料自行进行类比配置。
5. Warn : Empty flash mapping!
此错误出现的原因是因为没有找到,相关 log 如下 :
Open On-Chip Debugger 0.10.0-dev (2018-11-05-04:10)
Licensed under GNU GPL v2
For bug reports, read
        http://openocd.org/doc/doxygen/bugs.html
adapter speed: 100 kHz
esp32 interrupt mask on
jaylink: Failed to open device: LIBUSB_ERROR_NOT_SUPPORTED.
Info : No device selected, using first device.
Info : J-Link V9 compiled Aug 23 2018 09:45:44
Info : Hardware version: 9.10
Info : VTarget = 3.301 V
Info : clock speed 100 kHz
Info : JTAG tap: esp32.cpu0 tap/device found: 0x120034e5 (mfg: 0x272 (Tensilica), part: 0x2003, ver: 0x1)
Info : JTAG tap: esp32.cpu1 tap/device found: 0x120034e5 (mfg: 0x272 (Tensilica), part: 0x2003, ver: 0x1)
Info : Target halted. PRO_CPU: PC=0x400873E9 (active)    APP_CPU: PC=0x40080ED7
Info : accepting 'gdb' connection on tcp/3333
Info : Target halted. PRO_CPU: PC=0x4009171A (active)    APP_CPU: PC=0x40080ED7
Warn : Empty flash mapping!
Info : Target halted. PRO_CPU: PC=0x4009171A (active)    APP_CPU: PC=0x40080ED7
Info : Target halted. PRO_CPU: PC=0x4009171A (active)    APP_CPU: PC=0x40080ED7
Info : Auto-detected flash size 4096 KB
Info : Using flash size 4096 KB
Info : Target halted. PRO_CPU: PC=0x4009171A (active)    APP_CPU: PC=0x40080ED7
Warn : Empty flash mapping!
Info : Target halted. PRO_CPU: PC=0x4009171A (active)    APP_CPU: PC=0x40080ED7
Info : Using flash size 0 KB
Info : Target halted. PRO_CPU: PC=0x4009171A (active)    APP_CPU: PC=0x40080ED7
Warn : Empty flash mapping!
Info : Target halted. PRO_CPU: PC=0x4009171A (active)    APP_CPU: PC=0x40080ED7
Info : Using flash size 0 KB
解决方法:首先确保 JTAG 引脚没有被其他功能所占用,然后在这里可以尝试使用 mon program_esp32 <file.bin> <address> 命令代替 load,比如在 gdb 调试终端里输入以下指令即可上传 blink.bin 固件:
(gdb) mon program_esp32 blink.bin 0x10000
Openocd 端指令可以参考 jtag debug command。
同时这也可能是不合适的引导程序和/或分区表引起的。最好将 bootloader.bin烧录在 0x1000,将分区表二进制文件烧录在 0x8000。
注:如果做出以上修改后仍然出现此问题,请将 OpenOCD 更新到最新版。
6. Failed to get flash maps (-1)!
此错误出现的原因是使用了错误的 openocd 版本,相关 log 如下 :
Open On-Chip Debugger 0.10.0-dev (2018-07-24-09:39)
Licensed under GNU GPL v2
For bug reports, read
http://openocd.org/doc/doxygen/bugs.html
Info : auto-selecting first available session transport "jtag". To override use 'transport select '.
esp32 interrupt mask on
adapter speed: 3000 kHz
Info : No device selected, using first device.
Info : J-Link V10 compiled Oct 9 2015 20:36:39
Info : Hardware version: 10.10
Info : VTarget = 3.322 V
Info : clock speed 3000 kHz
Info : JTAG tap: esp32.cpu0 tap/device found: 0x120034e5 (mfg: 0x272 (Tensilica), part: 0x2003, ver: 0x1)
Info : JTAG tap: esp32.cpu1 tap/device found: 0x120034e5 (mfg: 0x272 (Tensilica), part: 0x2003, ver: 0x1)
Info : Target halted. PRO_CPU: PC=0x40000400 (active) APP_CPU: PC=0x40000400
cpu0: Current bits set: BreakIn BreakOut RunStallIn
cpu1: Current bits set: BreakIn BreakOut RunStallIn
Info : JTAG tap: esp32.cpu0 tap/device found: 0x120034e5 (mfg: 0x272 (Tensilica), part: 0x2003, ver: 0x1)
Info : JTAG tap: esp32.cpu1 tap/device found: 0x120034e5 (mfg: 0x272 (Tensilica), part: 0x2003, ver: 0x1)
cpu0: Current bits set: BreakIn BreakOut RunStallIn
cpu1: Current bits set: BreakIn BreakOut RunStallIn
Info : esp32: Debug controller was reset (pwrstat=0x5F, after clear 0x0F).
Info : esp32: Core was reset (pwrstat=0x5F, after clear 0x0F).
Info : Target halted. PRO_CPU: PC=0x5000004B (active) APP_CPU: PC=0x00000000
Info : esp32: Core was reset (pwrstat=0x1F, after clear 0x0F).
Info : Target halted. PRO_CPU: PC=0x40000400 (active) APP_CPU: PC=0x40000400
** Programming Started **
auto erase enabled
Info : Target halted. PRO_CPU: PC=0x4009170E (active) APP_CPU: PC=0x40000400
Error: Failed to get flash maps (-1)!
Error: Failed to get flash mappings (-4)!
Error: auto_probe failed
** Programming Failed **
shutdown command invoked
出现此问题,可以尝试更新 openocd 版本至最新的 release。
相关参考
- ESP32 使用 AT 固件时进行 JTAG 失败
- Interface 0:JTAG 调试
- Interface 1:UART 口
- ESP-WORVER-KIT 相关参考
- ESP-PROG 对上电时序要求很高。可通过在 EN 和 GND 之间添加 10uF 电容,通过减慢上电时序来解决异常问题。