这篇教程用来带领实现 Ubuntu/Linux 下 ESP32 使用 Jlink 进行 JTAG 调试。分为如下几步:
1. 安装 OpenOCD
如果你已经按照 esp-idf 快速入门 一文中的介绍安装好了 ESP-IDF 及其 CMake 构建系统,那么 OpenOCD 已经被默认安装到了你的开发系统中。在 设置开发环境 结束后,你应该能够在终端中运行如下 OpenOCD 命令:
openocd --version
终端会输出以下信息(实际版本号可能会比这里列出的更新):
Open On-Chip Debugger  v0.10.0-esp32-20190708 (2019-07-08-11:04)
Licensed under GNU GPL v2
For bug reports, read
    http://openocd.org/doc/doxygen/bugs.html
2. Jlink 连线
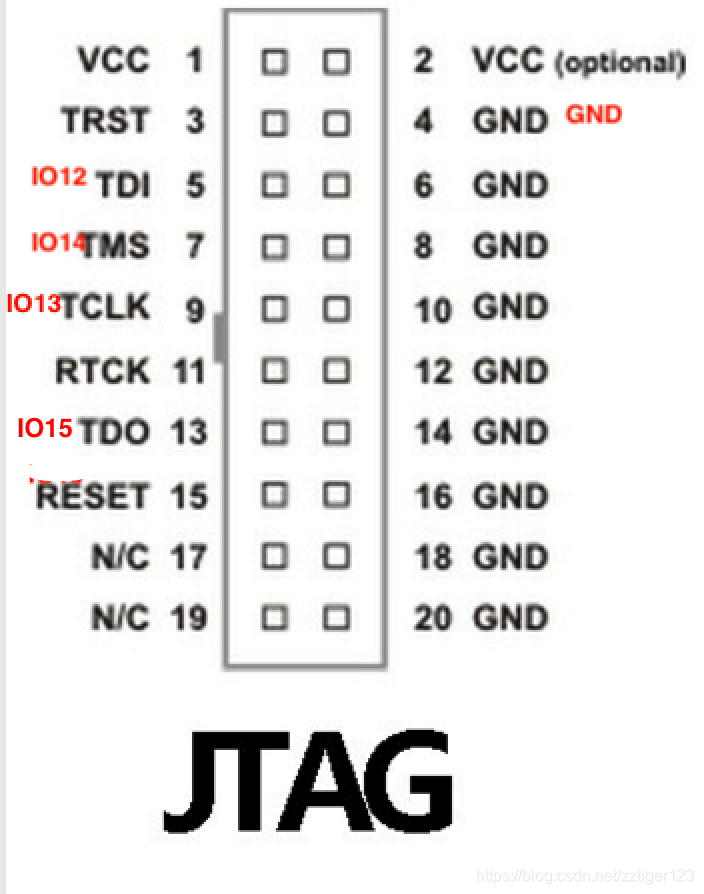
以下是 Jlink 上的 JTAG 接口对应的引脚图:

上图的左侧那排引脚对应着 Jlink的正面(有 Jlink logo 那一面)。
你需要按如下表格连接 Jlink 与 ESP32:
| 序号 | ESP32 引脚 | JTAG 信号 |
|---|---|---|
| 1 | CHIP_PU | TRST_N |
| 2 | MTDO / GPIO15 | TDO |
| 3 | MTDI / GPIO12 | TDI |
| 4 | MTCK / GPIO13 | TCK |
| 5 | MTMS / GPIO14 | TMS |
| 6 | GND | GND |
注:序号 1 可以不接。
具体的接法如下图:
上图的左侧那排引脚对应着 Jlink的正面(有 Jlink logo 那一面)。
其他硬件连线部分就按正常 ESP32 编译烧写运行所需的连线接好即可,同时 Jlink 另一端也需要通过 USB 连接到电脑。
3. 配置并运行 openocd
3.1 进入 openocd-esp32 目录
首先你需要在终端里进入到 openocd-esp32 目录:
cd ~/esp/openocd-esp32/v0.10.0-esp32-20200406/openocd-esp32
上述 openocd-esp32 目录请按照自己的 openocd-esp32 目录调整。
3.2 查看 openocd-esp32 版本
然后你需要查看 openocd-esp32 版本,一般已经标注在对应的文件夹上,比如 /esp/openocd-esp32/v0.10.0-esp32-20200406。如果是 2019 及以前版本,请忽略此步并直接跳转至 3.3 运行 openocd-esp32。如果是 2020 及以后版本,需要执行以下操作:
- 进入
openocd-esp32的以下目录:/esp/openocd-esp32/v0.10.0-esp32-20200309/openocd-esp32/share/openocd/scripts/interface,在interface文件夹中找到jlink.cfg并打开 - 在
jlink.cfg中添加adapter_khz 9600,然后保存文件并关闭(如果不添加,会在后续运行 openocd 指令时报错)
添加 adapter_khz 9600 后的 jlink.cfg 应如下:
#
# SEGGER J-Link
#
# http://www.segger.com/jlink.html
#

interface jlink
adapter_khz 9600

# The serial number can be used to select a specific device in case more than
# one is connected to the host.
#
# Example: Select J-Link with serial number 123456789
#
# jlink serial 123456789
3.3 运行 openocd-esp32
最后你只需要使用如下指令运行 openocd-esp32,此处确保 Jlink 已按上述硬件配置连接,同时确保 2020 版本已进行 3.2 查看 openocd-esp32 版本中的配置。
cd ~/esp/openocd-esp32/v0.10.0-esp32-20200406/openocd-esp32
./bin/openocd -s share/openocd/scripts -f interface/jlink.cfg \
-f board/esp-wroom-32.cfg
特别注意:上述指令中第二行和第三行请一并粘贴进入终端,因为单行指令太长,直接转成 PDF 会出现不必要的错误(使用 \ + 回车进行了指令换行)。
上述 openocd-esp32 目录请按照自己的 openocd-esp32 目录调整。上述 -f board/esp-wroom-32.cfg 请按照自己实际使用的开发板进行调整。如果使用的不是 ESP-WROVER-KIT 开发板,可以跳过下面的 特别测试 部分。
特别测试:这里也已经额外测试过 ESP-WROVER-KIT 开发板,也可以正常使用。不过在这一步中,需要将上述指令中的 -f board/esp-wroom-32.cfg 改成 board/esp32-wrover.cfg。指令如下:
cd ~/esp/openocd-esp32/v0.10.0-esp32-20200406/openocd-esp32
./bin/openocd -s share/openocd/scripts -f interface/jlink.cfg \
-f board/esp32-wrover.cfg
特别注意:上述指令中第二行和第三行请一并粘贴进入终端,因为单行指令太长,直接转成 PDF 会出现不必要的错误(使用 “\” + “回车” 进行了指令换行)。
完成上述指令后,如果在终端看到以下 log 信息,则 openocd 已成功打开:
Open On-Chip Debugger  v0.10.0-esp32-20200309 (2020-03-09-11:51)
Licensed under GNU GPL v2
For bug reports, read
	http://openocd.org/doc/doxygen/bugs.html
adapter speed: 9600 kHz

WARNING: boards/esp-wroom-32.cfg is deprecated, and may be removed in a future release.
Info : Configured 2 cores
Info : Listening on port 6666 for tcl connections
Info : Listening on port 4444 for telnet connections
Info : J-Link V9 compiled Jul 19 2017 16:11:45
Info : Hardware version: 9.70
Info : VTarget = 3.341 V
Info : clock speed 9600 kHz
Info : JTAG tap: esp32.cpu0 tap/device found: 0x120034e5 (mfg: 0x272 (Tensilica), part: 0x2003, ver: 0x1)
Info : JTAG tap: esp32.cpu1 tap/device found: 0x120034e5 (mfg: 0x272 (Tensilica), part: 0x2003, ver: 0x1)
Info : esp32: Debug controller 0 was reset.
Info : esp32: Core 0 was reset.
Info : Listening on port 3333 for gdb connections
请注意,此终端需要挂在这里不能关闭。然后你可以开始 4. gdb 的配置与打开。
4. gdb 的配置与打开
4.1 进入需要 gdb 调试的工程
在这里,你可以使用 esp-idf/examples/get-started/hello_world 示例用来测试,首先你需要进入此示例,在终端里输入:
cd ~/esp/esp-idf-v3.2.2/examples/get-started/hello_world
如果你有自己需要调试工程,直接进入自己的工程即可。
4.2 编写配置 GDB 文件
在你要调试的工程下面需要创建一个初始化配置文件 gdbinit。当启动调试器时,通常需要提供几个配置参数和命令,为了避免每次都在命令行中逐行输入这些命令,我们可以新建一个配置文件,并将其命名为 gdbinit,gdbinit请放在当前终端(你的项目)对应的目录下。gdbinit里的内容如下:
target remote :3333
set remote hardware-watchpoint-limit 2
mon reset halt
flushregs
thb app_main
c
在你成功创建 gdbinit 并复制粘贴上述指令到 gdbinit 后,保存此文件并关闭。
注:
gdbinit没有任何文件后缀,请不要额外添加.c,.sh等后缀。
4.3 编译烧写自己的工程至 ESP32 开发板
这一步你只需要按正常编译烧录的流程烧录即可,比如 make flash。如果在这一步有疑惑,请参考 esp-idf 快速入门。
4.4 启动 gdb
在终端中输入以下内容,启动 GDB:(这里的 build/hello_world.elf 请切换到你工程的 elf 文件路径,一般在编译后,build 目录下就会有你自己项目对应的 elf 文件)
cd ~/esp/esp-idf/examples/get-started/hello_world
xtensa-esp32-elf-gdb -x gdbinit build/hello-world.elf
正常情况下你就可以在此终端看到以下 log:
GNU gdb (crosstool-NG esp-2020r1) 8.1.0.20180627-git
Copyright (C) 2018 Free Software Foundation, Inc.
License GPLv3+: GNU GPL version 3 or later <http://gnu.org/licenses/gpl.html>
This is free software: you are free to change and redistribute it.
There is NO WARRANTY, to the extent permitted by law.  Type "show copying"
and "show warranty" for details.
This GDB was configured as "--host=x86_64-build_pc-linux-gnu --target=xtensa-esp32-elf".
Type "show configuration" for configuration details.
For bug reporting instructions, please see:
<http://www.gnu.org/software/gdb/bugs/>.
Find the GDB manual and other documentation resources online at:
<http://www.gnu.org/software/gdb/documentation/>.
For help, type "help".
Type "apropos word" to search for commands related to "word"...
Reading symbols from build/hello-world.elf...done.
0x400e2812 in esp_pm_impl_waiti () at /home/zhengzhong/esp/esp-idf/components/esp32/pm_esp32.c:484
484         asm("waiti 0");
JTAG tap: esp32.cpu0 tap/device found: 0x120034e5 (mfg: 0x272 (Tensilica), part: 0x2003, ver: 0x1)
JTAG tap: esp32.cpu1 tap/device found: 0x120034e5 (mfg: 0x272 (Tensilica), part: 0x2003, ver: 0x1)
cpu0: Debug controller 0 was reset.
cpu0: Core 0 was reset.
cpu0: Target halted, PC=0x500000CF, debug_reason=00000000
esp32: Core 0 was reset.
esp32: Debug controller 1 was reset.
esp32: Core 1 was reset.
Target halted. CPU0: PC=0x40000400 (active)
Target halted. CPU1: PC=0x40000400
Hardware assisted breakpoint 1 at 0x400d3848: file ../main/hello_world_main.c, line 17.
Target halted. CPU0: PC=0x400D3848 (active)
Target halted. CPU1: PC=0x00000000
[New Thread 1073428556]
[New Thread 1073430960]
[New Thread 1073412792]
[Switching to Thread 1073413524]

Thread 1 hit Temporary breakpoint 1, app_main () at ../main/hello_world_main.c:17
17      {
(gdb)
同时你可以在 3.3 运行 openocd-esp32 中一直保持运行 openocd 终端里发现以下 log 信息:
Error: No symbols for FreeRTOS
Info : cpu0: Target halted, PC=0x40091856, debug_reason=00000001
Info : Flash mapping 0: 0x10020 -> 0x3f400020, 20 KB
Info : Flash mapping 1: 0x20020 -> 0x400d0020, 74 KB
Info : cpu0: Target halted, PC=0x40091856, debug_reason=00000001
Info : Auto-detected flash bank 'esp32.flash' size 4096 KB
Info : Using flash bank 'esp32.flash' size 4096 KB
Info : cpu0: Target halted, PC=0x40091856, debug_reason=00000001
Info : Flash mapping 0: 0x10020 -> 0x3f400020, 20 KB
Info : Flash mapping 1: 0x20020 -> 0x400d0020, 74 KB
Info : Using flash bank 'esp32.irom' size 76 KB
Info : cpu0: Target halted, PC=0x40091856, debug_reason=00000001
Info : Flash mapping 0: 0x10020 -> 0x3f400020, 20 KB
Info : Flash mapping 1: 0x20020 -> 0x400d0020, 74 KB
Info : Using flash bank 'esp32.drom' size 24 KB
Warn : negative reply, retrying
Info : JTAG tap: esp32.cpu0 tap/device found: 0x120034e5 (mfg: 0x272 (Tensilica), part: 0x2003, ver: 0x1)
Info : JTAG tap: esp32.cpu1 tap/device found: 0x120034e5 (mfg: 0x272 (Tensilica), part: 0x2003, ver: 0x1)
Info : cpu0: Debug controller 0 was reset.
Info : cpu0: Core 0 was reset.
Info : cpu0: Target halted, PC=0x500000CF, debug_reason=00000000
Info : esp32: Core 0 was reset.
Info : esp32: Debug controller 1 was reset.
Info : esp32: Core 1 was reset.
Info : Target halted. CPU0: PC=0x40000400 (active)
Info : Target halted. CPU1: PC=0x40000400
Info : Target halted. CPU0: PC=0x400D3848 (active)
Info : Target halted. CPU1: PC=0x00000000
如果提示找不到 build/hello_world.elf 文件,请删除 build 文件夹,使用 make clean 后重新编译烧写程序至 esp32,然后重新进行 4.4 启动 gdb 并开始调试 即可。
4.5 开始 gdb 调试
如果你已经顺利完成以上所有步骤,则你可以开始正常使用 gdb 调试了,例如我在上述步骤完成的基础上在 gdb 终端里输入 list,则可以查看对应的代码,如下:
Thread 1 hit Temporary breakpoint 1, app_main () at ../main/hello_world_main.c:17
17      {
(gdb) list
12      #include "freertos/task.h"
13      #include "esp_system.h"
14      #include "esp_spi_flash.h"
15
16      void app_main(void)
17      {
18          //spi_flash_erase_range(start_addr, size);
19          //spi_flash_erase_range(0x8000,4096);
20          printf("Hello world!\n");
21
(gdb)
开始尽情使用 Jlink 来对 ESP32 进行 gdb 调试吧~
