1、npm安装highchart
npm install highcharts --save
npm install vue-highcharts --save
2、在main.js引入
import highcharts from 'highcharts'
import VueHighCharts from 'vue-highcharts'
import highcharts3d from 'highcharts/highcharts-3d'
highcharts3d(highcharts)
3、在components文件下新建一个highchart.vue组件
<template>
<div class="container">
    <div :id="id" :option="option"></div>
</div>
</template>
<script>
import HighCharts from 'highcharts'
export default {
    props: {
        id: {
            type: String
        },
            //option 是图表的配置数据
        option: {
            type: Object
        }
    },
    mounted() {
        HighCharts.chart(this.id, this.option)
    }
}
</script>
<style scoped>
/* 容器 */
.container {
/*width: 1000px;
height: 550px;*/
}
</style>
4、在需要图表的组件引入highchart.vue组件
<template>
    <div class="charts">
        <pie :id="id" :option="option"></pie>
        <pie :id="id1" :option="option1"></pie>
    </div>
</div>
</template>

<script>
import pie from '../components/highchart.vue'
export default {
    components: {
        pie,
    },
    data() {
        return {
            id: 'test',
            option: {
                chart: {
                    type: 'pie',//饼图
                     options3d: {
                         enabled: true,//使用3d功能
                         alpha: 60,//延y轴向内的倾斜角度
                         beta: 0,
                     }
                },
                title: {
                    text: '3D饼状图'//图表的标题文字
                },
                subtitle: {
                    text: ''//副标题文字
                },
                colors: ['#AA4643', '#89A54E', '#80699B', '#3D96AE','#DB843D', '#92A8CD', '#A47D7C', '#B5CA92'],
                plotOptions: {
                    pie: {
                        allowPointSelect: true,//每个扇块能否选中
                        cursor: 'pointer',//鼠标指针
                        depth: 35,//饼图的厚度
                        dataLabels: {
                            enabled: true,//是否显示饼图的线形tip
                        }
                    }
                },
                series: [
                  {
                    type: 'pie',
                    name: '',//统一的前置词,非必须
                    data: [
                        ['测试1',12],//模块名和所占比,也可以{name: '测试1',y: 12}
                        ['测试2',24],
                        ['测试3',19],
                        ['测试4',290]
                    ]
                  }
                ]
            },
            id1: 'test1',
            option1: {
                chart: {
                  type: 'column',
                  margin: 75,
                  options3d: {
                    enabled: true,
                    alpha: 35,
                    beta: -10,
                    depth: 0,
                  }
                },
                title: {
                    text: '3D柱状图'//图表的标题文字
                },
                subtitle: {
                    text: ''//副标题文字
                },
                xAxis: {
                  categories: [
                    '星期一', '星期二', '星期三', '星期四', '星期五', '星期六', '星期日'
                  ],
                  crosshair: true,
                  labels: {
                      formatter: function() {
                          var labelVal = this.value;
                          var reallyVal = '';
                          var lvl = labelVal.length;
                          if(lvl > 1){
                              for(var i=1;i<=lvl;i++){
                                  reallyVal += labelVal.substr(i-1,1)+"<br/>";
                              }
                          }
                          return reallyVal.substring(0,reallyVal.length-5);
                      }
                  }
                },
                plotOptions: {
                    column: {
                      depth: 25
                    },
                    series: {
                    }
                },
                series: [
                  {
                    data: [
                      {'color':'#AA4643','y':11},
                      {'color':'#89A54E','y':12},
                      {'color':'#80699B','y':13},
                      {'color':'#3D96AE','y':14},
                      {'color':'#DB843D','y':15},
                      {'color':'#92A8CD','y':16},
                      {'color':'#A47D7C','y':17}],
                  }
                ]
            }
        }
    },

}
</script>

<style scoped>

</style>
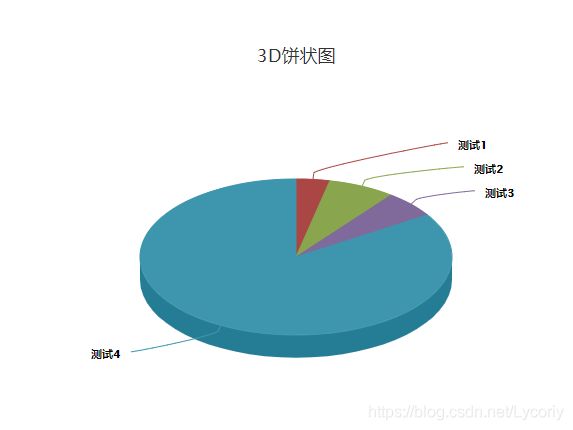
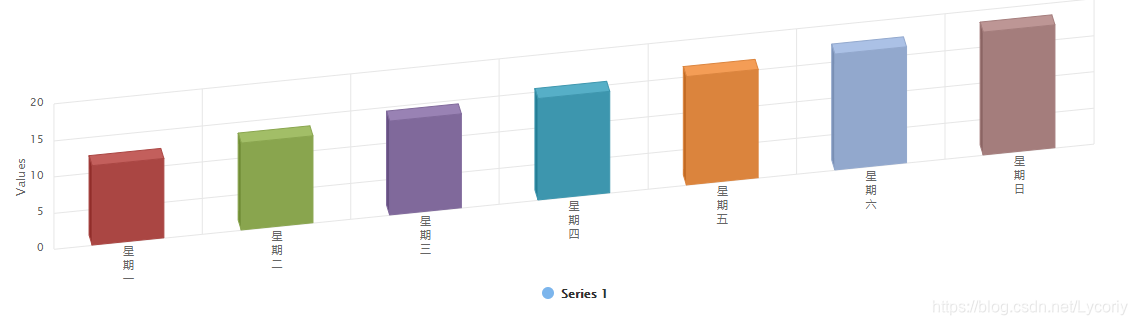
这里是写了两个图表的例子,一个3D饼状图,一个3D柱状图。