目录
prometheus-2.19.2.windows-amd64
1. 系统环境准备
windows_exporter-0.13.0-amd64
A Prometheus exporter for Windows machines. 可以帮助收集windows上的CPU、内存、磁盘、网络
Collectors 指标
| Name | Description | Enabled by default |
|---|---|---|
| ad | Active Directory Domain Services | |
| adfs | Active Directory Federation Services | |
| cpu | CPU usage | ✓ |
| cs | "Computer System" metrics (system properties, num cpus/total memory) | ✓ |
| container | Container metrics | |
| dhcp | DHCP Server | |
| dns | DNS Server | |
| exchange | Exchange metrics | |
| fsrmquota | Microsoft File Server Resource Manager (FSRM) Quotas collector | |
| hyperv | Hyper-V hosts | |
| iis | IIS sites and applications | |
| logical_disk | Logical disks, disk I/O | ✓ |
| logon | User logon sessions | |
| memory | Memory usage metrics | |
| msmq | MSMQ queues | |
| mssql | SQL Server Performance Objects metrics | |
| netframework_clrexceptions | .NET Framework CLR Exceptions | |
| netframework_clrinterop | .NET Framework Interop Metrics | |
| netframework_clrjit | .NET Framework JIT metrics | |
| netframework_clrloading | .NET Framework CLR Loading metrics | |
| netframework_clrlocksandthreads | .NET Framework locks and metrics threads | |
| netframework_clrmemory | .NET Framework Memory metrics | |
| netframework_clrremoting | .NET Framework Remoting metrics | |
| netframework_clrsecurity | .NET Framework Security Check metrics | |
| net | Network interface I/O | ✓ |
| os | OS metrics (memory, processes, users) | ✓ |
| process | Per-process metrics | |
| remote_fx | RemoteFX protocol (RDP) metrics | |
| service | Service state metrics | ✓ |
| system | System calls | ✓ |
| tcp | TCP connections | |
| thermalzone | Thermal information | |
| terminal_services | Terminal services (RDS) | |
| textfile | Read prometheus metrics from a text file | ✓ |
| vmware | Performance counters installed by the Vmware Guest agent |
有关报指标,配置设置和使用示例的更多信息,请参见每个收集器上的链接文档。
nvidia_smi_exporter
他是用于Prometheus的一个nvidia-smi metrics exporter ,可以帮助手机windows中的GPU信息,相当于执行了如下命令
nvidia-smi --query-gpu=name,index,temperature.gpu,utilization.gpu,utilization.memory,memory.total,memory.free,memory.used --format=csv,noheader,nounits
nvidia-smi.exe查看GPU信息
(1)打开cmd窗口(win+R,再输入cmd)
(2)进入C:\Program Files\NVIDIA Corporation\NVSMI中,执行nvidia-smi.exe
C:\Users\Administrator
λ cd C:\Program Files\NVIDIA Corporation\NVSMI

C:\Program Files\NVIDIA Corporation\NVSMI
λ nvidia-smi.exe -l
Fri Aug 28 10:58:21 2020
+-----------------------------------------------------------------------------+
| NVIDIA-SMI 446.14       Driver Version: 446.14       CUDA Version: 11.0     |
|-------------------------------+----------------------+----------------------+
| GPU  Name            TCC/WDDM | Bus-Id        Disp.A | Volatile Uncorr. ECC |
| Fan  Temp  Perf  Pwr:Usage/Cap|         Memory-Usage | GPU-Util  Compute M. |
|===============================+======================+======================|
|   0  GeForce GTX 106... WDDM  | 00000000:01:00.0  On |                  N/A |
| 27%   36C    P8    10W / 120W |   1079MiB /  6144MiB |      2%      Default |
+-------------------------------+----------------------+----------------------+

+-----------------------------------------------------------------------------+
| Processes:                                                                  |
|  GPU                  PID   Type   Process name                  GPU Memory |
|                                                                  Usage      |
|=============================================================================|
|    0                  680    C+G   ...lPanel\SystemSettings.exe    N/A      |
|    0                 1388    C+G   ...U-2019.1.3\bin\idea64.exe    N/A      |
|    0                 1704    C+G   ...w5n1h2txyewy\SearchUI.exe    N/A      |
|    0                 2328    C+G   ...gram\WeChat\WeChatApp.exe    N/A      |
|    0                 3220    C+G   ...sk\baidunetdiskrender.exe    N/A      |
|    0                 5296    C+G   ...y\ShellExperienceHost.exe    N/A      |
|    0                 5940    C+G   ...me\Application\chrome.exe    N/A      |
|    0                 6976    C+G   ...b3d8bbwe\WinStore.App.exe    N/A      |
|    0                 8636    C+G   ...ekyb3d8bbwe\YourPhone.exe    N/A      |
|    0                 8664    C+G   ...es.TextInput.InputApp.exe    N/A      |
|    0                 9880    C+G   ...kyb3d8bbwe\Calculator.exe    N/A      |
|    0                11552    C+G   ...2701\Applet\WeChatApp.exe    N/A      |
|    0                11560    C+G   ...1055.127\DesktopMgr64.exe    N/A      |
|    0                11864    C+G   ...gram\WeChat\wechatweb.exe    N/A      |
|    0                12840    C+G   Insufficient Permissions        N/A      |
|    0                13792    C+G   C:\Windows\explorer.exe         N/A      |
|    0                16004    C+G   ...typora\program\Typora.exe    N/A      |
+-----------------------------------------------------------------------------+
nvidia-smi 输出信息解释
表格中会显示显卡的一些信息,第一行是版本信息,第二行是标题栏,第三行就是具体的显卡信息了,如果有多个显卡,会有多行,每一行的信息值对应标题栏对应位置的信息。
GPU:编号,0
Name:显卡名,NVS 4200M
TCC/WDDM:WDDM
Fan:风扇转速,在0到100%之间变动。N/A,表示没转
Temp:显卡温度,这里是66摄氏度
Perf:性能状态,congP0-P12,P0性能最大,P12最小,这里是P0
Pwr:能耗,Usage是使用量,Cap是总量
BusId:涉及GPU总线
Disp.A:表示GPU的显示是否已经初始化
Memory-Usage:显存使用率,这里才用很少,5%不到
CPU-Util:GPU利用率
Compute M:计算模式
需要注意的一点是显存占用率和GPU占用率是两个不一样的东西,类似于内存和CPU,两个指标的占用率不一定是互相对应的。
prometheus-2.19.2.windows-amd64
下载地址:https://prometheus.io/download/
选择windows 版本即可
grafana-7.1.5.windows-amd64
下载地址:https://grafana.com/grafana/download
选择windows 版本即可
2. 安装wmi-exporter
- 下载地址:https://github.com/martinlindhe/wmi_exporter/releases选择最新msi文件下载安装即可。
- 完成安装后会自动创建一个开机自启的服务,通过服务(services.msc)判断是否有有windows_exporter

- 通过访问http://ip+默认端口9182(如:http://localhost:9182) 出现下图,即代表安装采集数据成功。

3. 安装nvidia_smi_exporter
依赖于go的编译环境
构建
> go build -v nvidia_smi_exporter
会自动生成一个nvidia_smi_exporter.exe文件
运行
> ./nvidia_smi_exporter [<port>]
Default port is 9101
访问:localhost:9101/metrics

temperature_gpu{gpu="TITAN X (Pascal)[0]"} 41
utilization_gpu{gpu="TITAN X (Pascal)[0]"} 0
utilization_memory{gpu="TITAN X (Pascal)[0]"} 0
memory_total{gpu="TITAN X (Pascal)[0]"} 12189
memory_free{gpu="TITAN X (Pascal)[0]"} 12189
memory_used{gpu="TITAN X (Pascal)[0]"} 0
temperature_gpu{gpu="TITAN X (Pascal)[1]"} 78
utilization_gpu{gpu="TITAN X (Pascal)[1]"} 95
utilization_memory{gpu="TITAN X (Pascal)[1]"} 59
memory_total{gpu="TITAN X (Pascal)[1]"} 12189
memory_free{gpu="TITAN X (Pascal)[1]"} 1738
memory_used{gpu="TITAN X (Pascal)[1]"} 10451
temperature_gpu{gpu="TITAN X (Pascal)[2]"} 83
utilization_gpu{gpu="TITAN X (Pascal)[2]"} 99
utilization_memory{gpu="TITAN X (Pascal)[2]"} 82
memory_total{gpu="TITAN X (Pascal)[2]"} 12189
memory_free{gpu="TITAN X (Pascal)[2]"} 190
memory_used{gpu="TITAN X (Pascal)[2]"} 11999
temperature_gpu{gpu="TITAN X (Pascal)[3]"} 84
utilization_gpu{gpu="TITAN X (Pascal)[3]"} 97
utilization_memory{gpu="TITAN X (Pascal)[3]"} 76
memory_total{gpu="TITAN X (Pascal)[3]"} 12189
memory_free{gpu="TITAN X (Pascal)[3]"} 536
memory_used{gpu="TITAN X (Pascal)[3]"} 11653
等价Command
nvidia-smi --query-gpu=name,index,temperature.gpu,utilization.gpu,utilization.memory,memory.total,memory.free,memory.used --format=csv,noheader,nounits
Prometheus 配置
- job_name: "gpu_exporter"
  static_configs:
  - targets: ['localhost:9101']
4. 安装prometheus
- 下载地址:https://prometheus.io/download/
- 选择windows 版本即可
prometheus配置
下载解压后,修改配置文件,修改新增windows_exporter、nvidia_smi_exporter数据采集器配置:
# my global config
global:
  scrape_interval:     15s # Set the scrape interval to every 15 seconds. Default is every 1 minute.
  evaluation_interval: 15s # Evaluate rules every 15 seconds. The default is every 1 minute.
  # scrape_timeout is set to the global default (10s).

# Alertmanager configuration
alerting:
  alertmanagers:
  - static_configs:
    - targets:
      # - alertmanager:9093

# Load rules once and periodically evaluate them according to the global 'evaluation_interval'.
rule_files:
  # - "first_rules.yml"
  # - "second_rules.yml"

# A scrape configuration containing exactly one endpoint to scrape:
# Here it's Prometheus itself.
scrape_configs:
  # The job name is added as a label `job=<job_name>` to any timeseries scraped from this config.
  - job_name: 'Win-162'
    # metrics_path defaults to '/metrics'
    # scheme defaults to 'http'.
    static_configs:
    - targets: ['10.0.50.162:9182']
  # The job name is added as a label `job=<job_name>` to any timeseries scraped from this config.
  - job_name: 'Win-162-GPU'
    # metrics_path defaults to '/metrics'
    # scheme defaults to 'http'.
    static_configs:
    - targets: ['10.0.50.162:9101']
prometheus启动
启动,cmd进入安装目录(& – -> 后台运行)
prometheus.exe --config.file=prometheus.yml --web.listen-address=:9090 &
访问prometheus
访问 http://ip:9090 ,(如:http://localhost:9090)出现如下界面即为prometheus安装成功、数据采集器验证成功 (PS: up为成功,down 为不成功。)


5. 安装Grafana
- 下载地址:https://grafana.com/grafana/download
- 选择windows 版本即可
启动Grafana
解压完成,进入bin目录启动grafana-server.exe 打开浏览器访问 http://ip:3000,(如:http://localhost:3000) 用户名/密码 admin/admin
Grafana配置数据源
Configuration -- Add data source --- Prometheus , 输入名称,prometheus的访问url ,点击保存测试,验证是否成功

Grafana选择监控仪表盘
访问地址:https://grafana.com/dashboards --- serch框输入windows ---- 选择心仪模板 (注意模板所支持的数据源为prometheus) ----- 进行 ID 或者JOSN文件两种方式导入。
推荐使用ID
仪表盘模板推荐
模板ID: 10467
-- Windows的Prometheus监控看板展示,增加了资源汇总展示,优化了明细展示。更新支持windows_exporter 0.13.0。
模板导入成功即可看到监控数据
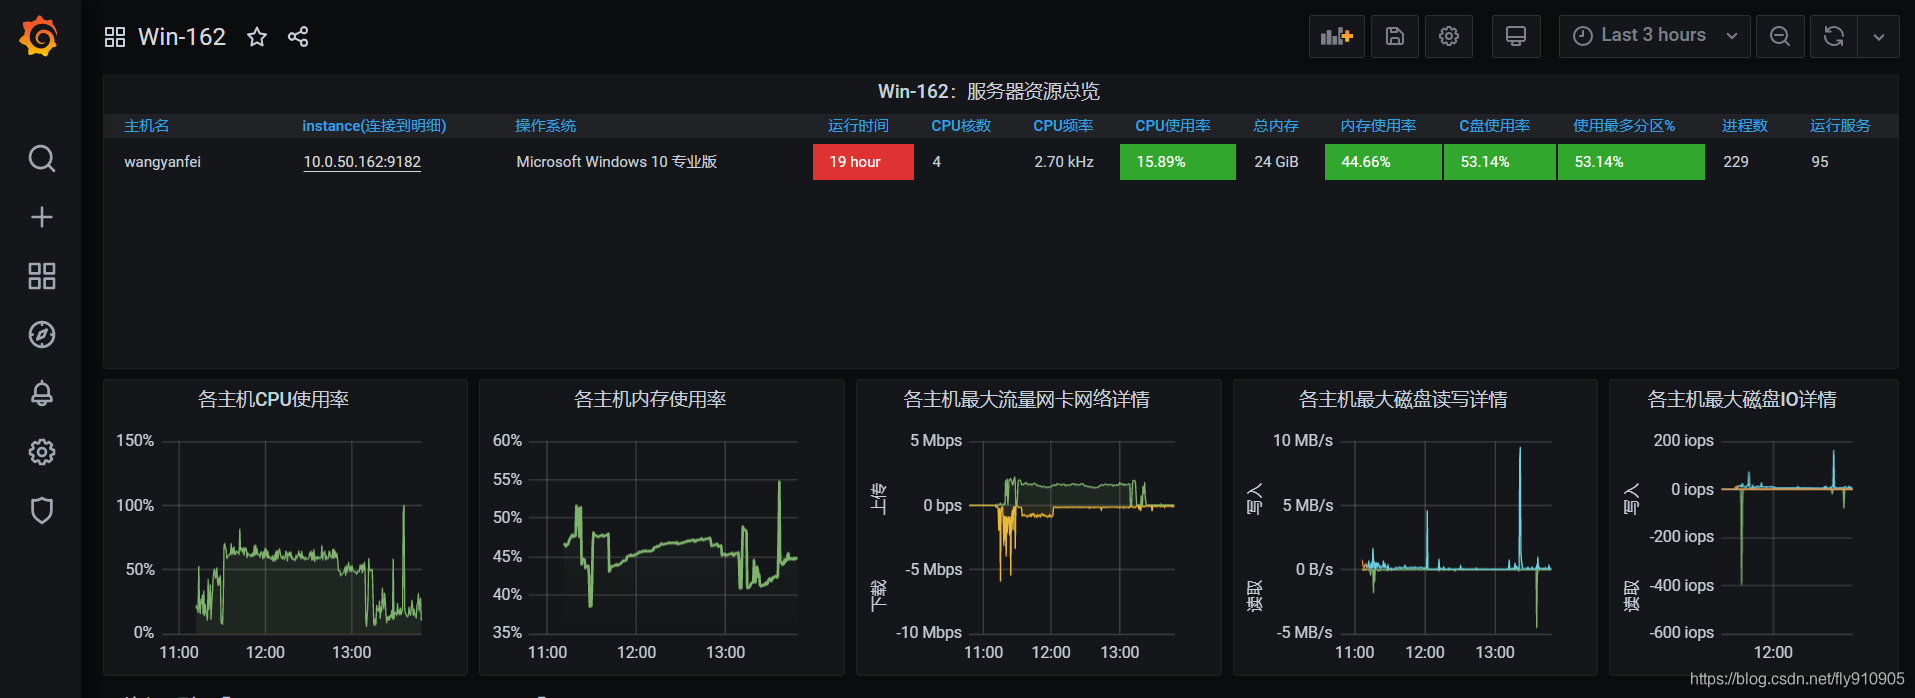
但是他没有GPU信息,我们通过添加panel来显示GPU的温度和使用率,改造后的仪表盘JOSN文件
{
"annotations": {
"list": [
{
"builtIn": 1,
"datasource": "-- Grafana --",
"enable": true,
"hide": true,
"iconColor": "rgba(0, 211, 255, 1)",
"name": "Annotations & Alerts",
"type": "dashboard"
}
]
},
"description": "Windows的Prometheus监控看板展示,增加了资源汇总展示,优化了明细展示。更新支持windows_exporter 0.13.0。同时支持nvidia_smi_exporter的GPU温度和使用率展示",
"editable": true,
"gnetId": 10467,
"graphTooltip": 1,
"id": 1,
"iteration": 1598863585509,
"links": [
{
"asDropdown": true,
"icon": "external link",
"tags": [],
"targetBlank": true,
"type": "dashboards"
}
],
"panels": [
{
"collapsed": false,
"datasource": "Prometheus",
"gridPos": {
"h": 1,
"w": 24,
"x": 0,
"y": 0
},
"id": 41,
"panels": [],
"title": "资源总览(关联JOB项)当前选中主机:【$show_hostname】实例:$instance",
"type": "row"
},
{
"columns": [],
"datasource": "Prometheus",
"fieldConfig": {
"defaults": {
"custom": {}
},
"overrides": []
},
"fontSize": "80%",
"gridPos": {
"h": 6,
"w": 24,
"x": 0,
"y": 1
},
"id": 45,
"pageSize": null,
"showHeader": true,
"sort": {
"col": 0,
"desc": true
},
"styles": [
{
"alias": "操作系统",
"align": "auto",
"colorMode": null,
"colors": [
"rgba(245, 54, 54, 0.9)",
"rgba(237, 129, 40, 0.89)",
"rgba(50, 172, 45, 0.97)"
],
"dateFormat": "YYYY-MM-DD HH:mm:ss",
"decimals": 2,
"mappingType": 1,
"pattern": "product",
"preserveFormat": false,
"sanitize": false,
"thresholds": [],
"type": "string",
"unit": "short",
"valueMaps": []
},
{
"alias": "主机名",
"align": "auto",
"colorMode": null,
"colors": [
"rgba(245, 54, 54, 0.9)",
"rgba(237, 129, 40, 0.89)",
"rgba(50, 172, 45, 0.97)"
],
"dateFormat": "YYYY-MM-DD HH:mm:ss",
"decimals": 2,
"link": false,
"linkTooltip": "",
"linkUrl": "",
"mappingType": 1,
"pattern": "hostname",
"preserveFormat": false,
"thresholds": [],
"type": "string",
"unit": "short"
},
{
"alias": "instance(连接到明细)",
"align": "auto",
"colorMode": null,
"colors": [
"rgba(245, 54, 54, 0.9)",
"rgba(237, 129, 40, 0.89)",
"rgba(50, 172, 45, 0.97)"
],
"dateFormat": "YYYY-MM-DD HH:mm:ss",
"decimals": 2,
"link": true,
"linkTargetBlank": false,
"linkTooltip": "${__cell_4}",
"linkUrl": "/d/Kdh0OoSGz/?var-job=${__cell_5}&var-hostname=All&var-instance=${__cell_4}",
"mappingType": 1,
"pattern": "instance",
"thresholds": [],
"type": "string",
"unit": "short"
},
{
"alias": "CPU核数",
"align": "auto",
"colorMode": null,
"colors": [
"rgba(245, 54, 54, 0.9)",
"rgba(237, 129, 40, 0.89)",
"rgba(50, 172, 45, 0.97)"
],
"dateFormat": "YYYY-MM-DD HH:mm:ss",
"decimals": 2,
"mappingType": 1,
"pattern": "Value #B",
"thresholds": [],
"type": "string",
"unit": "short"
},
{
"alias": "总内存",
"align": "auto",
"colorMode": null,
"colors": [
"rgba(245, 54, 54, 0.9)",
"rgba(237, 129, 40, 0.89)",
"rgba(50, 172, 45, 0.97)"
],
"dateFormat": "YYYY-MM-DD HH:mm:ss",
"decimals": null,
"mappingType": 1,
"pattern": "Value #C",
"thresholds": [],
"type": "number",
"unit": "bytes"
},
{
"alias": "运行时间",
"align": "auto",
"colorMode": "cell",
"colors": [
"rgba(245, 54, 54, 0.9)",
"rgba(237, 129, 40, 0.89)",
"rgba(50, 172, 45, 0.97)"
],
"dateFormat": "YYYY-MM-DD HH:mm:ss",
"decimals": null,
"mappingType": 1,
"pattern": "Value #D",
"thresholds": [
"259200",
"432000"
],
"type": "number",
"unit": "s"
},
{
"alias": "C盘使用率",
"align": "auto",
"colorMode": "cell",
"colors": [
"rgba(50, 172, 45, 0.97)",
"rgba(237, 129, 40, 0.89)",
"rgba(245, 54, 54, 0.9)"
],
"dateFormat": "YYYY-MM-DD HH:mm:ss",
"decimals": 2,
"mappingType": 1,
"pattern": "Value #E",
"thresholds": [
"60",
"80"
],
"type": "number",
"unit": "percentunit"
},
{
"alias": "使用最多分区%",
"align": "auto",
"colorMode": "cell",
"colors": [
"rgba(50, 172, 45, 0.97)",
"rgba(237, 129, 40, 0.89)",
"rgba(245, 54, 54, 0.9)"
],
"dateFormat": "YYYY-MM-DD HH:mm:ss",
"decimals": 2,
"mappingType": 1,
"pattern": "Value #F",
"thresholds": [
"60",
"80"
],
"type": "number",
"unit": "percentunit"
},
{
"alias": "进程数",
"align": "auto",
"colorMode": null,
"colors": [
"rgba(245, 54, 54, 0.9)",
"rgba(237, 129, 40, 0.89)",
"rgba(50, 172, 45, 0.97)"
],
"dateFormat": "YYYY-MM-DD HH:mm:ss",
"decimals": 2,
"link": false,
"mappingType": 1,
"pattern": "Value #G",
"thresholds": [],
"type": "string",
"unit": "short"
},
{
"alias": "运行服务",
"align": "auto",
"colorMode": null,
"colors": [
"rgba(245, 54, 54, 0.9)",
"rgba(237, 129, 40, 0.89)",
"rgba(50, 172, 45, 0.97)"
],
"dateFormat": "YYYY-MM-DD HH:mm:ss",
"decimals": 2,
"mappingType": 1,
"pattern": "Value #H",
"thresholds": [],
"type": "string",
"unit": "short"
},
{
"alias": "CPU使用率",
"align": "auto",
"colorMode": "cell",
"colors": [
"rgba(50, 172, 45, 0.97)",
"rgba(237, 129, 40, 0.89)",
"rgba(245, 54, 54, 0.9)"
],
"dateFormat": "YYYY-MM-DD HH:mm:ss",
"decimals": 2,
"mappingType": 1,
"pattern": "Value #I",
"thresholds": [
"50",
"70"
],
"type": "number",
"unit": "percent"
},
{
"alias": "内存使用率",
"align": "auto",
"colorMode": "cell",
"colors": [
"rgba(50, 172, 45, 0.97)",
"rgba(237, 129, 40, 0.89)",
"rgba(245, 54, 54, 0.9)"
],
"dateFormat": "YYYY-MM-DD HH:mm:ss",
"decimals": 2,
"mappingType": 1,
"pattern": "Value #J",
"thresholds": [
"60",
"80"
],
"type": "number",
"unit": "percent"
},
{
"alias": "CPU频率",
"align": "auto",
"colorMode": null,
"colors": [
"rgba(245, 54, 54, 0.9)",
"rgba(237, 129, 40, 0.89)",
"rgba(50, 172, 45, 0.97)"
],
"dateFormat": "YYYY-MM-DD HH:mm:ss",
"decimals": 2,
"mappingType": 1,
"pattern": "Value #K",
"thresholds": [],
"type": "number",
"unit": "rothz"
},
{
"alias": "",
"align": "right",
"colorMode": null,
"colors": [
"rgba(245, 54, 54, 0.9)",
"rgba(237, 129, 40, 0.89)",
"rgba(50, 172, 45, 0.97)"
],
"decimals": 2,
"pattern": "/.*/",
"thresholds": [],
"type": "hidden",
"unit": "short"
}
],
"targets": [
{
"expr": "windows_os_info{job=~\"$job\"} * on(instance) group_right(product) windows_cs_hostname",
"format": "table",
"instant": true,
"interval": "",
"legendFormat": "",
"refId": "A"
},
{
"expr": "time() - windows_system_system_up_time{job=~\"$job\"}",
"format": "table",
"instant": true,
"interval": "",
"legendFormat": "",
"refId": "D"
},
{
"expr": "windows_cs_logical_processors{job=~\"$job\"} - 0",
"format": "table",
"instant": true,
"interval": "",
"legendFormat": "",
"refId": "B"
},
{
"expr": "avg by (instance) (windows_cpu_core_frequency_mhz{job=~\"$job\"})",
"format": "table",
"instant": true,
"interval": "",
"legendFormat": "",
"refId": "K"
},
{
"expr": "100 - (avg by (instance) (irate(windows_cpu_time_total{job=~\"$job\",mode=\"idle\"}[2m])) * 100)",
"format": "table",
"instant": true,
"interval": "",
"legendFormat": "CPU使用率",
"refId": "I"
},
{
"expr": "windows_cs_physical_memory_bytes{job=~\"$job\"} - 0",
"format": "table",
"instant": true,
"interval": "",
"legendFormat": "",
"refId": "C"
},
{
"expr": "100 - 100 * windows_os_physical_memory_free_bytes{job=~\"$job\"} / windows_cs_physical_memory_bytes{job=~\"$job\"}",
"format": "table",
"instant": true,
"interval": "",
"legendFormat": "内存使用率",
"refId": "J"
},
{
"expr": "1 - (windows_logical_disk_free_bytes{job=~\"$job\",volume=~\"C:\"}/windows_logical_disk_size_bytes{job=~\"$job\",volume=~\"C:\"})",
"format": "table",
"instant": true,
"interval": "",
"legendFormat": "",
"refId": "E"
},
{
"expr": "max by (instance) (1-windows_logical_disk_free_bytes/windows_logical_disk_size_bytes)",
"format": "table",
"instant": true,
"interval": "",
"legendFormat": "",
"refId": "F"
},
{
"expr": "windows_os_processes{job=~\"$job\"}",
"format": "table",
"instant": true,
"interval": "",
"legendFormat": "",
"refId": "G"
},
{
"expr": "sum by (instance) (windows_service_state{job=~\"$job\",state=~\"running\"})",
"format": "table",
"instant": true,
"interval": "",
"legendFormat": "",
"refId": "H"
}
],
"timeFrom": null,
"timeShift": null,
"title": "$job:服务器资源总览",
"transform": "table",
"type": "table-old"
},
{
"aliasColors": {},
"bars": false,
"dashLength": 10,
"dashes": false,
"datasource": "Prometheus",
"decimals": 1,
"fieldConfig": {
"defaults": {
"custom": {}
},
"overrides": []
},
"fill": 1,
"fillGradient": 0,
"gridPos": {
"h": 6,
"w": 8,
"x": 0,
"y": 7
},
"hiddenSeries": false,
"id": 47,
"legend": {
"alignAsTable": true,
"avg": true,
"current": true,
"max": true,
"min": false,
"rightSide": true,
"show": false,
"sort": "current",
"sortDesc": false,
"total": false,
"values": true
},
"lines": true,
"linewidth": 1,
"links": [],
"nullPointMode": "null",
"paceLength": 10,
"percentage": false,
"pluginVersion": "7.1.5",
"pointradius": 5,
"points": false,
"renderer": "flot",
"seriesOverrides": [],
"spaceLength": 10,
"stack": false,
"steppedLine": false,
"targets": [
{
"expr": "100 - (avg by (instance) (irate(windows_cpu_time_total{job=~\"$job\",mode=\"idle\"}[2m])) * 100)",
"hide": false,
"interval": "",
"intervalFactor": 1,
"legendFormat": "{{instance}}",
"refId": "B"
}
],
"thresholds": [],
"timeFrom": null,
"timeRegions": [],
"timeShift": null,
"title": "各主机CPU使用率",
"tooltip": {
"shared": true,
"sort": 2,
"value_type": "cumulative"
},
"type": "graph",
"xaxis": {
"buckets": null,
"mode": "time",
"name": null,
"show": true,
"values": []
},
"yaxes": [
{
"format": "percent",
"label": null,
"logBase": 1,
"max": null,
"min": "0",
"show": true
},
{
"format": "short",
"label": null,
"logBase": 1,
"max": null,
"min": null,
"show": false
}
],
"yaxis": {
"align": false,
"alignLevel": null
}
},
{
"aliasColors": {},
"bars": false,
"dashLength": 10,
"dashes": false,
"datasource": "Prometheus",
"decimals": 1,
"fieldConfig": {
"defaults": {
"custom": {}
},
"overrides": []
},
"fill": 1,
"fillGradient": 0,
"gridPos": {
"h": 6,
"w": 8,
"x": 8,
"y": 7
},
"hiddenSeries": false,
"id": 56,
"legend": {
"alignAsTable": true,
"avg": true,
"current": true,
"max": true,
"min": false,
"rightSide": true,
"show": false,
"sort": "current",
"sortDesc": false,
"total": false,
"values": true
},
"lines": true,
"linewidth": 1,
"links": [],
"nullPointMode": "null",
"paceLength": 10,
"percentage": false,
"pluginVersion": "7.1.5",
"pointradius": 5,
"points": false,
"renderer": "flot",
"seriesOverrides": [],
"spaceLength": 10,
"stack": false,
"steppedLine": false,
"targets": [
{
"expr": "utilization_gpu",
"hide": false,
"interval": "",
"intervalFactor": 1,
"legendFormat": "{{instance}}_GPU",
"refId": "B"
}
],
"thresholds": [],
"timeFrom": null,
"timeRegions": [],
"timeShift": null,
"title": "各主机GPU使用率",
"tooltip": {
"shared": true,
"sort": 2,
"value_type": "cumulative"
},
"type": "graph",
"xaxis": {
"buckets": null,
"mode": "time",
"name": null,
"show": true,
"values": []
},
"yaxes": [
{
"format": "percent",
"label": null,
"logBase": 1,
"max": null,
"min": "0",
"show": true
},
{
"format": "short",
"label": null,
"logBase": 1,
"max": null,
"min": null,
"show": false
}
],
"yaxis": {
"align": false,
"alignLevel": null
}
},
{
"aliasColors": {
"Free Physical memory": "semi-dark-green",
"Free physical memory": "semi-dark-green",
"Free virtual memory": "super-light-blue",
"Physical memory": "dark-red",
"Virtual memory": "dark-blue"
},
"bars": false,
"dashLength": 10,
"dashes": false,
"datasource": "Prometheus",
"fieldConfig": {
"defaults": {
"custom": {}
},
"overrides": []
},
"fill": 1,
"fillGradient": 1,
"gridPos": {
"h": 6,
"w": 8,
"x": 16,
"y": 7
},
"hiddenSeries": false,
"hideTimeOverride": false,
"id": 49,
"legend": {
"alignAsTable": true,
"avg": true,
"current": true,
"max": true,
"min": false,
"rightSide": true,
"show": false,
"sort": "current",
"sortDesc": true,
"total": false,
"values": true
},
"lines": true,
"linewidth": 2,
"links": [],
"nullPointMode": "null",
"percentage": false,
"pluginVersion": "7.1.5",
"pointradius": 5,
"points": false,
"renderer": "flot",
"seriesOverrides": [
{
"alias": "/.*Physical.*/",
"linewidth": 3
}
],
"spaceLength": 10,
"stack": false,
"steppedLine": false,
"targets": [
{
"expr": "100.0 - 100 * windows_os_physical_memory_free_bytes{job=~\"$job\"} / windows_cs_physical_memory_bytes{job=~\"$job\"}",
"instant": false,
"interval": "",
"legendFormat": "{{instance}}",
"refId": "A"
}
],
"thresholds": [],
"timeFrom": null,
"timeRegions": [],
"timeShift": null,
"title": "各主机内存使用率",
"tooltip": {
"shared": true,
"sort": 0,
"value_type": "individual"
},
"type": "graph",
"xaxis": {
"buckets": null,
"mode": "time",
"name": null,
"show": true,
"values": []
},
"yaxes": [
{
"format": "percent",
"label": null,
"logBase": 1,
"max": null,
"min": null,
"show": true
},
{
"format": "short",
"label": null,
"logBase": 1,
"max": null,
"min": null,
"show": false
}
],
"yaxis": {
"align": false,
"alignLevel": null
}
},
{
"aliasColors": {},
"bars": false,
"dashLength": 10,
"dashes": false,
"datasource": "Prometheus",
"decimals": 1,
"fieldConfig": {
"defaults": {
"custom": {}
},
"overrides": []
},
"fill": 1,
"fillGradient": 0,
"gridPos": {
"h": 6,
"w": 5,
"x": 0,
"y": 13
},
"hiddenSeries": false,
"id": 57,
"legend": {
"alignAsTable": true,
"avg": true,
"current": true,
"max": true,
"min": false,
"rightSide": true,
"show": false,
"sort": "current",
"sortDesc": false,
"total": false,
"values": true
},
"lines": true,
"linewidth": 1,
"links": [],
"nullPointMode": "null",
"paceLength": 10,
"percentage": false,
"pluginVersion": "7.1.5",
"pointradius": 5,
"points": false,
"renderer": "flot",
"seriesOverrides": [],
"spaceLength": 10,
"stack": false,
"steppedLine": false,
"targets": [
{
"expr": "temperature_gpu",
"hide": false,
"interval": "",
"intervalFactor": 1,
"legendFormat": "{{instance}}_GPU",
"refId": "B"
}
],
"thresholds": [],
"timeFrom": null,
"timeRegions": [],
"timeShift": null,
"title": "各主机GPU温度",
"tooltip": {
"shared": true,
"sort": 2,
"value_type": "cumulative"
},
"type": "graph",
"xaxis": {
"buckets": null,
"mode": "time",
"name": null,
"show": true,
"values": []
},
"yaxes": [
{
"format": "celsius",
"label": null,
"logBase": 1,
"max": null,
"min": "0",
"show": true
},
{
"format": "short",
"label": null,
"logBase": 1,
"max": null,
"min": null,
"show": false
}
],
"yaxis": {
"align": false,
"alignLevel": null
}
},
{
"aliasColors": {},
"bars": false,
"dashLength": 10,
"dashes": false,
"datasource": "Prometheus",
"fieldConfig": {
"defaults": {
"custom": {}
},
"overrides": []
},
"fill": 1,
"fillGradient": 0,
"gridPos": {
"h": 6,
"w": 5,
"x": 5,
"y": 13
},
"hiddenSeries": false,
"hideTimeOverride": false,
"id": 53,
"legend": {
"alignAsTable": true,
"avg": true,
"current": true,
"max": true,
"min": false,
"rightSide": true,
"show": false,
"sort": "max",
"sortDesc": true,
"total": false,
"values": true
},
"lines": true,
"linewidth": 1,
"links": [],
"nullPointMode": "null as zero",
"percentage": false,
"pluginVersion": "7.1.5",
"pointradius": 5,
"points": false,
"renderer": "flot",
"seriesOverrides": [],
"spaceLength": 10,
"stack": false,
"steppedLine": false,
"targets": [
{
"application": {
"filter": ""
},
"expr": "max by (instance) (irate(windows_net_bytes_sent_total{job=~\"$job\",nic!~'isatap.*|VPN.*'}[2m]))*8",
"format": "time_series",
"functions": [],
"group": {
"filter": ""
},
"hide": false,
"host": {
"filter": ""
},
"interval": "",
"intervalFactor": 1,
"item": {
"filter": ""
},
"legendFormat": "{{instance}}_上传",
"metric": "mysql_global_status_questions",
"mode": 0,
"options": {
"showDisabledItems": false
},
"refId": "B",
"step": 10
},
{
"application": {
"filter": ""
},
"expr": "-max by (instance) (irate(windows_net_bytes_received_total{job=~\"$job\",nic!~'isatap.*|VPN.*'}[2m]))*8",
"format": "time_series",
"functions": [],
"group": {
"filter": ""
},
"hide": false,
"host": {
"filter": ""
},
"interval": "",
"intervalFactor": 1,
"item": {
"filter": ""
},
"legendFormat": "{{instance}}_下载",
"metric": "mysql_global_status_questions",
"mode": 0,
"options": {
"showDisabledItems": false
},
"refId": "A",
"step": 10
}
],
"thresholds": [],
"timeFrom": null,
"timeRegions": [],
"timeShift": null,
"title": "各主机最大流量网卡网络详情",
"tooltip": {
"shared": true,
"sort": 2,
"value_type": "individual"
},
"type": "graph",
"xaxis": {
"buckets": null,
"mode": "time",
"name": null,
"show": true,
"values": []
},
"yaxes": [
{
"format": "bps",
"label": "下载 上传",
"logBase": 1,
"max": null,
"min": null,
"show": true
},
{
"format": "short",
"label": null,
"logBase": 1,
"max": null,
"min": null,
"show": false
}
],
"yaxis": {
"align": false,
"alignLevel": null
}
},
{
"aliasColors": {},
"bars": false,
"dashLength": 10,
"dashes": false,
"datasource": "Prometheus",
"fieldConfig": {
"defaults": {
"custom": {}
},
"overrides": []
},
"fill": 2,
"fillGradient": 0,
"gridPos": {
"h": 6,
"w": 8,
"x": 10,
"y": 13
},
"hiddenSeries": false,
"hideTimeOverride": false,
"id": 51,
"legend": {
"alignAsTable": true,
"avg": true,
"current": true,
"max": true,
"min": false,
"rightSide": true,
"show": false,
"sort": "max",
"sortDesc": true,
"total": false,
"values": true
},
"lines": true,
"linewidth": 1,
"links": [],
"nullPointMode": "null",
"percentage": false,
"pluginVersion": "7.1.5",
"pointradius": 5,
"points": false,
"renderer": "flot",
"seriesOverrides": [],
"spaceLength": 10,
"stack": false,
"steppedLine": false,
"targets": [
{
"application": {
"filter": ""
},
"expr": "-max by (instance) (irate(windows_logical_disk_read_bytes_total[2m]))",
"format": "time_series",
"functions": [],
"group": {
"filter": ""
},
"hide": false,
"host": {
"filter": ""
},
"interval": "",
"intervalFactor": 1,
"item": {
"filter": ""
},
"legendFormat": "{{instance}}_读取",
"metric": "mysql_global_status_questions",
"mode": 0,
"options": {
"showDisabledItems": false
},
"refId": "A",
"step": 20
},
{
"application": {
"filter": ""
},
"expr": "max by (instance) (irate(windows_logical_disk_write_bytes_total[2m]))",
"format": "time_series",
"functions": [],
"group": {
"filter": ""
},
"hide": false,
"host": {
"filter": ""
},
"interval": "",
"intervalFactor": 1,
"item": {
"filter": ""
},
"legendFormat": "{{instance}}_写入",
"metric": "mysql_global_status_questions",
"mode": 0,
"options": {
"showDisabledItems": false
},
"refId": "B",
"step": 20
}
],
"thresholds": [],
"timeFrom": null,
"timeRegions": [],
"timeShift": null,
"title": "各主机最大磁盘读写详情",
"tooltip": {
"shared": true,
"sort": 2,
"value_type": "individual"
},
"type": "graph",
"xaxis": {
"buckets": null,
"mode": "time",
"name": null,
"show": true,
"values": []
},
"yaxes": [
{
"format": "Bps",
"label": "读取 写入",
"logBase": 1,
"max": null,
"min": null,
"show": true
},
{
"decimals": null,
"format": "iops",
"label": "",
"logBase": 1,
"max": null,
"min": null,
"show": false
}
],
"yaxis": {
"align": false,
"alignLevel": null
}
},
{
"aliasColors": {},
"bars": false,
"dashLength": 10,
"dashes": false,
"datasource": "Prometheus",
"fieldConfig": {
"defaults": {
"custom": {}
},
"overrides": []
},
"fill": 1,
"fillGradient": 0,
"gridPos": {
"h": 6,
"w": 6,
"x": 18,
"y": 13
},
"hiddenSeries": false,
"hideTimeOverride": false,
"id": 55,
"legend": {
"alignAsTable": true,
"avg": true,
"current": true,
"max": true,
"min": false,
"rightSide": true,
"show": false,
"sort": "current",
"sortDesc": true,
"total": false,
"values": true
},
"lines": true,
"linewidth": 1,
"links": [],
"nullPointMode": "null as zero",
"percentage": false,
"pluginVersion": "7.1.5",
"pointradius": 5,
"points": false,
"renderer": "flot",
"seriesOverrides": [],
"spaceLength": 10,
"stack": false,
"steppedLine": false,
"targets": [
{
"application": {
"filter": ""
},
"expr": "-max by (instance) (irate(windows_logical_disk_reads_total[2m]))",
"format": "time_series",
"functions": [],
"group": {
"filter": ""
},
"hide": false,
"host": {
"filter": ""
},
"interval": "",
"intervalFactor": 1,
"item": {
"filter": ""
},
"legendFormat": "{{instance}}_读取",
"metric": "mysql_global_status_questions",
"mode": 0,
"options": {
"showDisabledItems": false
},
"refId": "B",
"step": 20
},
{
"application": {
"filter": ""
},
"expr": "max by (instance) (irate(windows_logical_disk_writes_total[2m]))",
"format": "time_series",
"functions": [],
"group": {
"filter": ""
},
"hide": false,
"host": {
"filter": ""
},
"interval": "",
"intervalFactor": 1,
"item": {
"filter": ""
},
"legendFormat": "{{instance}}_写入",
"metric": "mysql_global_status_questions",
"mode": 0,
"options": {
"showDisabledItems": false
},
"refId": "C",
"step": 20
}
],
"thresholds": [],
"timeFrom": null,
"timeRegions": [],
"timeShift": null,
"title": "各主机最大磁盘IO详情",
"tooltip": {
"shared": true,
"sort": 2,
"value_type": "individual"
},
"type": "graph",
"xaxis": {
"buckets": null,
"mode": "time",
"name": null,
"show": true,
"values": []
},
"yaxes": [
{
"format": "iops",
"label": "读取 写入",
"logBase": 1,
"max": null,
"min": null,
"show": true
},
{
"format": "short",
"label": null,
"logBase": 1,
"max": null,
"min": null,
"show": false
}
],
"yaxis": {
"align": false,
"alignLevel": null
}
},
{
"collapsed": false,
"datasource": "Prometheus",
"gridPos": {
"h": 1,
"w": 24,
"x": 0,
"y": 19
},
"id": 43,
"panels": [],
"title": "资源明细【$show_hostname:$instance】",
"type": "row"
},
{
"cacheTimeout": null,
"colorBackground": false,
"colorPostfix": false,
"colorPrefix": false,
"colorValue": true,
"colors": [
"#299c46",
"rgba(237, 129, 40, 0.89)",
"#d44a3a"
],
"datasource": "Prometheus",
"decimals": 0,
"description": "",
"fieldConfig": {
"defaults": {
"custom": {}
},
"overrides": []
},
"format": "s",
"gauge": {
"maxValue": 100,
"minValue": 0,
"show": false,
"thresholdLabels": false,
"thresholdMarkers": true
},
"gridPos": {
"h": 2,
"w": 2,
"x": 0,
"y": 20
},
"id": 33,
"interval": "",
"links": [],
"mappingType": 1,
"mappingTypes": [
{
"name": "value to text",
"value": 1
},
{
"name": "range to text",
"value": 2
}
],
"maxDataPoints": 100,
"nullPointMode": "connected",
"nullText": null,
"postfix": "",
"postfixFontSize": "100%",
"prefix": "",
"prefixFontSize": "100%",
"rangeMaps": [
{
"from": "null",
"text": "N/A",
"to": "null"
}
],
"repeat": "host",
"repeatDirection": "v",
"sparkline": {
"fillColor": "rgba(31, 118, 189, 0.18)",
"full": false,
"lineColor": "rgb(31, 120, 193)",
"show": false
},
"tableColumn": "{instance=\"10.0.50.225:9182\", job=\"Win-225\"}",
"targets": [
{
"expr": "time() - windows_system_system_up_time{job=~\"$job\",instance=~\"$instance\"}",
"instant": false,
"interval": "",
"legendFormat": "",
"refId": "A"
}
],
"thresholds": "",
"timeFrom": null,
"timeShift": null,
"title": "启动时长",
"type": "singlestat",
"valueFontSize": "80%",
"valueMaps": [
{
"op": "=",
"text": "N/A",
"value": "null"
}
],
"valueName": "current"
},
{
"cacheTimeout": null,
"colorBackground": false,
"colorPostfix": true,
"colorValue": true,
"colors": [
"#299c46",
"rgba(237, 129, 40, 0.89)",
"#d44a3a"
],
"datasource": "Prometheus",
"fieldConfig": {
"defaults": {
"custom": {}
},
"overrides": []
},
"format": "percent",
"gauge": {
"maxValue": 100,
"minValue": 0,
"show": true,
"thresholdLabels": false,
"thresholdMarkers": true
},
"gridPos": {
"h": 3,
"w": 2,
"x": 2,
"y": 20
},
"id": 19,
"interval": null,
"links": [],
"mappingType": 1,
"mappingTypes": [
{
"name": "value to text",
"value": 1
},
{
"name": "range to text",
"value": 2
}
],
"maxDataPoints": 100,
"nullPointMode": "connected",
"nullText": null,
"postfix": "",
"postfixFontSize": "50%",
"prefix": "",
"prefixFontSize": "50%",
"rangeMaps": [
{
"from": "null",
"text": "N/A",
"to": "null"
}
],
"sparkline": {
"fillColor": "rgba(31, 118, 189, 0.18)",
"full": false,
"lineColor": "rgb(31, 120, 193)",
"show": true
},
"tableColumn": "",
"targets": [
{
"expr": "100 - (avg(irate(windows_cpu_time_total{job=~\"$job\",instance=~\"$instance\",mode=\"idle\"}[2m])))*100",
"format": "time_series",
"interval": "",
"intervalFactor": 1,
"legendFormat": "",
"refId": "A"
}
],
"thresholds": "60,90",
"title": "CPU使用率",
"type": "singlestat",
"valueFontSize": "80%",
"valueMaps": [
{
"op": "=",
"text": "",
"value": ""
}
],
"valueName": "current"
},
{
"cacheTimeout": null,
"datasource": "Prometheus",
"fieldConfig": {
"defaults": {
"color": {
"mode": "thresholds"
},
"custom": {},
"mappings": [],
"max": 100,
"min": 0,
"thresholds": {
"mode": "absolute",
"steps": [
{
"color": "green",
"value": null
},
{
"color": "#EAB839",
"value": 80
},
{
"color": "red",
"value": 90
}
]
},
"unit": "percent"
},
"overrides": []
},
"gridPos": {
"h": 6,
"w": 4,
"x": 4,
"y": 20
},
"id": 23,
"links": [],
"options": {
"displayMode": "lcd",
"orientation": "horizontal",
"reduceOptions": {
"calcs": [
"lastNotNull"
],
"fields": "",
"values": false
},
"showUnfilled": true
},
"pluginVersion": "7.1.5",
"targets": [
{
"expr": "100 - (windows_logical_disk_free_bytes{job=~\"$job\",instance=~\"$instance\"} / windows_logical_disk_size_bytes{job=~\"$job\",instance=~\"$instance\"})*100",
"instant": false,
"interval": "",
"legendFormat": "{{volume}}",
"refId": "A"
}
],
"timeFrom": null,
"timeShift": null,
"title": "各分区使用率",
"type": "bargauge"
},
{
"aliasColors": {
"Received mysqld-exporter:9104": "#0A50A1",
"stopped": "#2F575E"
},
"bars": false,
"dashLength": 10,
"dashes": false,
"datasource": "Prometheus",
"fieldConfig": {
"defaults": {
"custom": {}
},
"overrides": []
},
"fill": 10,
"fillGradient": 0,
"gridPos": {
"h": 6,
"w": 8,
"x": 8,
"y": 20
},
"hiddenSeries": false,
"id": 7,
"legend": {
"alignAsTable": true,
"avg": false,
"current": true,
"max": false,
"min": false,
"rightSide": true,
"show": true,
"sort": "current",
"sortDesc": true,
"total": false,
"values": true
},
"lines": true,
"linewidth": 0,
"links": [],
"nullPointMode": "null as zero",
"percentage": false,
"pluginVersion": "7.1.5",
"pointradius": 5,
"points": false,
"renderer": "flot",
"seriesOverrides": [],
"spaceLength": 10,
"stack": true,
"steppedLine": false,
"targets": [
{
"application": {
"filter": ""
},
"expr": "sum(windows_service_state{job=~\"$job\",instance=~\"$instance\"}) by (state)",
"format": "time_series",
"functions": [],
"group": {
"filter": ""
},
"host": {
"filter": ""
},
"interval": "",
"intervalFactor": 1,
"item": {
"filter": ""
},
"legendFormat": "{{state}}",
"mode": 0,
"options": {
"showDisabledItems": false
},
"refId": "A",
"step": 5
}
],
"thresholds": [],
"timeFrom": null,
"timeRegions": [],
"timeShift": null,
"title": "服务状态",
"tooltip": {
"shared": true,
"sort": 0,
"value_type": "individual"
},
"type": "graph",
"xaxis": {
"buckets": null,
"mode": "time",
"name": null,
"show": true,
"values": []
},
"yaxes": [
{
"format": "short",
"label": null,
"logBase": 1,
"max": null,
"min": null,
"show": true
},
{
"format": "short",
"label": null,
"logBase": 1,
"max": null,
"min": null,
"show": false
}
],
"yaxis": {
"align": false,
"alignLevel": null
}
},
{
"aliasColors": {},
"bars": false,
"dashLength": 10,
"dashes": false,
"datasource": "Prometheus",
"decimals": null,
"fieldConfig": {
"defaults": {
"custom": {}
},
"overrides": []
},
"fill": 1,
"fillGradient": 0,
"gridPos": {
"h": 6,
"w": 8,
"x": 16,
"y": 20
},
"hiddenSeries": false,
"id": 27,
"legend": {
"alignAsTable": true,
"avg": false,
"current": true,
"max": false,
"min": false,
"rightSide": true,
"show": false,
"total": false,
"values": true
},
"lines": true,
"linewidth": 2,
"links": [],
"nullPointMode": "null",
"paceLength": 10,
"percentage": false,
"pluginVersion": "7.1.5",
"pointradius": 5,
"points": false,
"renderer": "flot",
"seriesOverrides": [
{
"alias": "进程数",
"color": "#B877D9"
}
],
"spaceLength": 10,
"stack": false,
"steppedLine": false,
"targets": [
{
"expr": "windows_os_processes{job=~\"$job\",instance=~\"$instance\"}",
"instant": false,
"interval": "",
"legendFormat": "进程数",
"refId": "A"
}
],
"thresholds": [],
"timeFrom": null,
"timeRegions": [],
"timeShift": null,
"title": "进程数",
"tooltip": {
"shared": true,
"sort": 0,
"value_type": "individual"
},
"type": "graph",
"xaxis": {
"buckets": null,
"mode": "time",
"name": null,
"show": true,
"values": []
},
"yaxes": [
{
"decimals": 0,
"format": "short",
"label": null,
"logBase": 1,
"max": null,
"min": null,
"show": true
},
{
"format": "short",
"label": null,
"logBase": 1,
"max": null,
"min": null,
"show": true
}
],
"yaxis": {
"align": false,
"alignLevel": null
}
},
{
"cacheTimeout": null,
"colorBackground": false,
"colorPostfix": false,
"colorPrefix": false,
"colorValue": true,
"colors": [
"#299c46",
"rgba(237, 129, 40, 0.89)",
"#d44a3a"
],
"datasource": "Prometheus",
"decimals": 0,
"description": "",
"fieldConfig": {
"defaults": {
"custom": {}
},
"overrides": []
},
"format": "none",
"gauge": {
"maxValue": 100,
"minValue": 0,
"show": false,
"thresholdLabels": false,
"thresholdMarkers": true
},
"gridPos": {
"h": 2,
"w": 2,
"x": 0,
"y": 22
},
"id": 35,
"interval": "",
"links": [],
"mappingType": 1,
"mappingTypes": [
{
"name": "value to text",
"value": 1
},
{
"name": "range to text",
"value": 2
}
],
"maxDataPoints": 100,
"nullPointMode": "connected",
"nullText": null,
"postfix": "",
"postfixFontSize": "100%",
"prefix": "",
"prefixFontSize": "100%",
"rangeMaps": [
{
"from": "null",
"text": "N/A",
"to": "null"
}
],
"repeat": "host",
"repeatDirection": "v",
"sparkline": {
"fillColor": "rgba(31, 118, 189, 0.18)",
"full": false,
"lineColor": "rgb(31, 120, 193)",
"show": false
},
"tableColumn": "windows_cs_logical_processors{instance=\"10.0.50.225:9182\", job=\"Win-225\"}",
"targets": [
{
"expr": "windows_cs_logical_processors{job=~\"$job\",instance=~\"$instance\"}",
"format": "time_series",
"instant": false,
"interval": "",
"intervalFactor": 1,
"legendFormat": "",
"refId": "A"
}
],
"thresholds": "",
"timeFrom": null,
"timeShift": null,
"title": "CPU核数",
"type": "singlestat",
"valueFontSize": "80%",
"valueMaps": [
{
"op": "=",
"text": "N/A",
"value": "null"
}
],
"valueName": "current"
},
{
"cacheTimeout": null,
"colorBackground": false,
"colorValue": true,
"colors": [
"#299c46",
"rgba(237, 129, 40, 0.89)",
"#d44a3a"
],
"datasource": "Prometheus",
"decimals": null,
"fieldConfig": {
"defaults": {
"custom": {}
},
"overrides": []
},
"format": "percent",
"gauge": {
"maxValue": 100,
"minValue": 0,
"show": true,
"thresholdLabels": false,
"thresholdMarkers": true
},
"gridPos": {
"h": 3,
"w": 2,
"x": 2,
"y": 23
},
"id": 21,
"interval": null,
"links": [],
"mappingType": 1,
"mappingTypes": [
{
"name": "value to text",
"value": 1
},
{
"name": "range to text",
"value": 2
}
],
"maxDataPoints": 100,
"nullPointMode": "connected",
"nullText": null,
"postfix": "",
"postfixFontSize": "50%",
"prefix": "",
"prefixFontSize": "50%",
"rangeMaps": [
{
"from": "null",
"text": "N/A",
"to": "null"
}
],
"sparkline": {
"fillColor": "rgba(31, 118, 189, 0.18)",
"full": false,
"lineColor": "rgb(31, 120, 193)",
"show": true
},
"tableColumn": "{instance=\"10.0.50.225:9182\", job=\"Win-225\"}",
"targets": [
{
"expr": "100 - (windows_os_physical_memory_free_bytes{job=~\"$job\",instance=~\"$instance\"} / windows_cs_physical_memory_bytes{job=~\"$job\",instance=~\"$instance\"})*100",
"instant": false,
"refId": "A"
}
],
"thresholds": "80,90",
"title": "内存使用率",
"type": "singlestat",
"valueFontSize": "80%",
"valueMaps": [
{
"op": "=",
"text": "N/A",
"value": "null"
}
],
"valueName": "current"
},
{
"cacheTimeout": null,
"colorBackground": false,
"colorPostfix": false,
"colorPrefix": false,
"colorValue": true,
"colors": [
"#299c46",
"rgba(237, 129, 40, 0.89)",
"#d44a3a"
],
"datasource": "Prometheus",
"decimals": 1,
"description": "",
"fieldConfig": {
"defaults": {
"custom": {}
},
"overrides": []
},
"format": "bytes",
"gauge": {
"maxValue": 100,
"minValue": 0,
"show": false,
"thresholdLabels": false,
"thresholdMarkers": true
},
"gridPos": {
"h": 2,
"w": 2,
"x": 0,
"y": 24
},
"id": 37,
"interval": "",
"links": [],
"mappingType": 1,
"mappingTypes": [
{
"name": "value to text",
"value": 1
},
{
"name": "range to text",
"value": 2
}
],
"maxDataPoints": 100,
"nullPointMode": "connected",
"nullText": null,
"postfix": "",
"postfixFontSize": "100%",
"prefix": "",
"prefixFontSize": "100%",
"rangeMaps": [
{
"from": "null",
"text": "N/A",
"to": "null"
}
],
"repeat": "host",
"repeatDirection": "v",
"sparkline": {
"fillColor": "rgba(31, 118, 189, 0.18)",
"full": false,
"lineColor": "rgb(31, 120, 193)",
"show": false
},
"tableColumn": "windows_cs_physical_memory_bytes{instance=\"10.0.50.225:9182\", job=\"Win-225\"}",
"targets": [
{
"expr": "windows_cs_physical_memory_bytes{job=~\"$job\",instance=~\"$instance\"}",
"format": "time_series",
"instant": false,
"interval": "",
"intervalFactor": 1,
"legendFormat": "",
"refId": "A"
}
],
"thresholds": "",
"timeFrom": null,
"timeShift": null,
"title": "总内存",
"type": "singlestat",
"valueFontSize": "80%",
"valueMaps": [
{
"op": "=",
"text": "N/A",
"value": "null"
}
],
"valueName": "current"
},
{
"aliasColors": {},
"bars": false,
"dashLength": 10,
"dashes": false,
"datasource": "Prometheus",
"decimals": 1,
"fieldConfig": {
"defaults": {
"custom": {}
},
"overrides": []
},
"fill": 1,
"fillGradient": 0,
"gridPos": {
"h": 8,
"w": 8,
"x": 0,
"y": 26
},
"hiddenSeries": false,
"id": 25,
"legend": {
"alignAsTable": false,
"avg": true,
"current": true,
"max": true,
"min": true,
"rightSide": false,
"show": true,
"sort": "current",
"sortDesc": true,
"total": false,
"values": true
},
"lines": true,
"linewidth": 1,
"links": [],
"nullPointMode": "null",
"paceLength": 10,
"percentage": false,
"pluginVersion": "7.1.5",
"pointradius": 5,
"points": false,
"renderer": "flot",
"seriesOverrides": [],
"spaceLength": 10,
"stack": true,
"steppedLine": false,
"targets": [
{
"expr": "100 - avg(irate(windows_cpu_time_total{job=~\"$job\",instance=~\"$instance\",mode=\"idle\"}[5m]))*100",
"hide": false,
"interval": "",
"legendFormat": "CPU使用率",
"refId": "A"
}
],
"thresholds": [],
"timeFrom": null,
"timeRegions": [],
"timeShift": null,
"title": "CPU使用率",
"tooltip": {
"shared": true,
"sort": 0,
"value_type": "individual"
},
"type": "graph",
"xaxis": {
"buckets": null,
"mode": "time",
"name": null,
"show": true,
"values": []
},
"yaxes": [
{
"format": "percent",
"label": null,
"logBase": 1,
"max": null,
"min": null,
"show": true
},
{
"format": "short",
"label": null,
"logBase": 1,
"max": null,
"min": null,
"show": false
}
],
"yaxis": {
"align": false,
"alignLevel": null
}
},
{
"aliasColors": {
"Free Physical memory": "semi-dark-green",
"Free physical memory": "semi-dark-green",
"Free virtual memory": "yellow",
"Physical memory": "dark-red",
"Virtual memory": "dark-purple",
"剩余物理内存": "green",
"总物理内存": "dark-red"
},
"bars": false,
"dashLength": 10,
"dashes": false,
"datasource": "Prometheus",
"decimals": 2,
"fieldConfig": {
"defaults": {
"custom": {}
},
"overrides": []
},
"fill": 1,
"fillGradient": 3,
"gridPos": {
"h": 8,
"w": 8,
"x": 8,
"y": 26
},
"hiddenSeries": false,
"hideTimeOverride": false,
"id": 14,
"legend": {
"alignAsTable": true,
"avg": true,
"current": true,
"max": true,
"min": true,
"rightSide": false,
"show": true,
"total": false,
"values": true
},
"lines": true,
"linewidth": 0,
"links": [],
"nullPointMode": "null",
"percentage": false,
"pluginVersion": "7.1.5",
"pointradius": 5,
"points": false,
"renderer": "flot",
"seriesOverrides": [
{
"alias": "/.*物理内存.*/",
"linewidth": 2
}
],
"spaceLength": 10,
"stack": false,
"steppedLine": false,
"targets": [
{
"application": {
"filter": ""
},
"expr": "windows_cs_physical_memory_bytes{job=~\"$job\",instance=~\"$instance\"}",
"format": "time_series",
"functions": [],
"group": {
"filter": ""
},
"hide": false,
"host": {
"filter": ""
},
"interval": "",
"intervalFactor": 1,
"item": {
"filter": ""
},
"legendFormat": "总物理内存",
"metric": "mysql_global_status_questions",
"mode": 0,
"options": {
"showDisabledItems": false
},
"refId": "B",
"step": 5
},
{
"application": {
"filter": ""
},
"expr": "windows_os_physical_memory_free_bytes{job=~\"$job\",instance=~\"$instance\"}",
"format": "time_series",
"functions": [],
"group": {
"filter": ""
},
"hide": false,
"host": {
"filter": ""
},
"interval": "",
"intervalFactor": 1,
"item": {
"filter": ""
},
"legendFormat": "剩余物理内存",
"metric": "mysql_global_status_questions",
"mode": 0,
"options": {
"showDisabledItems": false
},
"refId": "C",
"step": 5
},
{
"application": {
"filter": ""
},
"expr": "windows_os_virtual_memory_bytes{job=~\"$job\",instance=~\"$instance\"}",
"format": "time_series",
"functions": [],
"group": {
"filter": ""
},
"hide": false,
"host": {
"filter": ""
},
"intervalFactor": 1,
"item": {
"filter": ""
},
"legendFormat": "Virtual memory",
"metric": "mysql_global_status_questions",
"mode": 0,
"options": {
"showDisabledItems": false
},
"refId": "A",
"step": 5
},
{
"expr": "windows_os_virtual_memory_free_bytes{job=~\"$job\",instance=~\"$instance\"}",
"format": "time_series",
"intervalFactor": 1,
"legendFormat": "Free virtual memory",
"refId": "D"
}
],
"thresholds": [],
"timeFrom": null,
"timeRegions": [],
"timeShift": null,
"title": "内存详情",
"tooltip": {
"shared": true,
"sort": 2,
"value_type": "individual"
},
"type": "graph",
"xaxis": {
"buckets": null,
"mode": "time",
"name": null,
"show": true,
"values": []
},
"yaxes": [
{
"format": "bytes",
"label": null,
"logBase": 1,
"max": null,
"min": "0",
"show": true
},
{
"format": "short",
"label": null,
"logBase": 1,
"max": null,
"min": null,
"show": false
}
],
"yaxis": {
"align": false,
"alignLevel": null
}
},
{
"aliasColors": {},
"bars": false,
"dashLength": 10,
"dashes": false,
"datasource": "Prometheus",
"fieldConfig": {
"defaults": {
"custom": {}
},
"overrides": []
},
"fill": 0,
"fillGradient": 0,
"gridPos": {
"h": 8,
"w": 8,
"x": 16,
"y": 26
},
"hiddenSeries": false,
"hideTimeOverride": false,
"id": 15,
"legend": {
"alignAsTable": true,
"avg": true,
"current": true,
"max": true,
"min": true,
"rightSide": false,
"show": true,
"total": false,
"values": true
},
"lines": true,
"linewidth": 2,
"links": [],
"nullPointMode": "null as zero",
"percentage": false,
"pluginVersion": "7.1.5",
"pointradius": 5,
"points": false,
"renderer": "flot",
"seriesOverrides": [
{
"alias": "/总空间.*/",
"color": "#F2495C"
}
],
"spaceLength": 10,
"stack": false,
"steppedLine": false,
"targets": [
{
"application": {
"filter": ""
},
"expr": "windows_logical_disk_free_bytes{job=~\"$job\",instance=~\"$instance\"}",
"format": "time_series",
"functions": [],
"group": {
"filter": ""
},
"hide": false,
"host": {
"filter": ""
},
"interval": "",
"intervalFactor": 1,
"item": {
"filter": ""
},
"legendFormat": "剩余空间 {{volume}}",
"metric": "mysql_global_status_questions",
"mode": 0,
"options": {
"showDisabledItems": false
},
"refId": "A",
"step": 20
},
{
"application": {
"filter": ""
},
"expr": "windows_logical_disk_size_bytes{job=~\"$job\",instance=~\"$instance\"}",
"format": "time_series",
"functions": [],
"group": {
"filter": ""
},
"hide": false,
"host": {
"filter": ""
},
"interval": "",
"intervalFactor": 1,
"item": {
"filter": ""
},
"legendFormat": "总空间 {{volume}}",
"metric": "mysql_global_status_questions",
"mode": 0,
"options": {
"showDisabledItems": false
},
"refId": "B",
"step": 20
}
],
"thresholds": [],
"timeFrom": null,
"timeRegions": [],
"timeShift": null,
"title": "磁盘剩余空间",
"tooltip": {
"shared": true,
"sort": 2,
"value_type": "individual"
},
"type": "graph",
"xaxis": {
"buckets": null,
"mode": "time",
"name": null,
"show": true,
"values": []
},
"yaxes": [
{
"format": "decbytes",
"label": null,
"logBase": 1,
"max": null,
"min": "0",
"show": true
},
{
"format": "short",
"label": null,
"logBase": 1,
"max": null,
"min": null,
"show": true
}
],
"yaxis": {
"align": false,
"alignLevel": null
}
},
{
"aliasColors": {},
"bars": false,
"dashLength": 10,
"dashes": false,
"datasource": "Prometheus",
"fieldConfig": {
"defaults": {
"custom": {}
},
"overrides": []
},
"fill": 1,
"fillGradient": 0,
"gridPos": {
"h": 8,
"w": 8,
"x": 0,
"y": 34
},
"hiddenSeries": false,
"hideTimeOverride": false,
"id": 11,
"legend": {
"alignAsTable": true,
"avg": true,
"current": true,
"max": true,
"min": true,
"rightSide": false,
"show": true,
"sort": "max",
"sortDesc": true,
"total": false,
"values": true
},
"lines": true,
"linewidth": 1,
"links": [],
"nullPointMode": "null as zero",
"percentage": false,
"pluginVersion": "7.1.5",
"pointradius": 5,
"points": false,
"renderer": "flot",
"seriesOverrides": [],
"spaceLength": 10,
"stack": false,
"steppedLine": false,
"targets": [
{
"application": {
"filter": ""
},
"expr": "irate(windows_net_bytes_sent_total{job=~\"$job\",instance=~\"$instance\",nic!~'isatap.*|VPN.*'}[5m])*8>0\r",
"format": "time_series",
"functions": [],
"group": {
"filter": ""
},
"hide": false,
"host": {
"filter": ""
},
"interval": "",
"intervalFactor": 1,
"item": {
"filter": ""
},
"legendFormat": "{{nic}}-Sent-上传",
"metric": "mysql_global_status_questions",
"mode": 0,
"options": {
"showDisabledItems": false
},
"refId": "B",
"step": 10
},
{
"application": {
"filter": ""
},
"expr": "irate(windows_net_bytes_received_total{job=~\"$job\",instance=~\"$instance\",nic!~'isatap.*|VPN.*'}[5m])*8\n",
"format": "time_series",
"functions": [],
"group": {
"filter": ""
},
"hide": false,
"host": {
"filter": ""
},
"intervalFactor": 1,
"item": {
"filter": ""
},
"legendFormat": "{{nic}}-Received-下载",
"metric": "mysql_global_status_questions",
"mode": 0,
"options": {
"showDisabledItems": false
},
"refId": "A",
"step": 10
}
],
"thresholds": [],
"timeFrom": null,
"timeRegions": [],
"timeShift": null,
"title": "网络详情",
"tooltip": {
"shared": true,
"sort": 2,
"value_type": "individual"
},
"type": "graph",
"xaxis": {
"buckets": null,
"mode": "time",
"name": null,
"show": true,
"values": []
},
"yaxes": [
{
"format": "bps",
"label": null,
"logBase": 1,
"max": null,
"min": null,
"show": true
},
{
"format": "short",
"label": null,
"logBase": 1,
"max": null,
"min": null,
"show": false
}
],
"yaxis": {
"align": false,
"alignLevel": null
}
},
{
"aliasColors": {},
"bars": false,
"dashLength": 10,
"dashes": false,
"datasource": "Prometheus",
"fieldConfig": {
"defaults": {
"custom": {}
},
"overrides": []
},
"fill": 2,
"fillGradient": 0,
"gridPos": {
"h": 8,
"w": 8,
"x": 8,
"y": 34
},
"hiddenSeries": false,
"hideTimeOverride": false,
"id": 8,
"legend": {
"alignAsTable": true,
"avg": true,
"current": true,
"max": true,
"min": true,
"rightSide": false,
"show": true,
"sort": null,
"sortDesc": null,
"total": false,
"values": true
},
"lines": true,
"linewidth": 1,
"links": [],
"nullPointMode": "null as zero",
"percentage": false,
"pluginVersion": "7.1.5",
"pointradius": 5,
"points": false,
"renderer": "flot",
"seriesOverrides": [],
"spaceLength": 10,
"stack": false,
"steppedLine": false,
"targets": [
{
"application": {
"filter": ""
},
"expr": "irate(windows_logical_disk_read_bytes_total{job=~\"$job\",instance=~\"$instance\"}[5m])\r",
"format": "time_series",
"functions": [],
"group": {
"filter": ""
},
"hide": false,
"host": {
"filter": ""
},
"intervalFactor": 1,
"item": {
"filter": ""
},
"legendFormat": "read {{volume}}",
"metric": "mysql_global_status_questions",
"mode": 0,
"options": {
"showDisabledItems": false
},
"refId": "A",
"step": 20
},
{
"application": {
"filter": ""
},
"expr": "irate(windows_logical_disk_write_bytes_total{job=~\"$job\",instance=~\"$instance\"}[5m])\r",
"format": "time_series",
"functions": [],
"group": {
"filter": ""
},
"hide": false,
"host": {
"filter": ""
},
"intervalFactor": 1,
"item": {
"filter": ""
},
"legendFormat": "write {{volume}}",
"metric": "mysql_global_status_questions",
"mode": 0,
"options": {
"showDisabledItems": false
},
"refId": "B",
"step": 20
}
],
"thresholds": [],
"timeFrom": null,
"timeRegions": [],
"timeShift": null,
"title": "磁盘读写",
"tooltip": {
"shared": true,
"sort": 0,
"value_type": "individual"
},
"type": "graph",
"xaxis": {
"buckets": null,
"mode": "time",
"name": null,
"show": true,
"values": []
},
"yaxes": [
{
"format": "Bps",
"label": null,
"logBase": 1,
"max": null,
"min": null,
"show": true
},
{
"format": "short",
"label": null,
"logBase": 1,
"max": null,
"min": null,
"show": true
}
],
"yaxis": {
"align": false,
"alignLevel": null
}
},
{
"aliasColors": {},
"bars": false,
"dashLength": 10,
"dashes": false,
"datasource": "Prometheus",
"fieldConfig": {
"defaults": {
"custom": {}
},
"overrides": []
},
"fill": 1,
"fillGradient": 0,
"gridPos": {
"h": 8,
"w": 8,
"x": 16,
"y": 34
},
"hiddenSeries": false,
"hideTimeOverride": false,
"id": 9,
"legend": {
"alignAsTable": true,
"avg": true,
"current": true,
"max": true,
"min": true,
"rightSide": false,
"show": true,
"total": false,
"values": true
},
"lines": true,
"linewidth": 1,
"links": [],
"nullPointMode": "null as zero",
"percentage": false,
"pluginVersion": "7.1.5",
"pointradius": 5,
"points": false,
"renderer": "flot",
"seriesOverrides": [],
"spaceLength": 10,
"stack": false,
"steppedLine": false,
"targets": [
{
"application": {
"filter": ""
},
"expr": "irate(windows_logical_disk_reads_total{job=~\"$job\",instance=~\"$instance\"}[5m])",
"format": "time_series",
"functions": [],
"group": {
"filter": ""
},
"hide": false,
"host": {
"filter": ""
},
"intervalFactor": 1,
"item": {
"filter": ""
},
"legendFormat": "read {{volume}}",
"metric": "mysql_global_status_questions",
"mode": 0,
"options": {
"showDisabledItems": false
},
"refId": "B",
"step": 20
},
{
"application": {
"filter": ""
},
"expr": "irate(windows_logical_disk_writes_total{job=~\"$job\",instance=~\"$instance\"}[5m])",
"format": "time_series",
"functions": [],
"group": {
"filter": ""
},
"hide": false,
"host": {
"filter": ""
},
"intervalFactor": 1,
"item": {
"filter": ""
},
"legendFormat": "write {{volume}}",
"metric": "mysql_global_status_questions",
"mode": 0,
"options": {
"showDisabledItems": false
},
"refId": "C",
"step": 20
}
],
"thresholds": [],
"timeFrom": null,
"timeRegions": [],
"timeShift": null,
"title": "磁盘IO",
"tooltip": {
"shared": true,
"sort": 0,
"value_type": "individual"
},
"type": "graph",
"xaxis": {
"buckets": null,
"mode": "time",
"name": null,
"show": true,
"values": []
},
"yaxes": [
{
"format": "iops",
"label": null,
"logBase": 1,
"max": null,
"min": null,
"show": true
},
{
"format": "short",
"label": null,
"logBase": 1,
"max": null,
"min": null,
"show": true
}
],
"yaxis": {
"align": false,
"alignLevel": null
}
},
{
"aliasColors": {},
"bars": true,
"dashLength": 10,
"dashes": false,
"datasource": "Prometheus",
"decimals": 2,
"fieldConfig": {
"defaults": {
"custom": {}
},
"overrides": []
},
"fill": 1,
"fillGradient": 0,
"gridPos": {
"h": 6,
"w": 6,
"x": 0,
"y": 42
},
"hiddenSeries": false,
"hideTimeOverride": false,
"id": 29,
"legend": {
"alignAsTable": true,
"avg": true,
"current": false,
"max": true,
"min": true,
"rightSide": false,
"show": false,
"total": false,
"values": true
},
"lines": false,
"linewidth": 1,
"links": [],
"nullPointMode": "null",
"paceLength": 10,
"percentage": false,
"pluginVersion": "7.1.5",
"pointradius": 5,
"points": false,
"renderer": "flot",
"seriesOverrides": [],
"spaceLength": 10,
"stack": true,
"steppedLine": false,
"targets": [
{
"expr": "(irate(windows_net_bytes_total{job=~\"$job\",instance=~\"$instance\",nic!~'isatap.*|VPN.*'}[5m]) * 8 / windows_net_current_bandwidth{job=~\"$job\",instance=~\"$instance\",nic!~'isatap.*|VPN.*'}) * 100",
"legendFormat": "{{nic}}",
"refId": "A"
}
],
"thresholds": [],
"timeFrom": null,
"timeRegions": [],
"timeShift": null,
"title": "网络使用率",
"tooltip": {
"shared": true,
"sort": 0,
"value_type": "individual"
},
"type": "graph",
"xaxis": {
"buckets": null,
"mode": "time",
"name": null,
"show": true,
"values": []
},
"yaxes": [
{
"format": "percent",
"label": null,
"logBase": 1,
"max": null,
"min": null,
"show": true
},
{
"format": "bytes",
"label": null,
"logBase": 1,
"max": null,
"min": null,
"show": true
}
],
"yaxis": {
"align": false,
"alignLevel": null
}
},
{
"aliasColors": {},
"bars": false,
"dashLength": 10,
"dashes": false,
"datasource": "Prometheus",
"fieldConfig": {
"defaults": {
"custom": {}
},
"overrides": []
},
"fill": 1,
"fillGradient": 0,
"gridPos": {
"h": 6,
"w": 6,
"x": 6,
"y": 42
},
"hiddenSeries": false,
"hideTimeOverride": false,
"id": 10,
"legend": {
"alignAsTable": false,
"avg": false,
"current": true,
"max": false,
"min": false,
"rightSide": false,
"show": true,
"total": false,
"values": true
},
"lines": true,
"linewidth": 1,
"links": [],
"nullPointMode": "null as zero",
"percentage": false,
"pluginVersion": "7.1.5",
"pointradius": 5,
"points": false,
"renderer": "flot",
"seriesOverrides": [],
"spaceLength": 10,
"stack": false,
"steppedLine": false,
"targets": [
{
"application": {
"filter": ""
},
"expr": "irate(windows_net_packets_outbound_discarded{job=~\"$job\",instance=~\"$instance\", nic!~'isatap.*|VPN.*'}[5m]) + irate(windows_net_packets_outbound_errors{job=~\"$job\",instance=~\"$instance\"}[5m])",
"format": "time_series",
"functions": [],
"group": {
"filter": ""
},
"hide": false,
"host": {
"filter": ""
},
"interval": "",
"intervalFactor": 1,
"item": {
"filter": ""
},
"legendFormat": "outbound",
"metric": "mysql_global_status_questions",
"mode": 0,
"options": {
"showDisabledItems": false
},
"refId": "B",
"step": 15
},
{
"application": {
"filter": ""
},
"expr": "irate(windows_net_packets_received_discarded{job=~\"$job\",instance=~\"$instance\", nic!~'isatap.*|VPN.*'}[5m]) + irate(windows_net_packets_received_errors{job=~\"$job\",instance=~\"$instance\"}[5m])",
"format": "time_series",
"functions": [],
"group": {
"filter": ""
},
"hide": false,
"host": {
"filter": ""
},
"interval": "",
"intervalFactor": 1,
"item": {
"filter": ""
},
"legendFormat": "received",
"metric": "mysql_global_status_questions",
"mode": 0,
"options": {
"showDisabledItems": false
},
"refId": "A",
"step": 15
}
],
"thresholds": [],
"timeFrom": null,
"timeRegions": [],
"timeShift": null,
"title": "Network discarded/error packets",
"tooltip": {
"shared": true,
"sort": 2,
"value_type": "individual"
},
"type": "graph",
"xaxis": {
"buckets": null,
"mode": "time",
"name": null,
"show": true,
"values": []
},
"yaxes": [
{
"format": "pps",
"label": null,
"logBase": 1,
"max": null,
"min": null,
"show": true
},
{
"format": "short",
"label": null,
"logBase": 1,
"max": null,
"min": null,
"show": true
}
],
"yaxis": {
"align": false,
"alignLevel": null
}
},
{
"aliasColors": {},
"bars": false,
"dashLength": 10,
"dashes": false,
"datasource": "Prometheus",
"fieldConfig": {
"defaults": {
"custom": {}
},
"overrides": []
},
"fill": 1,
"fillGradient": 0,
"gridPos": {
"h": 6,
"w": 6,
"x": 12,
"y": 42
},
"hiddenSeries": false,
"hideTimeOverride": false,
"id": 12,
"legend": {
"alignAsTable": false,
"avg": false,
"current": true,
"max": false,
"min": false,
"rightSide": false,
"show": true,
"total": false,
"values": true
},
"lines": true,
"linewidth": 1,
"links": [],
"nullPointMode": "null as zero",
"percentage": false,
"pluginVersion": "7.1.5",
"pointradius": 5,
"points": false,
"renderer": "flot",
"seriesOverrides": [],
"spaceLength": 10,
"stack": false,
"steppedLine": false,
"targets": [
{
"application": {
"filter": ""
},
"expr": "windows_system_threads{job=~\"$job\",instance=~\"$instance\"}",
"format": "time_series",
"functions": [],
"group": {
"filter": ""
},
"hide": false,
"host": {
"filter": ""
},
"interval": "",
"intervalFactor": 1,
"item": {
"filter": ""
},
"legendFormat": "system_threads",
"metric": "mysql_global_status_questions",
"mode": 0,
"options": {
"showDisabledItems": false
},
"refId": "A",
"step": 20
}
],
"thresholds": [],
"timeFrom": null,
"timeRegions": [],
"timeShift": null,
"title": "system_threads",
"tooltip": {
"shared": false,
"sort": 0,
"value_type": "individual"
},
"type": "graph",
"xaxis": {
"buckets": null,
"mode": "time",
"name": null,
"show": true,
"values": []
},
"yaxes": [
{
"format": "none",
"label": null,
"logBase": 1,
"max": null,
"min": null,
"show": true
},
{
"format": "short",
"label": null,
"logBase": 1,
"max": null,
"min": null,
"show": true
}
],
"yaxis": {
"align": false,
"alignLevel": null
}
},
{
"aliasColors": {},
"bars": false,
"dashLength": 10,
"dashes": false,
"datasource": "Prometheus",
"fieldConfig": {
"defaults": {
"custom": {}
},
"overrides": []
},
"fill": 1,
"fillGradient": 0,
"gridPos": {
"h": 6,
"w": 6,
"x": 18,
"y": 42
},
"hiddenSeries": false,
"hideTimeOverride": false,
"id": 13,
"legend": {
"alignAsTable": false,
"avg": false,
"current": true,
"max": true,
"min": false,
"rightSide": false,
"show": true,
"total": false,
"values": true
},
"lines": true,
"linewidth": 1,
"links": [],
"nullPointMode": "null as zero",
"percentage": false,
"pluginVersion": "7.1.5",
"pointradius": 5,
"points": false,
"renderer": "flot",
"seriesOverrides": [],
"spaceLength": 10,
"stack": false,
"steppedLine": false,
"targets": [
{
"application": {
"filter": ""
},
"expr": "irate(windows_system_exception_dispatches_total{job=~\"$job\",instance=~\"$instance\"}[5m])",
"format": "time_series",
"functions": [],
"group": {
"filter": ""
},
"hide": false,
"host": {
"filter": ""
},
"interval": "",
"intervalFactor": 1,
"item": {
"filter": ""
},
"legendFormat": "exceptions",
"metric": "mysql_global_status_questions",
"mode": 0,
"options": {
"showDisabledItems": false
},
"refId": "A",
"step": 20
}
],
"thresholds": [],
"timeFrom": null,
"timeRegions": [],
"timeShift": null,
"title": "System exception dispatches",
"tooltip": {
"shared": false,
"sort": 0,
"value_type": "individual"
},
"type": "graph",
"xaxis": {
"buckets": null,
"mode": "time",
"name": null,
"show": true,
"values": []
},
"yaxes": [
{
"format": "short",
"label": null,
"logBase": 1,
"max": null,
"min": null,
"show": true
},
{
"format": "short",
"label": null,
"logBase": 1,
"max": null,
"min": null,
"show": true
}
],
"yaxis": {
"align": false,
"alignLevel": null
}
}
],
"refresh": false,
"schemaVersion": 26,
"style": "dark",
"tags": [
"Prometheus",
"windows_exporter"
],
"templating": {
"list": [
{
"allValue": null,
"current": {
"selected": false,
"text": "Win-225",
"value": "Win-225"
},
"datasource": "Prometheus",
"definition": "label_values(windows_cs_hostname, job)",
"hide": 0,
"includeAll": false,
"label": "JOB",
"multi": false,
"name": "job",
"options": [],
"query": "label_values(windows_cs_hostname, job)",
"refresh": 1,
"regex": "",
"skipUrlSync": false,
"sort": 1,
"tagValuesQuery": "",
"tags": [],
"tagsQuery": "",
"type": "query",
"useTags": false
},
{
"allValue": null,
"current": {
"selected": false,
"text": "All",
"value": "$__all"
},
"datasource": "Prometheus",
"definition": "label_values(windows_cs_hostname{job=~\"$job\"}, hostname)",
"hide": 0,
"includeAll": true,
"label": "主机名",
"multi": false,
"name": "hostname",
"options": [],
"query": "label_values(windows_cs_hostname{job=~\"$job\"}, hostname)",
"refresh": 1,
"regex": "",
"skipUrlSync": false,
"sort": 5,
"tagValuesQuery": "",
"tags": [],
"tagsQuery": "",
"type": "query",
"useTags": false
},
{
"allValue": null,
"current": {
"selected": false,
"text": "10.0.50.225:9182",
"value": "10.0.50.225:9182"
},
"datasource": "Prometheus",
"definition": "label_values(windows_cs_hostname{job=~\"$job\",hostname=~\"$hostname\"}, instance)",
"hide": 0,
"includeAll": false,
"label": "instance",
"multi": false,
"name": "instance",
"options": [],
"query": "label_values(windows_cs_hostname{job=~\"$job\",hostname=~\"$hostname\"}, instance)",
"refresh": 1,
"regex": "",
"skipUrlSync": false,
"sort": 5,
"tagValuesQuery": "",
"tags": [],
"tagsQuery": "",
"type": "query",
"useTags": false
},
{
"allValue": null,
"current": {
"selected": false,
"text": "SKY-20190610LFO",
"value": "SKY-20190610LFO"
},
"datasource": "Prometheus",
"definition": "label_values(windows_cs_hostname{job=~\"$job\",instance=~\"$instance\"}, hostname)",
"hide": 2,
"includeAll": false,
"label": "展示使用的主机名",
"multi": false,
"name": "show_hostname",
"options": [],
"query": "label_values(windows_cs_hostname{job=~\"$job\",instance=~\"$instance\"}, hostname)",
"refresh": 1,
"regex": "",
"skipUrlSync": false,
"sort": 0,
"tagValuesQuery": "",
"tags": [],
"tagsQuery": "",
"type": "query",
"useTags": false
}
]
},
"time": {
"from": "now-3h",
"to": "now"
},
"timepicker": {
"refresh_intervals": [
"10s",
"30s",
"1m",
"5m",
"15m",
"30m",
"1h",
"2h",
"1d"
],
"time_options": [
"5m",
"15m",
"1h",
"6h",
"12h",
"24h",
"2d",
"7d",
"30d"
]
},
"timezone": "",
"title": "Windows Overriew",
"uid": "Kdh0OoSGz",
"version": 2
}6. 自动化启动脚本
@echo off
echo.
echo Windows指标采集[开始准备]
echo.

echo CPU\Mem\Disk\Net采集[开始]
echo 依赖于windows_exporter-0.13.0-amd64服务,完成安装后会自动创建一个开机自启的服务,通过服务(services.msc)判断有windows_exporter
echo CPU\Mem\Disk\Net采集[开始]-- 可以通过 http://localhost:9182/metrics 访问


echo GPU采集[开始]
start /d "D:\JT\java\prometheus\nvidia_smi_exporter" nvidia_smi_exporter.exe & ping localhost -n 2
::urlstatus=$(curl -X GET -i  http://localhost:9101/metrics  | grep 200)
::if [ "$urlstatus" != "" ];then
::	echo "GPU采集准备好了"
::fi
echo "GPU采集[完成]-- 可以通过 http://localhost:9101/metrics 访问"

echo Prometheus[开始]
start /d "D:\JT\java\prometheus\prometheus-2.19.2.windows-amd64" prometheus.exe --config.file=prometheus.yml --web.listen-address=:9090 & ping localhost -n 30
echo Prometheus[完成] -- 可以通过 http://localhost:9090 访问

echo Grafana[开始]
start /d "D:\JT\java\prometheus\grafana-7.1.5.windows-amd64\grafana-7.1.5\bin" grafana-server.exe & ping localhost -n 30
echo Grafana[完成] -- 可以通过 http://localhost:3000/d/Kdh0OoSGz/win-162?orgId=1 访问 【账号:admin 密码:123456】

::执行完命令后关闭cmd命令窗口
::设置开机时运行
::bat脚本复制到此文件夹C:\ProgramData\Microsoft\Windows\Start Menu\Programs\StartUp
echo Windows指标采集[准备完毕]
::taskkill /f /im cmd.exe
::exit
pause