原文参考链接:[https://blog.csdn.net/icefire_tyh/article/details/52064910]
习题
3.1

3.2
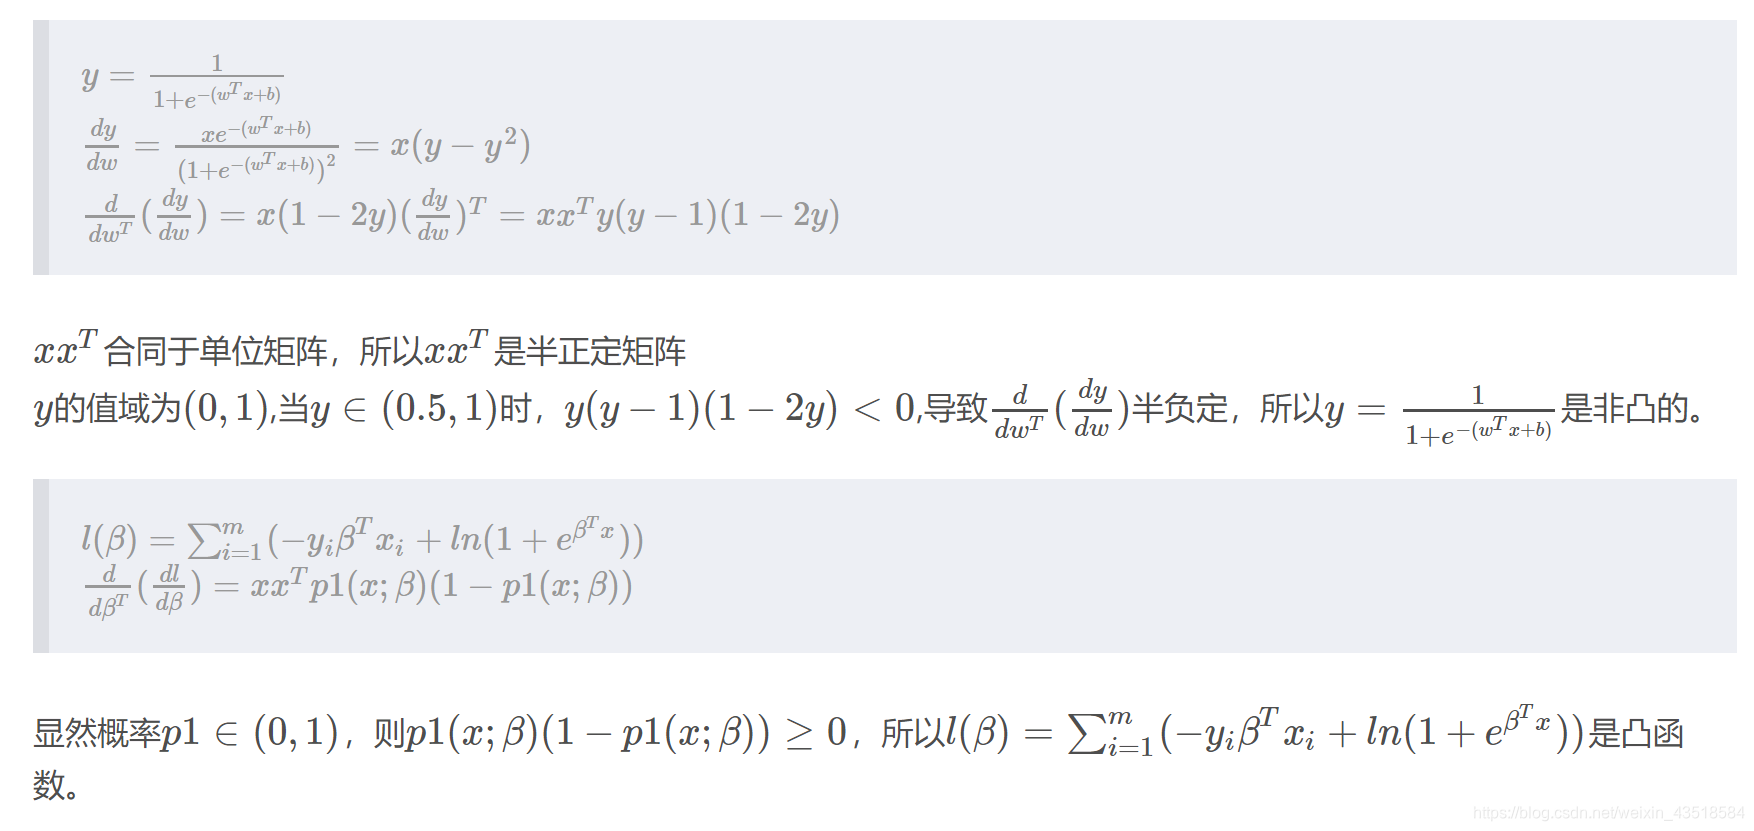
如果一个多元函数是凸的,那么它的Hessian矩阵是半正定的
3.3
#导入需要的包
import numpy as np
import matplotlib.pyplot as plt
from sklearn.model_selection import train_test_split
#导入数据
data = np.array([[0.697, 0.460, 1],
[0.774, 0.376, 1],
[0.634, 0.264, 1],
[0.608, 0.318, 1],
[0.556, 0.215, 1],
[0.403, 0.237, 1],
[0.481, 0.149, 1],
[0.437, 0.211, 1],
[0.666, 0.091, 0],
[0.243, 0.267, 0],
[0.245, 0.057, 0],
[0.343, 0.099, 0],
[0.639, 0.161, 0],
[0.657, 0.198, 0],
[0.360, 0.370, 0],
[0.593, 0.042, 0],
[0.719, 0.103, 0]])
定义变量
X = data[:,0:2]
y = data[:,2]
#随机划分训练集和测试集
X_train,X_test,Y_train,Y_test=train_test_split(X,y,test_size=0.25,random_state=33)
#定义sigmoid
def sigmoid(z):
s = 1 / (1 + np.exp(-z))
return s
def initialize_with_zeros(dim):
"""
This function creates a vector of zeros of shape (dim, 1) for w and initializes b to 0.
"""
w = np.zeros((dim, 1))
b = 0
assert (w.shape == (dim, 1))
assert (isinstance(b, float) or isinstance(b, int))
return w, b
def propagate(w, b, X, Y):
"""
Implement the cost function and its gradient for the propagation explained above
"""
m = X.shape[1]
A = sigmoid(np.dot(w.T, X) + b)
# 计算损失
cost = -np.sum(Y * np.log(A) + (1 - Y) * np.log(1 - A))/ m
dw = np.dot(X, (A - Y).T) / m
db = np.sum(A - Y) / m
assert (dw.shape == w.shape)
assert (db.dtype == float)
cost = np.squeeze(cost)
assert (cost.shape == ())
grads = {"dw": dw,
"db": db}
return grads, cost
def optimize(w, b, X, Y, num_iterations, learning_rate, print_cost=False):
"""
This function optimizes w and b by running a gradient descent algorithm
"""
costs = []
for i in range(num_iterations):
grads, cost = propagate(w, b, X, Y)
# Retrieve derivatives from grads
dw = grads["dw"]
db = grads["db"]
# update rule
w = w - learning_rate * dw
b = b - learning_rate * db
# Record the costs
if i % 100 == 0:
costs.append(cost)
# Print the cost every 100 training iterations
if print_cost and i % 100 == 0:
print("Cost after iteration %i: %f" % (i, cost))
params = {"w": w,
"b": b}
grads = {"dw": dw,
"db": db}
return params, grads, costs
def predict(w, b, X):
'''
Predict whether the label is 0 or 1 using learned logistic regression parameters (w, b)
'''
m = X.shape[1]
Y_prediction = np.zeros((1, m))
w = w.reshape(X.shape[0], 1)
# Compute vector "A" predicting the probabilities of a cat being present in the picture
A = sigmoid(np.dot(w.T, X) + b)
for i in range(A.shape[1]):
# Convert probabilities A[0,i] to actual predictions p[0,i]
if A[0, i] >= 0.5:
Y_prediction[0, i] = 1
else:
Y_prediction[0, i] = 0
pass
assert (Y_prediction.shape == (1, m))
return Y_prediction
def model(X_train, Y_train, X_test, Y_test, num_iterations, learning_rate, print_cost=False):
# initialize parameters with zeros (≈ 1 line of code)
w, b = initialize_with_zeros(X_train.shape[0])
# Gradient descent (≈ 1 line of code)
parameters, grads, costs = optimize(w, b, X_train, Y_train, num_iterations, learning_rate, print_cost)
# Retrieve parameters w and b from dictionary "parameters"
w = parameters["w"]
b = parameters["b"]
# Predict test/train set examples (≈ 2 lines of code)
Y_prediction_test = predict(w, b, X_test)
Y_prediction_train = predict(w, b, X_train)
# Print train/test Errors
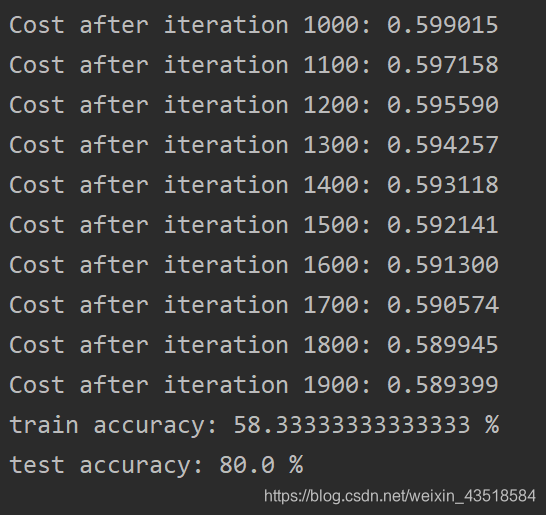
print("train accuracy: {} %".format(100 - np.mean(np.abs(Y_prediction_train - Y_train)) * 100))
print("test accuracy: {} %".format(100 - np.mean(np.abs(Y_prediction_test - Y_test)) * 100))
d = {"costs": costs,
"Y_prediction_test": Y_prediction_test,
"Y_prediction_train": Y_prediction_train,
"w": w,
"b": b,
"learning_rate": learning_rate,
"num_iterations": num_iterations}
return d
X_train = X_train.T
Y_train = Y_train.T.reshape(1,X_train.shape[1])
X_test = X_test.T
Y_test = Y_test.T.reshape(1,X_test.shape[1])
d = model(X_train, Y_train, X_test, Y_test, num_iterations = 2000, learning_rate = 0.5, print_cost = True)
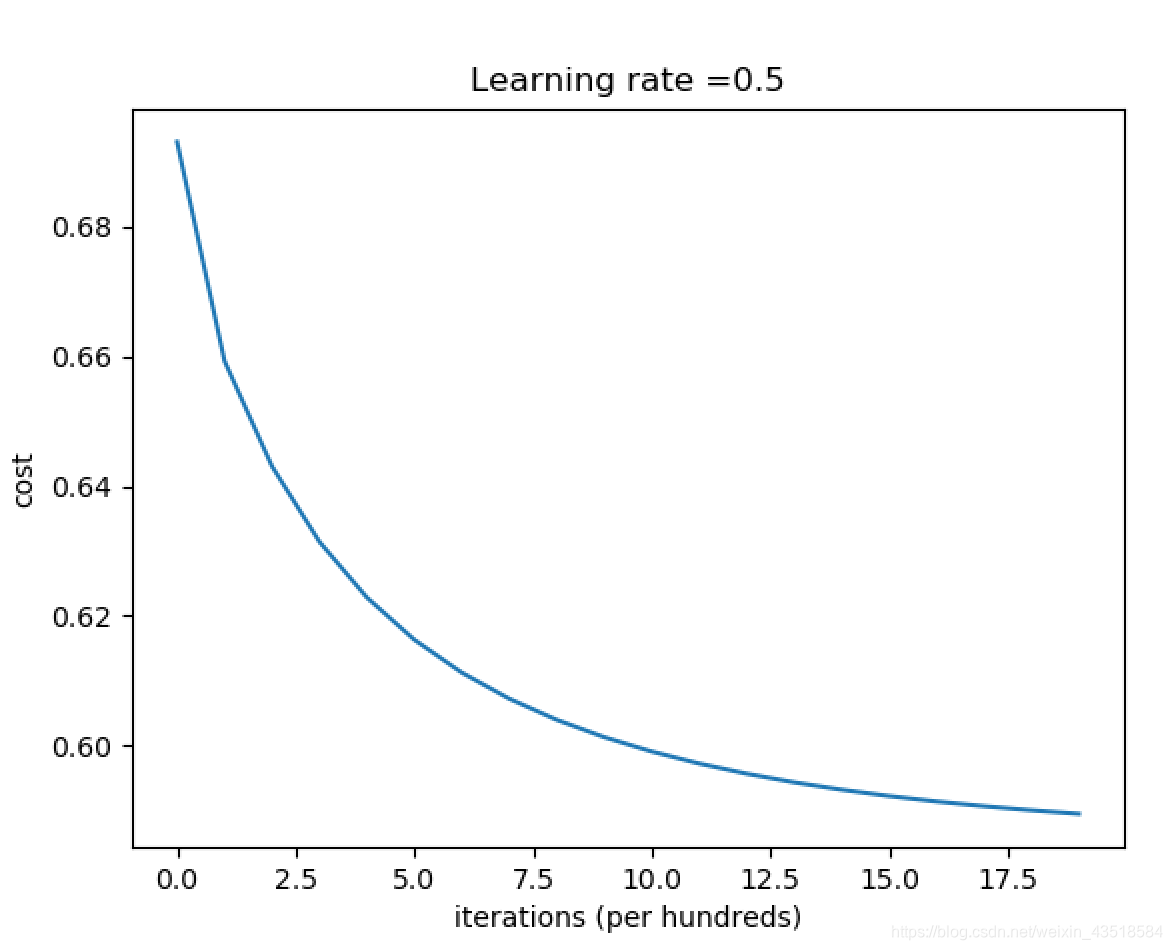
# Plot learning curve (with costs)
costs = np.squeeze(d['costs'])
plt.plot(costs)
plt.ylabel('cost')
plt.xlabel('iterations (per hundreds)')
plt.title("Learning rate =" + str(d["learning_rate"]))
plt.show()
显示结果
3.4
import numpy as np
import matplotlib.pyplot as plt
def readData():
"""
Read data from txt file.
Return:
X1, y1, X2, y2, X3, y3: X is list with shape [50, 4],
y is list with shape [50,]
"""
X1 = []
y1 = []
X2 = []
y2 = []
X3 = []
y3 = []
#read data from txt file
with open("bezdekIris.txt", "r") as f:
for line in f:
x = []
iris = line.strip().split(",")
for attr in iris[0:4]:
x.append(float(attr))
if iris[4]=="Iris-setosa":
X1.append(x)
y1.append(1)
elif iris[4]=="Iris-versicolor":
X2.append(x)
y2.append(2)
else:
X3.append(x)
y3.append(3)
return X1, y1, X2, y2, X3, y3
def tenFoldData(X1, X2):
"""
Generate 10-fold training data. Each fold includes 5 positive and 5 negtive.
Input:
X1: list with shape [50, 4]. Instances in X1 belong to positive class.
X2: list with shape [50, 4]. Instances in X2 belong to negtive class.
Return:
folds: list with shape [10, 10, 4].
y: list with shape [10, 10]
"""
print (len(X1))
print (len(X2))
folds = []
y = []
for i in range(10):
fold = []
fold += X1[ i*5:(i+1)*5 ]
fold += X2[ i*5:(i+1)*5 ]
folds.append(fold)
y.append([1]*5 + [0]*5)
return folds, y
def LR(X, y):
"""
Given training dataset, return optimal params of LR algorithm with Newton method.
Input:
X: np.array with shape [N, d]. Input.
y: np.array with shape [N, 1]. Label.
Return:
beta: np.array with shape [1, d]. Optimal params with Newton method
"""
N, d = X.shape
lr = 0.001
#initialization
beta = np.ones((1, d)) * 0.1
#shape [N, 1]
z = X.dot(beta.T)
for i in range(150):
#shape [N, 1]
p1 = np.exp(z) / (1 + np.exp(z))
#shape [N, N]
p = np.diag((p1 * (1-p1)).reshape(N))
#shape [1, d]
first_order = -np.sum(X * (y - p1), 0, keepdims=True)
#update
beta -= first_order * lr
z = X.dot(beta.T)
l = np.sum(y*z + np.log( 1+np.exp(z) ) )
#print l
return beta
def testing(beta, X, y):
"""
Given trained LR model, return error number in input X.
Input:
beta: np.array with shape [1, d]. params of LR model
X: np.array with shape [N, d]. Testing instances.
y: np.array with shape [N, 1]. Testing labels.
Return:
error_num: Error num of LR on X.
"""
predicts = ( X.dot(beta.T) >= 0 )
error_num = np.sum(predicts != y)
return error_num
def tenFoldCrossValidation(folds, y):
"""
Return erroe num of 10-fold cross validation.
Input:
folds: list with shape [10, 10, 4].
y: list with shape [10, 10]
Return:
ten_fold_error_nums:
"""
ten_fold_error_nums = 0
for i in range(10):
train_X = folds[:i] + folds[i+1:]
train_y = y[:i] + y[i+1:]
val_X = folds[i]
val_y = y[i]
train_X = np.array(train_X).reshape(-1, 4)
train_y = np.array(train_y).reshape([-1, 1])
val_X = np.array(val_X)
val_y = np.array(val_y).reshape([-1, 1])
beta = LR(train_X, train_y)
error_num = testing(beta, val_X, val_y)
ten_fold_error_nums += error_num
return ten_fold_error_nums
def LOO(X, y):
"""
Return erroe num of LOO.
Input:
X: list with shape [100, 4].
y: list with shape [100]
Return:
loo_error_nums:
"""
loo_error_nums = 0
for i in range(100):
train_X = X[:i] + X[i+1:]
train_y = y[:i] + y[i+1:]
val_X = X[i]
val_y = y[i]
train_X = np.array(train_X).reshape(-1, 4)
train_y = np.array(train_y).reshape([-1, 1])
val_X = np.array(val_X)
val_y = np.array(val_y).reshape([-1, 1])
beta = LR(train_X, train_y)
error_num = testing(beta, val_X, val_y)
loo_error_nums += error_num
return loo_error_nums
if __name__=="__main__":
#data read from txt file
X1, y1, X2, y2, X3, y3 = readData()
#10-fold cross validation
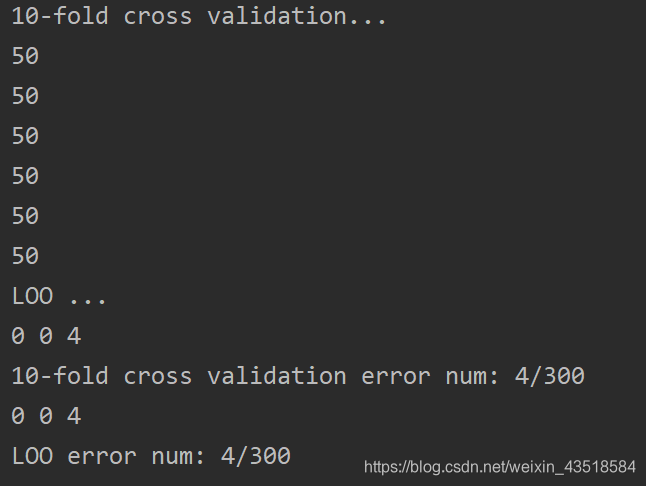
print ("10-fold cross validation...")
#X1 and X2
folds, y = tenFoldData(X1, X2)
round1_ten_fold_error_nums = tenFoldCrossValidation(folds, y)
#X1, X3
folds, y = tenFoldData(X1, X3)
round2_ten_fold_error_nums = tenFoldCrossValidation(folds, y)
#X2, X3
folds, y = tenFoldData(X3, X2)
round3_ten_fold_error_nums = tenFoldCrossValidation(folds, y)
ten_fold_error_nums = round1_ten_fold_error_nums + round2_ten_fold_error_nums \
+ round3_ten_fold_error_nums
#LOO
print ("LOO ...")
#X1, X2
X = X1 + X2
y = [1]*len(X1) + [0]*len(X2)
round1_loo_error_nums = LOO(X, y)
#X1, X3
X = X1 + X3
y = [1]*len(X1) + [0]*len(X2)
round2_loo_error_nums = LOO(X, y)
#X2, X3
X = X3 + X2
y = [1]*len(X1) + [0]*len(X2)
round3_loo_error_nums = LOO(X, y)
loo_error_nums = round1_loo_error_nums + round2_loo_error_nums \
+ round3_loo_error_nums
print (round1_ten_fold_error_nums, round2_ten_fold_error_nums, round3_ten_fold_error_nums)
print ("10-fold cross validation error num: {}/300".format(ten_fold_error_nums))
print (round1_loo_error_nums, round2_loo_error_nums, round3_loo_error_nums)
print ("LOO error num: {}/300".format(loo_error_nums))
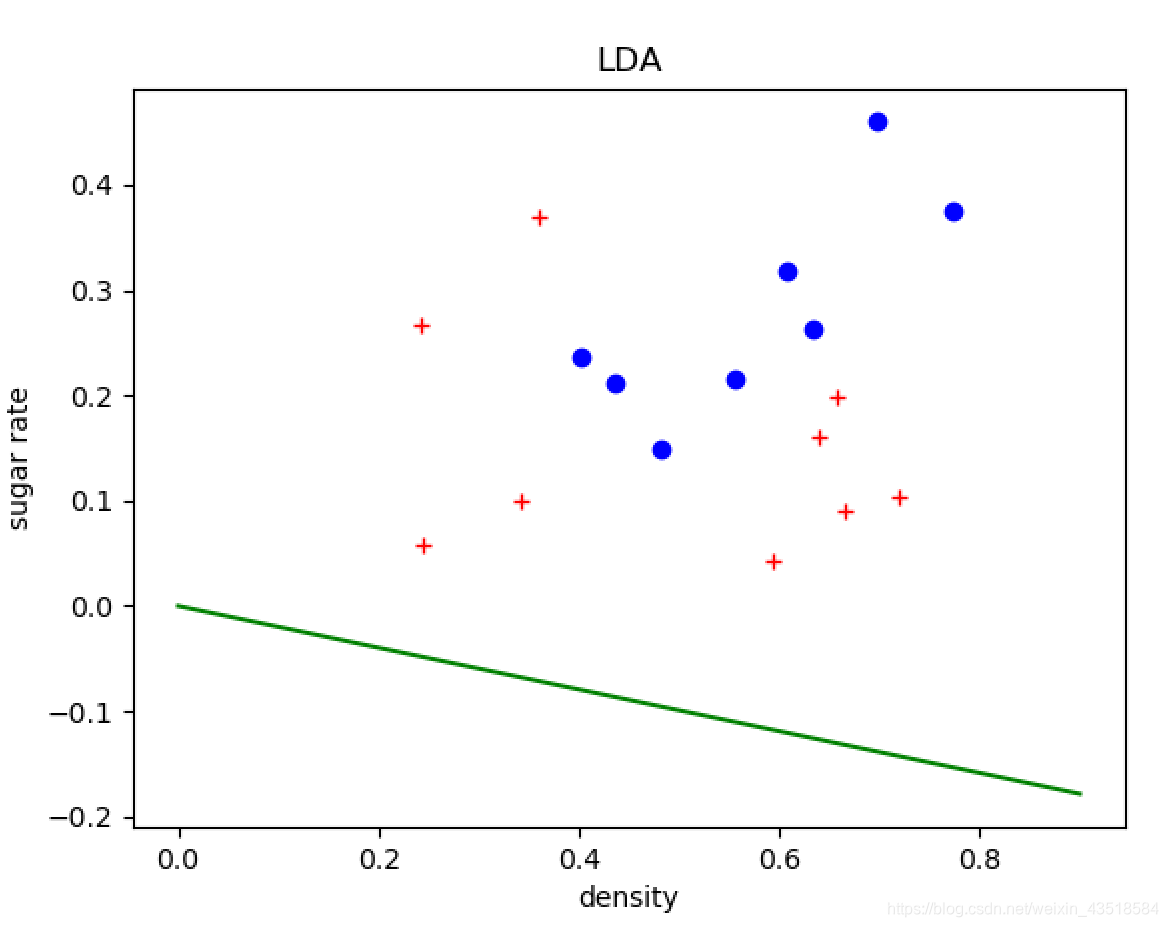
3.5
import pandas as pd
import numpy as np
import matplotlib.pyplot as plt

def LDA(X0, X1):
    """
    Get the optimal params of LDA model given training data.
    Input:
        X0: np.array with shape [N1, d]
        X1: np.array with shape [N2, d]
    Return:
        omega: np.array with shape [1, d]. Optimal params of LDA.
    """
    #shape [1, d]
    mean0 = np.mean(X0, axis=0, keepdims=True)
    mean1 = np.mean(X1, axis=0, keepdims=True)
    Sw = (X0-mean0).T.dot(X0-mean0) + (X1-mean1).T.dot(X1-mean1)
    omega = np.linalg.inv(Sw).dot((mean0-mean1).T)
    return omega

if __name__=="__main__":
    #read data from xls
    work_book = pd.read_csv("watermelon_3a.csv", header=None)
    positive_data = work_book.values[work_book.values[:, -1] == 1.0, :]
    negative_data = work_book.values[work_book.values[:, -1] == 0.0, :]
    print (positive_data)

    #LDA
    omega = LDA(negative_data[:, 1:-1], positive_data[:, 1:-1])

    #plot
    plt.plot(positive_data[:, 1], positive_data[:, 2], "bo")
    plt.plot(negative_data[:, 1], negative_data[:, 2], "r+")
    lda_left = 0
    lda_right = -(omega[0]*0.9) / omega[1]
    plt.plot([0, 0.9], [lda_left, lda_right], 'g-')

    plt.xlabel('density')
    plt.ylabel('sugar rate')
    plt.title("LDA")
    plt.show()
结果如下
[[1. 0.697 0.46 1. ]
[2. 0.774 0.376 1. ]
[3. 0.634 0.264 1. ]
[4. 0.608 0.318 1. ]
[5. 0.556 0.215 1. ]
[6. 0.403 0.237 1. ]
[7. 0.481 0.149 1. ]
[8. 0.437 0.211 1. ]]
3.6
参照6.4节,使用核函数, 就可以运用于非线性可分数据
3.7-3.10
略略略~
我也不会做,挖个坑在这,有时间再填