本文为系列文章之一,前面的几篇请点击链接:
NLP 利器 gensim 库基本特性介绍和安装方式
NLP 利器 Gensim 库的使用之 Word2Vec 模型案例演示
NLP 利器 Gensim 来训练自己的 word2vec 词向量模型
NLP 利器 Gensim 来训练 word2vec 词向量模型的参数设置
NLP 利器 Gensim 中 word2vec 模型的内存需求,和模型评估方式
NLP 利器 Gensim 中 word2vec 模型的恢复训练:载入存储模型并继续训练
NLP 利器 Gensim 中 word2vec 模型的训练损失计算,和对比基准的选择
NLP 利器 Gensim 中 word2vec 模型添加 model to dict 方法来加速搜索
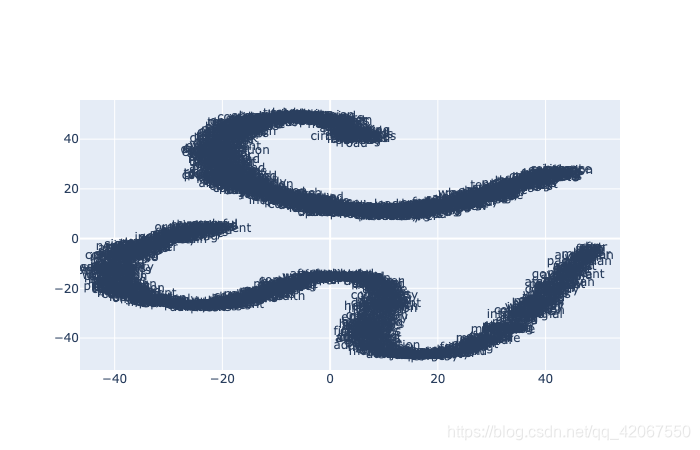
使用 tSNE 的方法,把 Word Embeddings 降维到 2 维,就可以进行可视化了。
通过可视化,我们可以看到数据中语义和句法的呈现趋势。
例如:
- 语义:cat, dog, cow 等单词会比较靠近。
- 句法:run 和 running,或者 cut 和 cutting 会比较靠近。
- 向量关系:vKing - vMan = vQueen - vWoman 也可以看到。
注意:由于演示用的模型是由一个小的语料库(lee_background 语料)训练而成,所有有些关系看上去不是这么明显!
这里需要首先安装 plotly
pip install plotly
程序:
%matplotlib inline
import matplotlib.pyplot as plt
from sklearn.decomposition import IncrementalPCA    # inital reduction
from sklearn.manifold import TSNE                   # final reduction
import numpy as np                                  # array handling


def reduce_dimensions(model):
    num_dimensions = 2  # final num dimensions (2D, 3D, etc)

    vectors = [] # positions in vector space
    labels = [] # keep track of words to label our data again later
    for word in model.wv.vocab:
        vectors.append(model.wv[word])
        labels.append(word)

    # convert both lists into numpy vectors for reduction
    vectors = np.asarray(vectors)
    labels = np.asarray(labels)

    # reduce using t-SNE
    vectors = np.asarray(vectors)
    tsne = TSNE(n_components=num_dimensions, random_state=0)
    vectors = tsne.fit_transform(vectors)

    x_vals = [v[0] for v in vectors]
    y_vals = [v[1] for v in vectors]
    return x_vals, y_vals, labels


x_vals, y_vals, labels = reduce_dimensions(model)

def plot_with_plotly(x_vals, y_vals, labels, plot_in_notebook=True):
    from plotly.offline import init_notebook_mode, iplot, plot
    import plotly.graph_objs as go

    trace = go.Scatter(x=x_vals, y=y_vals, mode='text', text=labels)
    data = [trace]

    if plot_in_notebook:
        init_notebook_mode(connected=True)
        iplot(data, filename='word-embedding-plot')
    else:
        plot(data, filename='word-embedding-plot.html')


def plot_with_matplotlib(x_vals, y_vals, labels):
    import matplotlib.pyplot as plt
    import random

    random.seed(0)

    plt.figure(figsize=(12, 12))
    plt.scatter(x_vals, y_vals)

    #
    # Label randomly subsampled 25 data points
    #
    indices = list(range(len(labels)))
    selected_indices = random.sample(indices, 25)
    for i in selected_indices:
        plt.annotate(labels[i], (x_vals[i], y_vals[i]))

try:
    get_ipython()
except Exception:
    plot_function = plot_with_matplotlib
else:
    plot_function = plot_with_plotly

plot_function(x_vals, y_vals, labels)
plt.show()
运行结果:
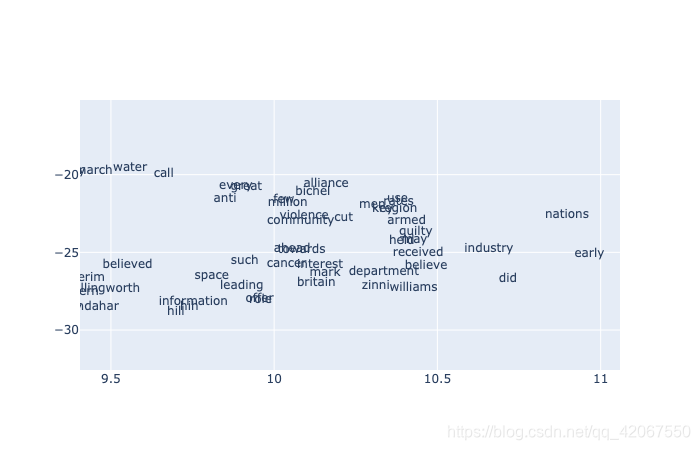
图片可以放大显示:
至此,Gensim 中 word2vec 模型的 Demo 演示完结!