这是基于vue框架的网络图案例,只实现了一部分功能,要想深入了解参考:Cytoscape.js
1、安装cytoscape.js
npm : npm install cytoscape
npm : npm install cytoscape-panzoom
2、在main.js里面配置:
import cytoscape from 'cytoscape'
import panzoom from 'cytoscape-panzoom'
panzoom(cytoscape)
一、创建一个展示网络图的窗口,html代码。
 1 // html页面
 2 <div :id='this.id' :style="idBackground"></div>
 3 // 网络图数据
 4 data() {
 5   return {
 6   id:'netWorkId',
 7   idBackground: {backgroundColor: "white", height: "650px"},
 8   filter:0.5, //  edge数据展示的控制
 9   clusterInfo:{},
10   networkData:{},
11   cy: {},
12    }
13 }
二、数据的获取
1、假数据的格式
1 let NetWorkData = {
2     data:{
3         "clusterInfo":['1','2'],
4         "nodes":[{ "id": "1", "name": "TCGA-CN-6022-01", "cluster": "2" }, { "id": "2", "name": "TCGA-CQ-5327-01", "cluster": "1" }],
5         "edges":[{ "id": "1_2", "source": "1", "target": "2", "edge_weight": "1" }, { "id": "1_2", "source": "1", "target": "2", "edge_weight": "1" },]
6     }
7 }
2、数据的获取和赋值
// 初始化这个方法
show(){
    this.networkData = {nodes: NetWorkData.data.nodes, edges: NetWorkData.data.edges};
    this.clusterInfo = NetWorkData.data.clusterInfo;
    this.drawNetwork();
}
三、网络图创建的必要方法
drawNetwork(){
    var elements = this.formatCoexpression(this.filter)
    this.cy = this.generateCyto(elements, this.id);
    // 图注的添加。样式的设置是设置classes,位置的设置是position
    this.cy.add([{
          group: "nodes",
          data: {id: 'legend1', name: 'Cluster1', width: 30},
          position: {x: 50, y: 50},
          classes: 'legend1',
          locked: true,
          grabbable: false,
        },{
          group: "nodes",
          data: {id: 'legend2', name: 'Cluster2', width: 30},
          position: {x: 50, y: 100},
          classes: 'legend2',
          locked: true,
          grabbable: false,
        }]);
        // A panzoom UI widget
    this.cy.panzoom({
         zoomFactor: 0.05, // zoom factor per zoom tick
         zoomDelay: 45, // how many ms between zoom ticks
         minZoom: 0.1, // min zoom level
         maxZoom: 10, // max zoom level
         fitPadding: 50, // padding when fitting
         panSpeed: 10, // how many ms in between pan ticks
         panDistance: 10, // max pan distance per tick
         panDragAreaSize: 75, // the length of the pan drag box in which the vector for panning is calculated (bigger = finer control of pan speed and direction)
         panMinPercentSpeed: 0.25, // the slowest speed we can pan by (as a percent of panSpeed)
         panInactiveArea: 8, // radius of inactive area in pan drag box
         panIndicatorMinOpacity: 0.5, // min opacity of pan indicator (the draggable nib); scales from this to 1.0
         zoomOnly: false, // a minimal version of the ui only with zooming (useful on systems with bad mousewheel resolution)
         fitSelector: undefined, // selector of elements to fit
         animateOnFit: function () { // whether to animate on fit
           return false;
         },
         fitAnimationDuration: 1000, // duration of animation on fit

         // icon class names
         //sliderHandleIcon: 'fa fa-minus',
         sliderHandleIcon: 'ivu-icon ivu-icon-ios-remove',
         zoomInIcon: 'ivu-icon ivu-icon-ios-add',
         //zoomOutIcon: 'fa fa-minus',
         zoomOutIcon: 'ivu-icon ivu-icon-ios-remove"',
         //resetIcon: 'fa fa-expand'
         resetIcon: 'ivu-icon ivu-icon-ios-resize'
       })
}
generateCyto()方法:
 1 generateCyto(elements, containerId) {
 2         return cytoscape({
 3           container: document.getElementById(containerId),
 4           style: cytoscape.stylesheet().selector('node').css({
 5             'content': 'data(name)'
 6           }).selector('node').css({
 7             'height': 'data(width)',
 8             'width': 'data(width)',
 9             'text-halign': "center",
10             'text-valign': "center",
11             'font-size':'12px',
12             'text-opacity':1,
13             'background-fit': 'cover'
14           }).selector('node.cluster1').css({
15             'background-color': '#ff9f03',
16             'cursor': 'pointer'
17           }).selector('node.cluster2').css({
18             'background-color': '#0075b0',
19           }).selector('node.legend1').css({
20             'background-color': '#ff9f03',
21           }).selector('node.legend2').css({
22             'background-color': '#0075b0',
23           }).selector('node.positiveNodeSelect').css({
24             'background-color': '#00FF00'
25           }).selector('node.negativeNodeSelect').css({
26             'background-color': '#FF0000'
27           }).selector('edge').css({
28             'target-arrow-shape': 'none',
29             'curve-style': 'bezier',
30             'control-point-step-size': 20,
31             'line-color': '#B2B2B2',
32             'width': 'data(weight)'
33           }),
34           elements: elements,
35           layout: {
36             name: cose, // 算法的不同展示方法
37             padding: 20,
38             boundingBox: {x1: 0, y1: 0, w: 550, h: 650},
39             fit: true,
40           },
41           // zoomingEnabled:false,
42           zoom: 1,
43           minZoom: 0.5,
44           maxZoom: 2,
45           ready: function () {
46           }
47         })
48       },
要是需要处理数据,执行例一,不需要处理数据直接把数值赋值element就可以了。
下面是处理数据的方法。 formatCoexpression()方法:
 1 //例一
 2 formatCoexpression() {
 3         let elements = [];
 4         var tempObj = {}
 5         // 对node的处理,包括复合节点的动态添加,就是下面父节点和子节点的代码片段
 6         if (this.networkData.nodes[0].node_number) {//自己加的判断,没有用可以删除
 7           this.networkData.nodes.forEach(item => {
 8             tempObj = {
 9               id: item["id"],
10               name: item["name"],
11               cluster: item["cluster"],
12               node_number: item["node_number"],
13               width: item["node_number"] / 5,
14             }
15             elements.push({
16               data: tempObj,
17               classes: "cluster" + item["cluster"]
18             })
19           })
20         } else {
21           //父节点
22           this.clusterInfo.forEach(clusterItem=>{
23             tempObj = {
24               id: `cluster${clusterItem}`,
25               name: clusterNameMap[clusterItem],
26               width: 30,
27               height: 50
28             }
29             elements.push({
30               data: tempObj,
31               classes: "clusterParent" + clusterItem
32             })
33           });
34           //子节点
35           this.networkData.nodes.forEach(item => {
36             tempObj = {
37               id: item["id"],
38               name: item["name"],
39               //cluster: item["cluster"],
40               parent: `cluster${item["cluster"]}`,
41               width: 30
42             };
43             elements.push({
44               data: tempObj,
45               classes: "cluster" + item["cluster"]
46             })
47           })
48         }
49         // 对edge的处理,根据filter控制线显示的数据多少。
50         this.networkData.edges.forEach(item => {
51           let tempObj = {
52             id: item["source"] + "_" + item["target"],
53             source: item["source"],
54             target: item["target"],
55             weight: item["edge_weight"] * 2,
56             edgeWeight: item['edge_weight'],
57           }
58           if (item["edge_weight"] > this.filter) {
59             elements.push({
60               data: tempObj,
61               //classes:"cluster"+item["cluster"]
62             })
63           }
64         })
65         return elements
66       },
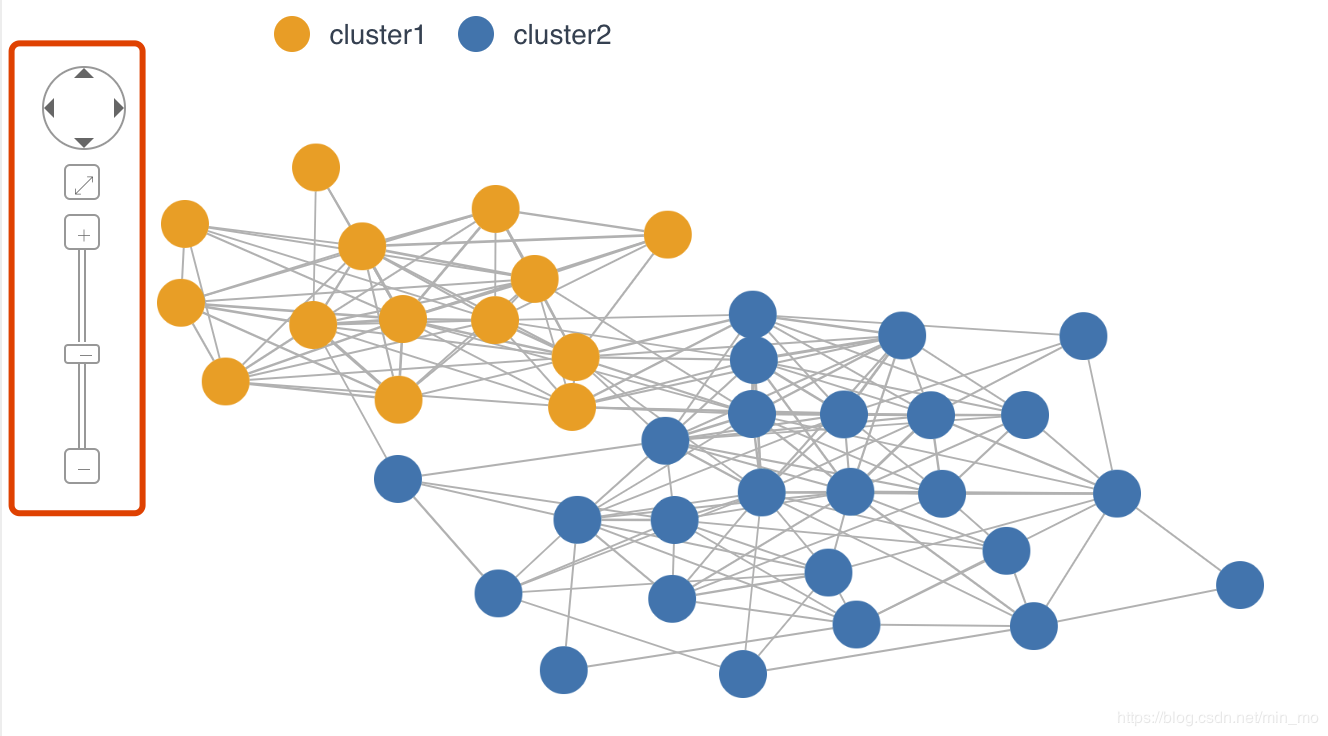
结果展示:
红色框内展示的是panzoom的实例
以上是完整的网络图实例,下面介绍下关于网络图自己用过的其他方法。
//获取视口的范围,这是模型坐标中的一个边界框,它允许您知道在视口中可见的模型位置。
1、this.cy.extent();
// node的点击事件
2、this.cy.nodes().on(‘click’, e => {});
//重构网络图页面的方法,得到一个新的布局,它可以用来在图中对节点进行算法定位
3、this.cy.layout({
name: cose, //数据的排列算法
boundingBox: {x1: 0, y1: 0, w: 550, h: 650}, //限制视图的展示范围。
}).run();
//对edge数据的处理
4、this.cy.edges();
//对点的样式的处理方法
5、this.cy.nodes(’.’ + this.classes).style({
‘background-color’: red;
});
//获取node样式
this.cy.nodes(’.’ + this.classes).style();
// 线的样式的处理
6、this.cy.edges().style({
// 样式
})
//获取edge样式
this.cy.edges().style();
CSDN链接地址:https://blog.csdn.net/min_mo/article/details/84026197