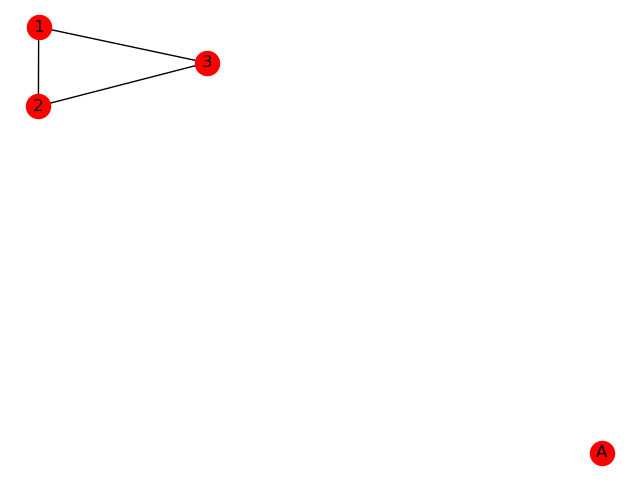
简单演示
import networkx as nx
import matplotlib.pyplot as plt

# 定义空图
g = nx.Graph()

# 增加节点
g.add_node(1)
g.add_node('A')

g.add_nodes_from([2, 3])
g.add_edge(2, 3)
g.add_edges_from([(1, 2), (1, 3)])

nx.draw(g, with_labels=True)
plt.show()
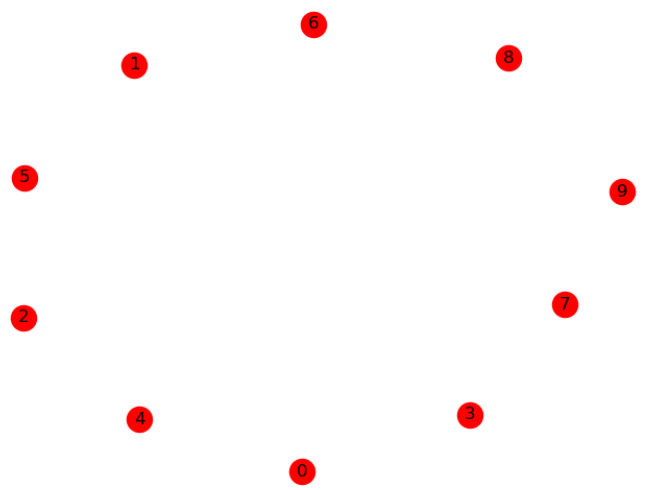
一次增加多个点
import networkx as nx
import matplotlib.pyplot as plt

# 定义空图
g = nx.Graph()

h = nx.path_graph(10)
g.add_nodes_from(h)

nx.draw(g, with_labels=True)
plt.show()
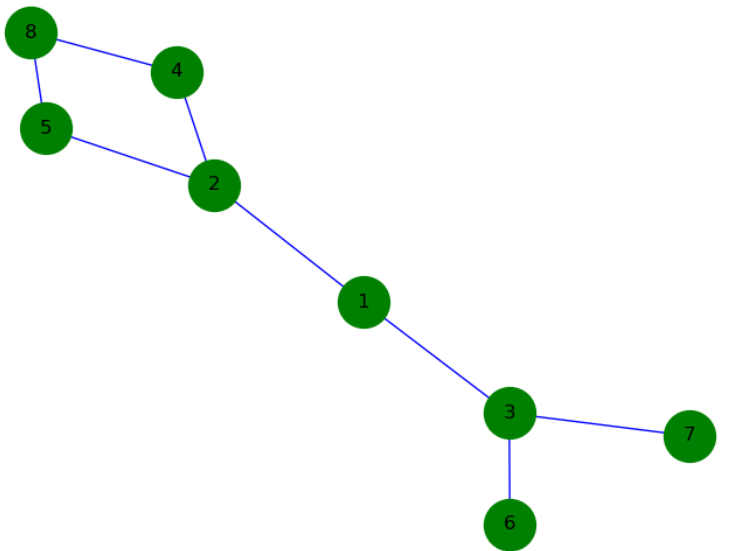
有颜色的图
import networkx as nx
import matplotlib.pyplot as plt

# 定义空图
g = nx.Graph()

# 导入所有边,每条边分别用tuple表示
g.add_edges_from([(1, 2), (1, 3), (2, 4), (2, 5), (3, 6), (4, 8), (5, 8), (3, 7)])
nx.draw(g,
        with_labels=True,
        edge_color='b',
        node_color='g',
        node_size=1000)
# 如果你想保存图片,去除这句的注释
# plt.savefig('./generated_image.png')
plt.show()
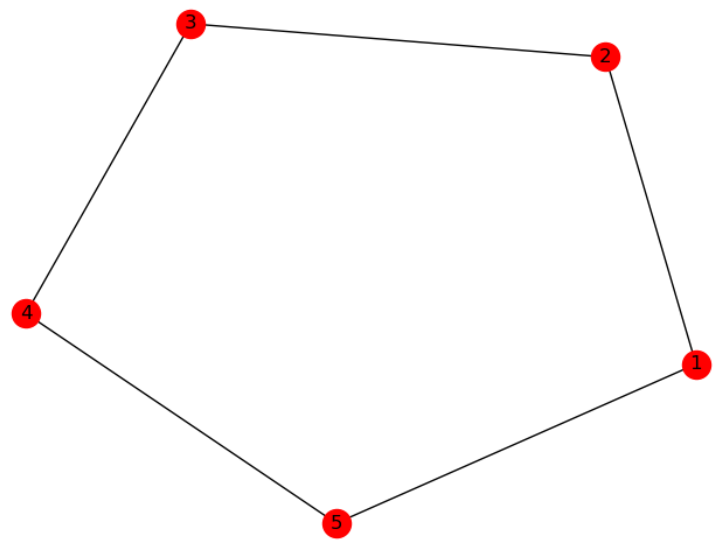
环
import networkx as nx
import matplotlib.pyplot as plt

# 定义空图
g = nx.Graph()
g.add_cycle([1, 2, 3, 4, 5])
nx.draw(g, with_labels=True)

plt.show()
五角星
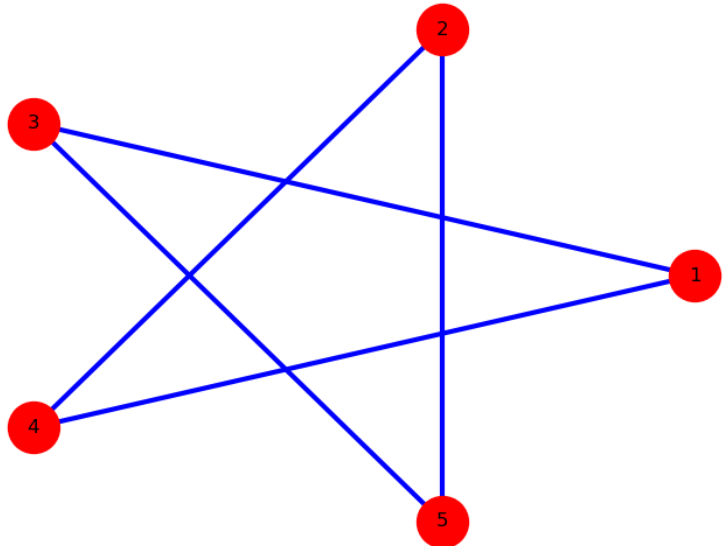
import networkx as nx
import matplotlib.pyplot as plt

G = nx.Graph()

G.add_nodes_from([1, 2, 3, 4, 5])
for i in range(5):
    for j in range(i):
        if (abs(i - j) not in (1, 4)):
            G.add_edge(i + 1, j + 1)
nx.draw(G,
        with_labels=True,  # 这个选项让节点有名称
        edge_color='b',  # b stands for blue!
        pos=nx.circular_layout(G),  # 这个是选项选择点的排列方式,具体可以用 help(nx.drawing.layout) 查看
        # 主要有spring_layout  (default), random_layout, circle_layout, shell_layout
        # 这里是环形排布,还有随机排列等其他方式
        node_color='r',  # r = red
        node_size=1000,  # 节点大小
        width=3,  # 边的宽度
        )
plt.show()
随机绘图

import random
import networkx as nx
import matplotlib.pyplot as plt

G = nx.gnp_random_graph(10, 0.3)
for u, v, d in G.edges(data=True):
    d['weight'] = random.random()

edges, weights = zip(*nx.get_edge_attributes(G, 'weight').items())

pos = nx.spring_layout(G)
nx.draw(G, pos, node_color='b', edgelist=edges, edge_color=weights, width=10.0, edge_cmap=plt.cm.Blues)
# plt.savefig('edges.png')
plt.show()
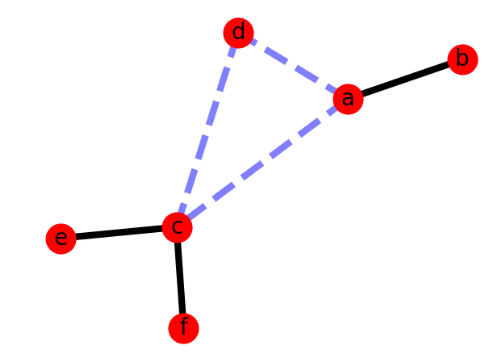
有权重的图
import matplotlib.pyplot as plt
import networkx as nx

G = nx.Graph()

G.add_edge('a', 'b', weight=0.6)
G.add_edge('a', 'c', weight=0.2)
G.add_edge('c', 'd', weight=0.1)
G.add_edge('c', 'e', weight=0.7)
G.add_edge('c', 'f', weight=0.9)
G.add_edge('a', 'd', weight=0.3)

elarge = [(u, v) for (u, v, d) in G.edges(data=True) if d['weight'] > 0.5]
esmall = [(u, v) for (u, v, d) in G.edges(data=True) if d['weight'] <= 0.5]

pos = nx.spring_layout(G)  # positions for all nodes

# nodes
nx.draw_networkx_nodes(G, pos, node_size=700)

# edges
nx.draw_networkx_edges(G, pos, edgelist=elarge,
                       width=6)
nx.draw_networkx_edges(G, pos, edgelist=esmall,
                       width=6, alpha=0.5, edge_color='b', style='dashed')

# labels
nx.draw_networkx_labels(G, pos, font_size=20, font_family='sans-serif')

plt.axis('off')
plt.show()
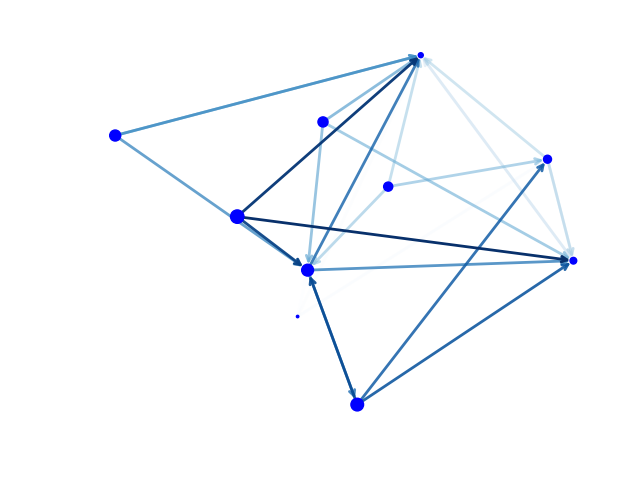
有向图
import matplotlib.pyplot as plt
import networkx as nx

G = nx.generators.directed.random_k_out_graph(10, 3, 0.5)
pos = nx.layout.spring_layout(G)

node_sizes = [3 + 10 * i for i in range(len(G))]
M = G.number_of_edges()
edge_colors = range(2, M + 2)
edge_alphas = [(5 + i) / (M + 4) for i in range(M)]

nodes = nx.draw_networkx_nodes(G, pos, node_size=node_sizes, node_color='blue')
edges = nx.draw_networkx_edges(G, pos, node_size=node_sizes, arrowstyle='->',
                               arrowsize=10, edge_color=edge_colors,
                               edge_cmap=plt.cm.Blues, width=2)
# set alpha value for each edge
for i in range(M):
    edges[i].set_alpha(edge_alphas[i])

ax = plt.gca()
ax.set_axis_off()
plt.show()
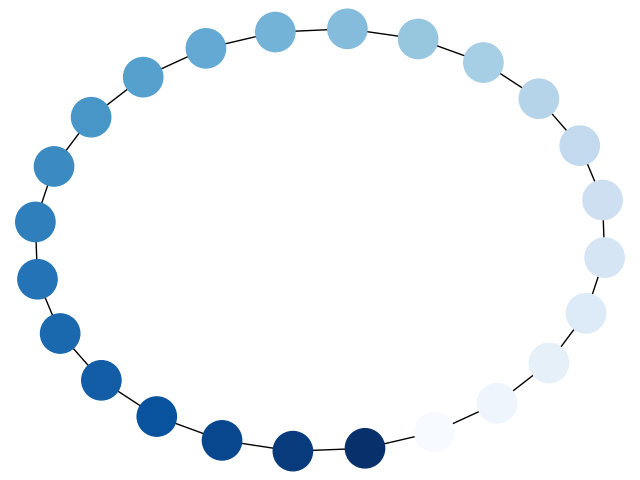
颜色渐变的节点
import matplotlib.pyplot as plt
import networkx as nx

G = nx.cycle_graph(24)
pos = nx.spring_layout(G, iterations=200)
nx.draw(G, pos, node_color=range(24), node_size=800, cmap=plt.cm.Blues)
plt.show()
颜色渐变的边

import matplotlib.pyplot as plt
import networkx as nx

G = nx.star_graph(20)
pos = nx.spring_layout(G)
colors = range(20)
nx.draw(G, pos, node_color='#A0CBE2', edge_color=colors,
        width=4, edge_cmap=plt.cm.Blues, with_labels=False)
plt.show()
多层感知器
import matplotlib.pyplot as plt
import networkx as nx

left, right, bottom, top, layer_sizes = .1, .9, .1, .9, [4, 7, 7, 2]
# 网络离上下左右的距离
# layter_sizes可以自己调整
import random

G = nx.Graph()
v_spacing = (top - bottom) / float(max(layer_sizes))
h_spacing = (right - left) / float(len(layer_sizes) - 1)
node_count = 0
for i, v in enumerate(layer_sizes):
    layer_top = v_spacing * (v - 1) / 2. + (top + bottom) / 2.
    for j in range(v):
        G.add_node(node_count, pos=(left + i * h_spacing, layer_top - j * v_spacing))
        node_count += 1
# 这上面的数字调整我想了好半天,汗
for x, (left_nodes, right_nodes) in enumerate(zip(layer_sizes[:-1], layer_sizes[1:])):
    for i in range(left_nodes):
        for j in range(right_nodes):
            G.add_edge(i + sum(layer_sizes[:x]), j + sum(layer_sizes[:x + 1]))
# 慢慢研究吧
pos = nx.get_node_attributes(G, 'pos')
# 把每个节点中的位置pos信息导出来
nx.draw(G, pos,
        node_color=range(node_count),
        with_labels=True,
        node_size=200,
        edge_color=[random.random() for i in range(len(G.edges))],
        width=3,
        cmap=plt.cm.Dark2,  # matplotlib的调色板,可以搜搜,很多颜色呢
        edge_cmap=plt.cm.Blues
        )
plt.show()