SpringDataJpa+vue+Echarts绘制柱状图和饼状图
注明:dome源码和sql文末自取。该dome使用了IDEA和vs-code编码工具。idea使用了lombok插件。
一、后端实现
1、创建SpringBoot项目,勾选 web、jpa、lombok、mysql、jdbc 启动器,并创建对应的层
2、创建Charts.java实体类
@Data
@Entity
@Table(name = "charts")
public class Charts {
    @Id
    @GeneratedValue(strategy = GenerationType.IDENTITY)
    @Column(name = "id",unique = true,nullable = false,length = 50)
    @JsonIgnore
    private Integer id;
    @Column(name = "name",nullable = false,length = 50)
    private String name;
    @Column(name = "num",nullable = false,length = 50)
    private String num;
}
3、编写dao层,ChartsDao .java接口类,继承JpaRepository接口(不了解可点击查看说明)
public interface ChartsDao extends JpaRepository<Charts,Integer> {
}
4、编写service层,ChartsService.java
@Service
@Transactional
public class ChartsService {

    @Autowired
    private ChartsDao chartsDao;

    public List<Charts> findAll(){
        return chartsDao.findAll();
    }
}
6、编写controller层,ChartsController.java,调用servicefindAll方法,查询所有信息
@RestController
public class ChartsController {

    @Autowired
    private ChartsService chartsService;

    @GetMapping("findAll")
    public List<Charts> findAll(){
        return chartsService.findAll();
    }
}
7、由于是前后端分离,需要跨域,我这里配置了一个配置类,实现跨域请求
@Configuration
public class GlobalCorsConfig {
    @Bean
    public CorsFilter corsFilter() {
        final UrlBasedCorsConfigurationSource source = new UrlBasedCorsConfigurationSource();
        //1.添加CORS配置信息
        final CorsConfiguration config = new CorsConfiguration();
        //1) 允许的域,不要写*,否则cookie就无法使用了
        config.setAllowCredentials(true);
        config.addAllowedHeader("*");
        config.addAllowedOrigin("*");
        config.addAllowedMethod("*");
        //2) 是否发送Cookie信息
        config.setAllowCredentials(true);
        //3) 允许的请求方式
        config.addAllowedMethod("OPTIONS");
        config.addAllowedMethod("HEAD");
        config.addAllowedMethod("GET");
        config.addAllowedMethod("PUT");
        config.addAllowedMethod("POST");
        config.addAllowedMethod("DELETE");
        config.addAllowedMethod("PATCH");
        // 4)允许的头信息
        config.addAllowedHeader("*");
        //5,有效时长
        config.setMaxAge(3600L);
        //2.添加映射路径,我们拦截一切请求
        final UrlBasedCorsConfigurationSource configSource = new UrlBasedCorsConfigurationSource();
        configSource.registerCorsConfiguration("/**", config);
        //3.返回新的CorsFilter.
        return new CorsFilter(configSource);
    }
}
8、请求返回的部分json数据格式
[
{
“name”: “java”,
“num”: “200”
},
{
“name”: “c”,
“num”: “150”
},
{
“name”: “c++”,
“num”: “100”
},
{
“name”: “pathon”,
“num”: “100”
}
]
二、编写vue+Echarts实现柱状图和饼状图
1、创建vue项目: vue init webpack 项目名称,
导入 axios 插件:npm install --save axios vue-axios
导入v-charts:npm install echarts v-charts --save-dev(v-charts是Echarts的封装,详情可点击查看)
2、在src的main.js下导入插件
import axios from 'axios'
import VueAxios from 'vue-axios'
import VCharts from 'v-charts'
Vue.use(VCharts)
//注册 VueAxios, axios
Vue.use(VueAxios, axios)
3、在config下的index.js下进行跨域配置
proxyTable: {
      // 表示以后以/userapi 开头的请求,代理请求 http://localhost:8080
      '/userapi': {
        target: 'http://localhost:8888', //后端接口地址
        changeOrigin: true, //是否允许跨越
        pathRewrite: {
          '^/userapi': '', //重写,
        }
      }
    },
4、创建vue文件,编写柱状图
4_1、编写柱状图template
<template>
  <ve-histogram :data="chartData" :title="chartTitle" :settings="chartSettings" :extend="extend"></ve-histogram>
</template>
4_2、在data中配置各种显示数据和样式,代码中有详细注释
  data () {
    //设置纵坐标文字和显示类型
    this.chartSettings = {
      yAxisType: ['KMB'],
      yAxisName: ['人数/万'],
    },
    //选择全局文字,颜色,样式等配置
      this.extend = {
        barWidth: 25,//设置宽度为15px
        // x轴的文字倾斜
        'xAxis.0.axisLabel.rotate': 45,
        'xAxis.0.axisLabel.fontSize': 20,//x轴文本字体大小
        'xAxis.0.axisLabel.fontWeight': 'bold',//x轴文本字体粗细
        //设置随机颜色
        series: {
          label: { show: true, position: "top" },
          color: function (value) { return "#" + ("00000" + ((Math.random() * 16777215 + 0.5) >> 0).toString(16)).slice(-6); }
        }
      },
      //设置标题
      this.chartTitle = {
        // 文字啥的,用\n可以换行
        text: '2019各大编程语言人数排行',
        x: '25px',
        textStyle: {
          fontSize: 20,
          fontWeight: 'normal',
        }
      }
      //设置数据
    return {
      chartData: {
        columns: ['name', 'num'],
        rows: []
      }
    }
  },
4_3、编写ajax请求,请求后端数据,绑定到柱状图
//加载方法
  created: function () {
    var app = this;
    console.log("init");
    this.init()
  },
  methods: {
    //查询数据
    init: function () {
      var app = this;
      axios
        .get("/userapi/findAll")
        .then(function (response) {
          app.chartData.rows = response.data;
        })
        .catch(function (error) {
          console.log(error);
        });
    },
  }
4_4、显示效果
在这里插入代码片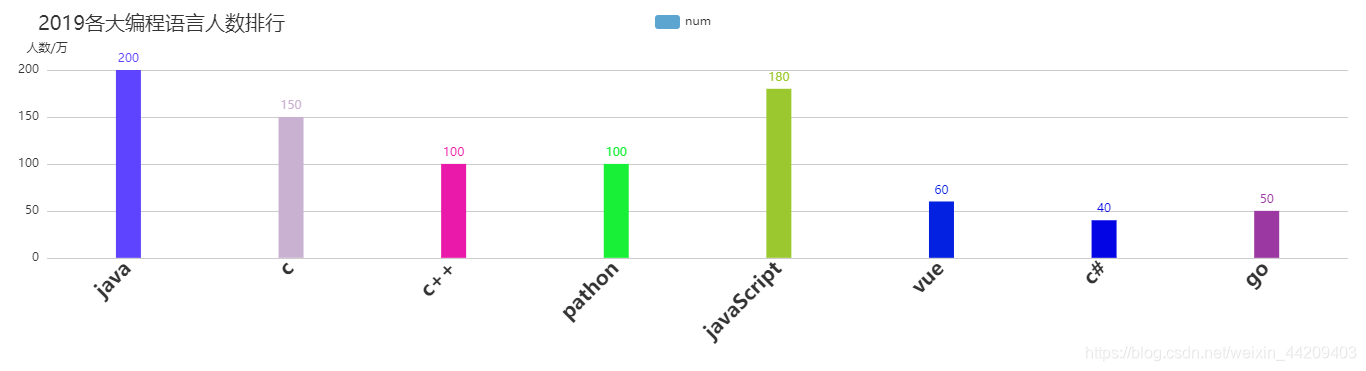
5、编写饼状图
5_1、编写饼状图
<template>
  <ve-pie :data="chartData" :title="chartTitle" :events="chartEvents" :settings="chartSettings"></ve-pie>
</template>
5_2、在data中设置饼状图样式,和设置数据绑定集合
data () {
    //设置饼状图显示样式
      this.chartSettings = {
        radius: 150,//半径
        offsetY: 250,//向下平移多少

        //调节显示
        label: {
          normal: {
            fontSize: 16,//字体大小
            formatter: '{b}' + '\n\r' + '{c}' + '\n\r' + '({d}%)'//显示那几种数据
          }
        }

      },
      this.chartTitle = {
        // 文字啥的,用\n可以换行
        text: '2019各大编程语言人数占比排行',
        x: '25px',//向右移动多少
        textStyle: {
          fontSize: 20,
          fontWeight: 'normal',
        }
      }
    return {
      //饼状图数据绑定
      chartData: {
        columns: ['name', 'num'],
        rows: []
      }
    }
  },
5_3、编写加载事件,和查询所有数据事件,通过ajax绑定饼状图数据
  //加载查询数据
  created: function () {
    var app = this;
    console.log("init");
    this.init()
  },
  methods: {
  //查询所有信息
    init: function () {
      var app = this;
      axios
        .get("/userapi/findAll")
        .then(function (response) {
          //向饼状图绑定数据
          app.chartData.rows = response.data;
        })
        .catch(function (error) {
          console.log(error);
        });
    },
  }
5_4、显示效果
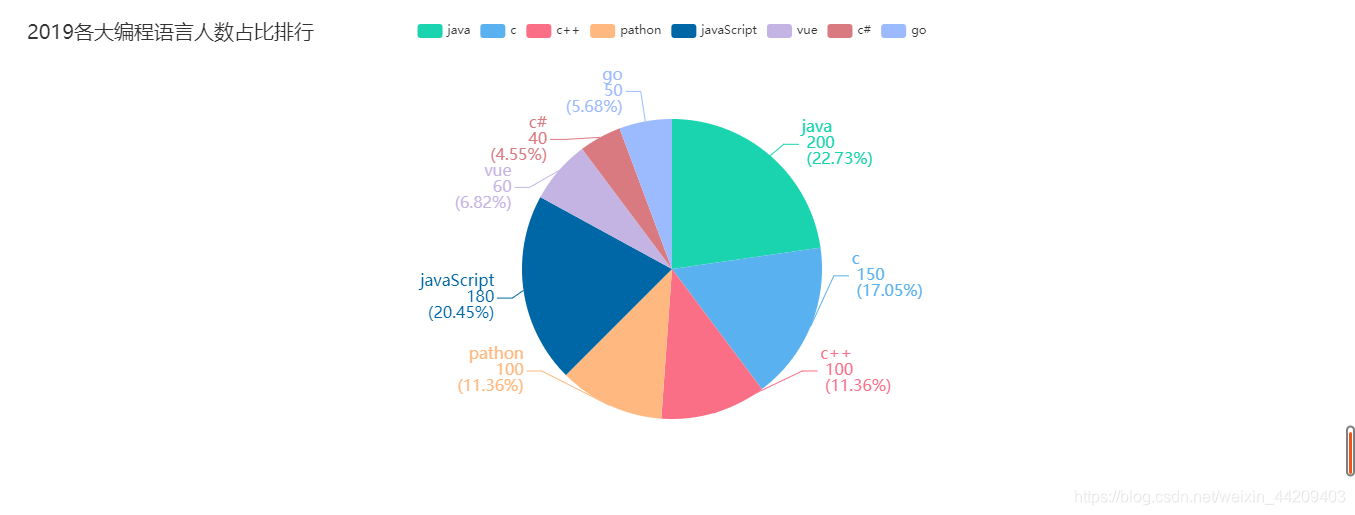
6、总结:绘制柱状图和饼状图,主要是对它自己封装的各种属性的配置和数据的绑定。总体来说操作性不难,但是太考验前端的各种属性配置,编写的时候一定要细心。后端比较简单,基本没有难点。
项目源码地址:
链接:https://pan.baidu.com/s/1Sud_cJKc7qo3TIrd7DB97w
提取码:873p
