分享一下我老师大神的人工智能教程!零基础,通俗易懂!http://blog.csdn.net/jiangjunshow
也欢迎大家转载本篇文章。分享知识,造福人民,实现我们中华民族伟大复兴!
Java创建图表其实还是很方便的,但是要引入相关的jar包。如下
- jfreechart.jar
- jcommon,jar
- gnujaxp.jar
其中最主要的是jfreechart.jar。
下面就让我们先看看创建的图标的运行结果吧。
是不是感觉很生动形象,一目了然呢?
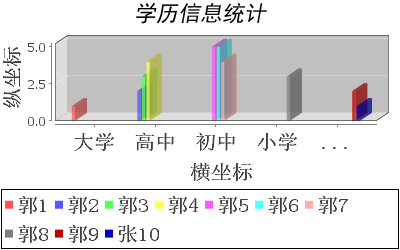
下面让我们一一拉进行分析吧首先是柱状图
我已经在代码中做好了注释,可以直接拿过来使用。
package mytest;import java.awt.FlowLayout;import java.awt.Font;import java.io.File;import java.io.IOException;import javax.swing.JFrame;import org.jfree.chart.ChartFactory;import org.jfree.chart.ChartPanel;import org.jfree.chart.ChartUtilities;import org.jfree.chart.JFreeChart;import org.jfree.chart.axis.CategoryAxis;import org.jfree.chart.axis.ValueAxis;import org.jfree.chart.plot.CategoryPlot;import org.jfree.chart.plot.PlotOrientation;import org.jfree.data.category.CategoryDataset;import org.jfree.data.category.DefaultCategoryDataset;import org.jfree.data.general.Dataset;public class BarChartDemo { private ChartPanel panel; /** * 在柱状图中创建表格的步骤如下: 1、创建表格chart,需要注意相关参数的含义, 2、传进去的数据集是CategoryDataset格式 * 3、获得表格区域块,设置横轴,纵轴及相关字体(防止出现乱卡的状况) * 4、设置chart的图例legend,并设置条目的字体格式(同样是为了防止出现乱码) */ public BarChartDemo() { CategoryDataset dataset = (CategoryDataset) getDataset(); JFreeChart chart = ChartFactory.createBarChart3D("学历信息统计", "横坐标", "纵坐标", dataset, PlotOrientation.VERTICAL, true, false, false); CategoryPlot plot = (CategoryPlot) chart.getCategoryPlot(); CategoryAxis axis = plot.getDomainAxis(); axis.setLabelFont(new Font("宋体", Font.BOLD, 20)); axis.setTickLabelFont(new Font("宋体", Font.BOLD, 20)); ValueAxis rangeAxis = plot.getRangeAxis(); rangeAxis.setLabelFont(new Font("宋体", Font.BOLD, 20)); chart.getLegend().setItemFont(new Font("宋体", Font.BOLD, 20)); chart.getTitle().setFont(new Font("黑体", Font.ITALIC, 22)); panel = new ChartPanel(chart, true); //下面是王章偶然看到的生成图表图片的方法 File dir = new File("F:\\MyPicture\\"); if (!dir.exists()) { dir.mkdir(); } String fName = String.valueOf(System.currentTimeMillis())+"BarChart.png"; File file = new File("F:\\MyPicture\\", fName); try { ChartUtilities.saveChartAsPNG(file, chart, 400, 250); } catch (IOException e) { // TODO Auto-generated catch block e.printStackTrace(); }//生成一个png图片 } public ChartPanel getChartPanel() { return panel; } /** * 需要注意的是在向数据集中添加数据的时候 使用的是dataset.addValue()方法,而在饼状图的数据集添加数据的过程中,使用的是dataset.setValue()方法 * 这一点应该尤其注意。以免出错! * @return */ private static Dataset getDataset() { DefaultCategoryDataset dataset = new DefaultCategoryDataset(); dataset.addValue(1, "郭1", "大学"); dataset.addValue(2, "郭2", "高中"); dataset.addValue(3, "郭3", "高中"); dataset.addValue(4, "郭4", "高中"); dataset.addValue(5, "郭5", "初中"); dataset.addValue(5, "郭6", "初中"); dataset.addValue(4, "郭7", "初中"); dataset.addValue(3, "郭8", "小学"); dataset.addValue(2, "郭9", "幼儿园"); dataset.addValue(1, "张10", "幼儿园"); return dataset; } public static void main(String[] args) { JFrame frame = new JFrame(); frame.setLayout(new FlowLayout()); frame.add(new BarChartDemo().getChartPanel()); frame.setSize(1000, 600); frame.setDefaultCloseOperation(0); frame.setLocationRelativeTo(null); frame.setVisible(true); }}
- 1
- 2
- 3
- 4
- 5
- 6
- 7
- 8
- 9
- 10
- 11
- 12
- 13
- 14
- 15
- 16
- 17
- 18
- 19
- 20
- 21
- 22
- 23
- 24
- 25
- 26
- 27
- 28
- 29
- 30
- 31
- 32
- 33
- 34
- 35
- 36
- 37
- 38
- 39
- 40
- 41
- 42
- 43
- 44
- 45
- 46
- 47
- 48
- 49
- 50
- 51
- 52
- 53
- 54
- 55
- 56
- 57
- 58
- 59
- 60
- 61
- 62
- 63
- 64
- 65
- 66
- 67
- 68
- 69
- 70
- 71
- 72
- 73
- 74
- 75
- 76
- 77
- 78
- 79
- 80
- 81
- 82
- 83
- 84
- 85
- 86
- 87
- 88
- 89
- 90
- 91
- 92
- 93
- 94
- 95
- 96
- 97
- 98
- 99
- 100
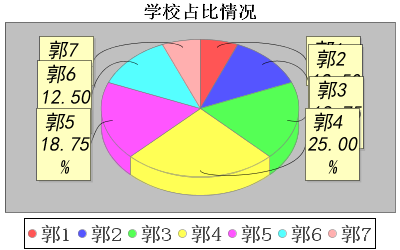
然后是饼状图,里面的注释也是很到位的进行了解释
package mytest;import java.awt.FlowLayout;import java.awt.Font;import java.io.File;import java.io.IOException;import java.text.DecimalFormat;import java.text.NumberFormat;import javax.swing.JFrame;import org.jfree.chart.ChartFactory;import org.jfree.chart.ChartPanel;import org.jfree.chart.ChartUtilities;import org.jfree.chart.JFreeChart;import org.jfree.chart.labels.StandardPieSectionLabelGenerator;import org.jfree.chart.plot.PiePlot;import org.jfree.data.general.DefaultPieDataset;public class PieChartDemo { ChartPanel panel; /** * 创建饼状图的步骤如下: 1、创建一个饼状的实例,注意传参的格式,还有需要注意的是此时的数据集应该是defaultPieDataset, * 而不是CategoryDataset格式 2、获得饼状图的所在区域 3、设置两个格式化的数据格式,为后面的床架饼状图的实例做基础 * 4、细节方面是对无数据、零值、负值等情况的处理 5、最后就是设置在出现汉字的地方进行字体内容的设置了(同样的,这是为了防止出现乱码的状况) */ public PieChartDemo() { DefaultPieDataset dataset = getDataset(); JFreeChart chart = ChartFactory.createPieChart3D("学校占比情况", dataset, true, false, false); PiePlot piePlot = (PiePlot) chart.getPlot(); DecimalFormat df = new DecimalFormat("0.00%"); NumberFormat nf = NumberFormat.getInstance(); StandardPieSectionLabelGenerator generator = new StandardPieSectionLabelGenerator( "{0} {2}", //获得StandardPieSectionLabelGenerator对象,生成的格式,{0}表示section名, //{1}表示section的值,{2}表示百分比。可以自定义 nf, df); piePlot.setLabelGenerator(generator);// 设置百分比 piePlot.setLabelFont(new Font("黑体", Font.ITALIC, 20)); // 当饼状图内额米有数据时,作如下数据中设置 piePlot.setNoDataMessage("此时并没有任何数据可用"); piePlot.setCircular(false); piePlot.setLabelGap(0.02D); piePlot.setIgnoreNullValues(true);// 设置不显示空位 piePlot.setIgnoreZeroValues(true);// 设置不显示负值或零值 panel = new ChartPanel(chart, true); chart.getTitle().setFont(new Font("宋体", Font.BOLD, 18)); chart.getLegend().setItemFont(new Font("宋体", Font.BOLD, 20)); //下面是王章偶然看到的生成图表图片的方法 File dir = new File("F:\\MyPicture\\"); if (!dir.exists()) { dir.mkdir(); } String fName = String.valueOf(System.currentTimeMillis())+"pie.png"; File file = new File("F:\\MyPicture\\", fName); try { ChartUtilities.saveChartAsPNG(file, chart, 400, 250); } catch (IOException e) { // TODO Auto-generated catch block e.printStackTrace(); }//生成一个png图片 } /** * 需要注意的是在向数据集中添加数据的时候调用的是dataset.setvalue()方法,而不是柱状图中的addValue()方法 * 这一点应该尤其注意一下,以免在使用的时候出现错误 * @return */ private DefaultPieDataset getDataset() { DefaultPieDataset dataset = new DefaultPieDataset(); dataset.setValue("郭1", 1); dataset.setValue("郭2", 2); dataset.setValue("郭3", 3); dataset.setValue("郭4", 4); dataset.setValue("郭5", 3); dataset.setValue("郭6", 2); dataset.setValue("郭7", 1); return dataset; } public ChartPanel getPieChartPanel() { return panel; } public static void main(String[] args) { JFrame frame = new JFrame(); frame.setLayout(new FlowLayout()); frame.add(new PieChartDemo().getPieChartPanel()); frame.setSize(1000, 700); frame.setVisible(true); }}
- 1
- 2
- 3
- 4
- 5
- 6
- 7
- 8
- 9
- 10
- 11
- 12
- 13
- 14
- 15
- 16
- 17
- 18
- 19
- 20
- 21
- 22
- 23
- 24
- 25
- 26
- 27
- 28
- 29
- 30
- 31
- 32
- 33
- 34
- 35
- 36
- 37
- 38
- 39
- 40
- 41
- 42
- 43
- 44
- 45
- 46
- 47
- 48
- 49
- 50
- 51
- 52
- 53
- 54
- 55
- 56
- 57
- 58
- 59
- 60
- 61
- 62
- 63
- 64
- 65
- 66
- 67
- 68
- 69
- 70
- 71
- 72
- 73
- 74
- 75
- 76
- 77
- 78
- 79
- 80
- 81
- 82
- 83
- 84
- 85
- 86
- 87
- 88
- 89
- 90
- 91
- 92
- 93
- 94
- 95
- 96
- 97
- 98
- 99
- 100
- 101
- 102
- 103
- 104
这里并没有创建折线图,大致的步骤和这两种图的创建相当。详细链接
总结:
java创建图表来对数据进行分析,使得数据的展示形式更加生动,具体。
这里我还得到了一个知识点,那就是利用相关方法,来实现对这种图集的生成操作,只需指定号生成图像的保存路径及保存名称即可实现。如下
//下面是王章偶然看到的生成图表图片的方法 File dir = new File("F:\\MyPicture\\"); if (!dir.exists()) { dir.mkdir(); } String fName = String.valueOf(System.currentTimeMillis())+"pie.png"; File file = new File("F:\\MyPicture\\", fName); try { ChartUtilities.saveChartAsPNG(file, chart, 400, 250); } catch (IOException e) { // TODO Auto-generated catch block e.printStackTrace(); }//生成一个png图片
- 1
- 2
- 3
- 4
- 5
- 6
- 7
- 8
- 9
- 10
- 11
- 12
- 13
the end!
给我老师的人工智能教程打call!http://blog.csdn.net/jiangjunshow