详细注释
'''
引力波绘制
'''
import numpy as np
import matplotlib.pyplot as plt
from scipy.io import wavfile#读取波形的库
'''
从配置文档中读取时间相关数据
r表示转义,当出现特殊字符时加一个r表示原来的字符
H1_Strain.wav、L1_Strain.wav:音频文件
wf_template.txt:引力波的理论模型
np.genfromtxt():执行两个循环:将文件的每一行转化为字符串序列和将每一个字符串序列转化为相应的数据类型;即是一个两行的矩阵
transpose():矩阵转置
'''
rate_h,hstrain=wavfile.read(r"H1_Strain.wav","rb") #rate:速率 strain:数据矩阵
rate_l,lstrain=wavfile.read(r"L1_Strain.wav","rb")
reftime,ref_H1=np.genfromtxt(r"wf_template.txt").transpose()#reftime:时间序列 ref_H1:信号的数据
'''
求导数,得到波形的时间间隔
'''
htime_interval=1/rate_h
ltime_interval=1/rate_h
'''
丢失信号起始点
'''
htime_len=hstrain.shape[0]/rate_h
#hstrain.shape[0]表示读取矩阵的第一维的长度即数据点的个数,除以坐标轴rate就可以得到函数在坐标轴上的总长度
htime=np.arange(-htime_len/2,htime_len/2,htime_interval)
#绘制出关于原点对称的图像,以-1/2为起点1/2,interval为时间间隔 创造时间序列htime
ltime_len=lstrain.shape[0]/rate_l
ltime=np.arange(-ltime_len/2,ltime_len/2,ltime_interval)
'''
绘制图形y
绘制以时间为x轴,应变数据为Y轴的图像,并设置标题和坐标轴的标签
'''
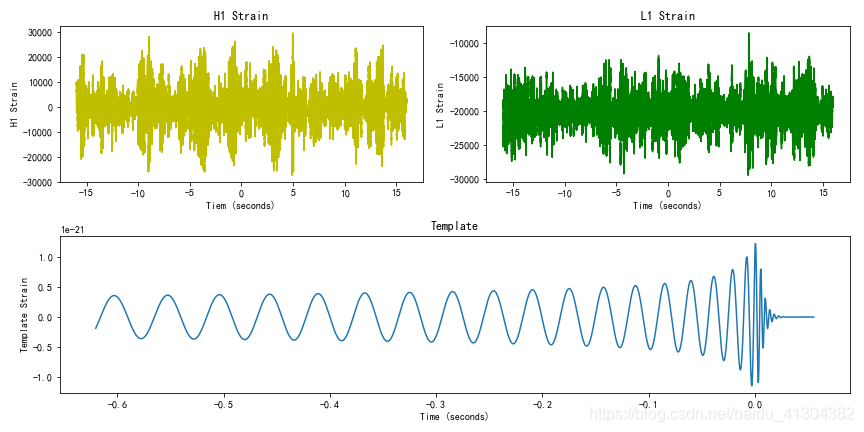
fig=plt.figure(figsize=(12,6))#创绘图空间12*6
plth=fig.add_subplot(221)
plth.plot(htime,hstrain,'y')
plth.set_xlabel('Tiem (seconds)')
plth.set_ylabel('H1 Strain')
plth.set_title('H1 Strain')
pltl = fig.add_subplot(222)
pltl.plot(ltime, lstrain, 'g')
pltl.set_xlabel('Time (seconds)')
pltl.set_ylabel('L1 Strain')
pltl.set_title('L1 Strain')
pltref = fig.add_subplot(212)
pltref.plot(reftime, ref_H1)
pltref.set_xlabel('Time (seconds)')
pltref.set_ylabel('Template Strain')
pltref.set_title('Template')
fig.tight_layout()#自动调整图像的四周边缘
plt.savefig("Wave.png")
plt.show()
plt.close(fig)