引力波的绘制源
https://python123.io/dv/grawave.html
导入模块
import numpy as np
import matplotlib.pyplot as plt
from scipy.io import wavfile
读取数据
"""打开声频的文件"""
rate_h,hstrain = wavfile.read(r'H1_Strain.wav','rb')
rate_l,lstrain = wavfile.read(r'L1_Strain.wav','rb')
"""
执行两个运算循环
1是将文件每一行转换成字符串序列
2是将每个字符串转换为相应的数据类型
"""
reftime,ref_H1=np.genfromtxt('wf_template.txt').transpose()
处理数据
hi=1/rate_h
li=1/rate_l

htime_len=hstrain.shape[0]/rate_h
htime=np.arange(-htime_len/2,htime_len/2,hi)
ltime_len=lstrain.shape[0]/rate_l
ltime=np.arange(-ltime_len/2,ltime_len/2,li)
绘制图形
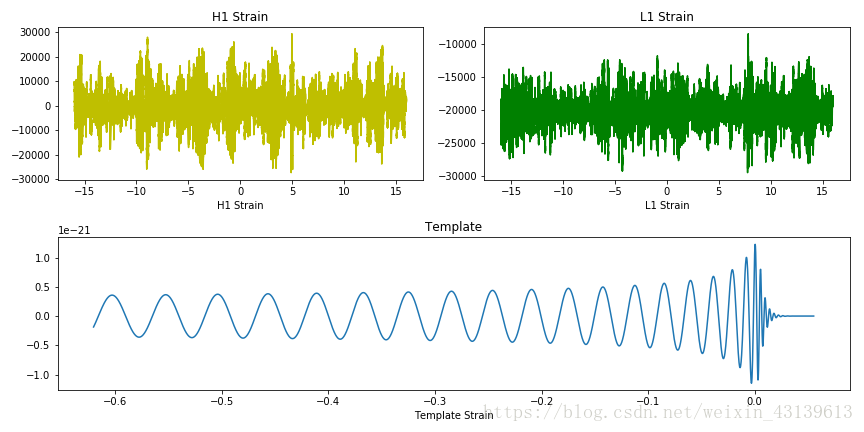
fig=plt.figure(figsize=(12,6))

plth=fig.add_subplot(221)
plth.plot(htime,hstrain,'y')
plth.set_xlabel('Time(seconds)')
plth.set_xlabel('H1 Strain')
plth.set_title('H1 Strain')

pltl=fig.add_subplot(222)
pltl.plot(ltime,lstrain,'g')
pltl.set_xlabel('Time(seconds)')
pltl.set_xlabel('L1 Strain')
pltl.set_title('L1 Strain')

pltt=fig.add_subplot(212)
pltt.plot(reftime,ref_H1)
pltt.set_xlabel('Time(seconds)')
pltt.set_xlabel('Template Strain')
pltt.set_title('Template')
自动调整图形外部边缘
并保存为PNG格式
fig.tight_layout()

plt.savefig('引力波.png')
plt.show()
plt.close(fig)