文章目录
1.多图合一(subplot)
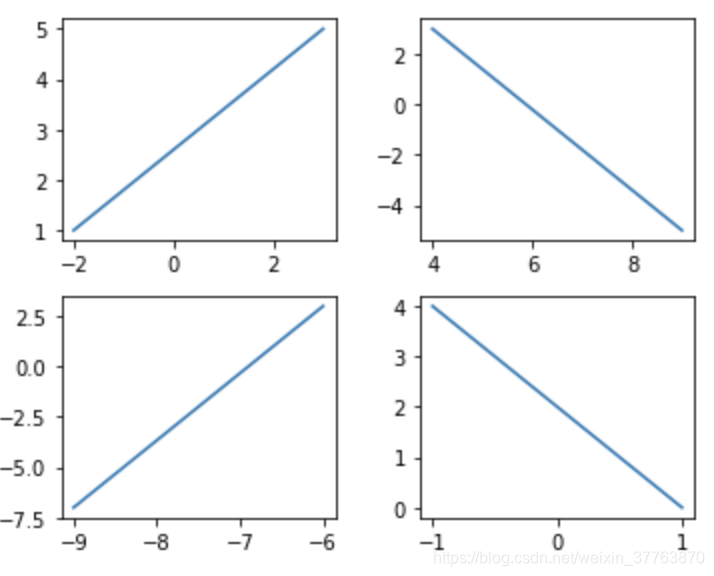
matplotlib 是可以组合许多的小图, 放在一张大图里面显示的. 使用到的方法叫作 subplot.
使用import导入matplotlib.pyplot模块, 并简写成plt. 使用plt.figure创建一个图像窗口.
使用plt.subplot来创建小图. plt.subplot(2,2,1)表示将整个图像窗口分为2行2列, 当前位置为1. 使用plt.plot([-2,3],[1,5])在第1个位置创建一个小图.依此类推后面三个子图。
import matplotlib.pyplot as plt

plt.figure(figsize=(5,4))

plt.subplot(2,2,1)   #221亦可
plt.plot([-2,3],[1,5])

plt.subplot(2,2,2)
plt.plot([4,9],[3,-5])

plt.subplot(2,2,3)
plt.plot([-6,-9],[3,-7])

plt.subplot(2,2,4)
plt.plot([1,-1],[0,4])

plt.tight_layout()  #自动调整子批次参数,使子批次适合图形区域
2.分格显示
2.1.subplot2grid方法
使用plt.subplot2grid来创建第1个小图, (3,3)表示将整个图像窗口分成3行3列, (0,0)表示从第0行第0列开始作图,colspan=3表示列的跨度为3, rowspan=1表示行的跨度为1. colspan和rowspan缺省, 默认跨度为1.后面子图与此方法一样。
import matplotlib.pyplot as plt

plt.figure()
ax1 = plt.subplot2grid((3, 3), (0, 0), colspan=3)  #plt.subplot2grid(shape, location, rowspan, colspan)


ax1.plot([1.6, 2.3], [0.8, 1.2])    #画直线
ax1.set_title('this is ax1')

ax2 = plt.subplot2grid((3, 3), (1, 0), colspan=1)  #起始(1,0)横向跨度为1
ax3 = plt.subplot2grid((3, 3), (1, 2), rowspan=2)  #起始(1,2)纵向跨度为2
ax4 = plt.subplot2grid((3, 3), (2, 0))
ax4.scatter([0.5, 1], [1.8, 1.5])
ax4.set_xlabel('X')
ax4.set_ylabel('Y')
ax5 = plt.subplot2grid((3, 3), (2, 1))

plt.tight_layout()
plt.show()

2.2.gridspec方法
使用import导入matplotlib.pyplot模块, 并简写成plt. 使用import导入matplotlib.gridspec, 并简写成gridspec.
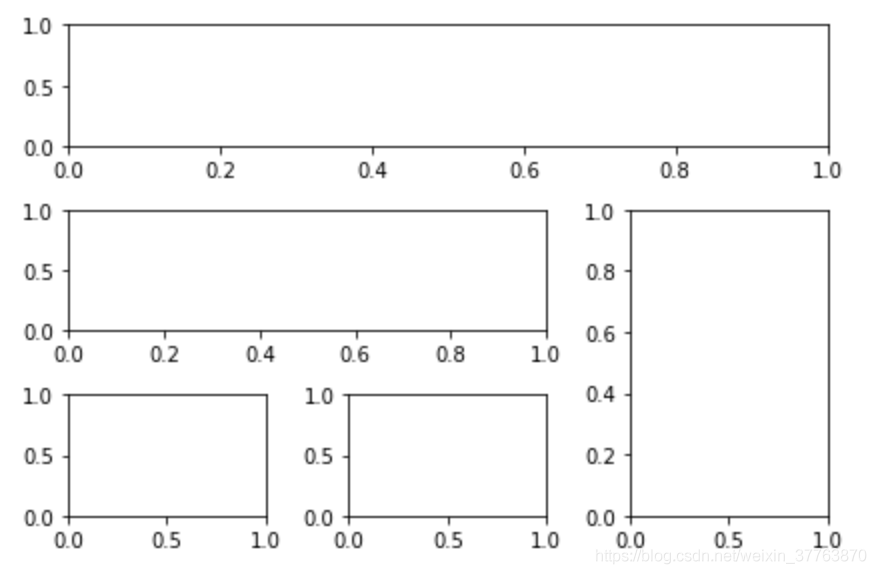
使用plt.figure()创建一个图像窗口, 使用gridspec.GridSpec将整个图像窗口分成3行3列.
使用plt.subplot来作图, gs[0, :]表示这个图占第0行和所有列, gs[1, :2]表示这个图占第1行和第2列前的所有列, gs[1:, 2]表示这个图占第1行后的所有行和第2列, gs[-1, 0]表示这个图占倒数第1行和第0列, gs[-1, -2]表示这个图占倒数第1行和倒数第2列.
import matplotlib.pyplot as plt
import matplotlib.gridspec as gridspec

plt.figure()
gs = gridspec.GridSpec(3, 3)
# use index from 0
ax6 = plt.subplot(gs[0, :])
ax7 = plt.subplot(gs[1, :2])
ax8 = plt.subplot(gs[1:, 2])    #第一行第二行的第二列(起始为0)
ax9 = plt.subplot(gs[-1, 0])    #最后一行第一个位置
ax10 = plt.subplot(gs[-1, -2])  #最后一行倒数第二个位置

plt.tight_layout()
plt.show()
2.3.subplots方法
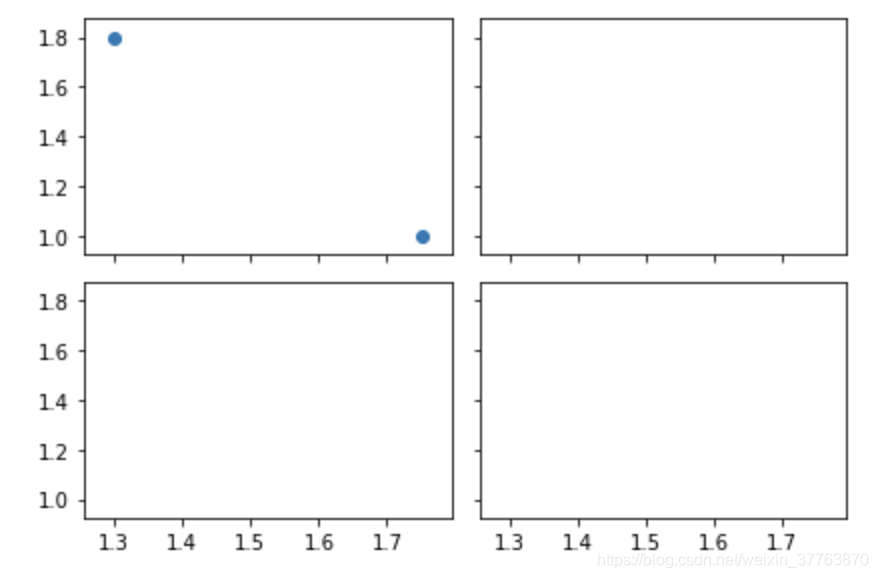
使用plt.subplots建立一个2行2列的图像窗口,sharex=True表示共享x轴坐标, sharey=True表示共享y轴坐标. ((ax11, ax12), (ax13, ax14))表示第1行从左至右依次放ax11和ax12, 第2行从左至右依次放ax13和ax14.
使用ax11.scatter创建一个散点图.
import matplotlib.pyplot as plt

f, ((ax11, ax12), (ax13, ax14)) = plt.subplots(2, 2, sharex=True, sharey=True)
ax11.scatter([1.3,1.75], [1.8,1])

plt.tight_layout()   #表示紧凑显示图像
plt.show()
3.图中有图(plot in plot)
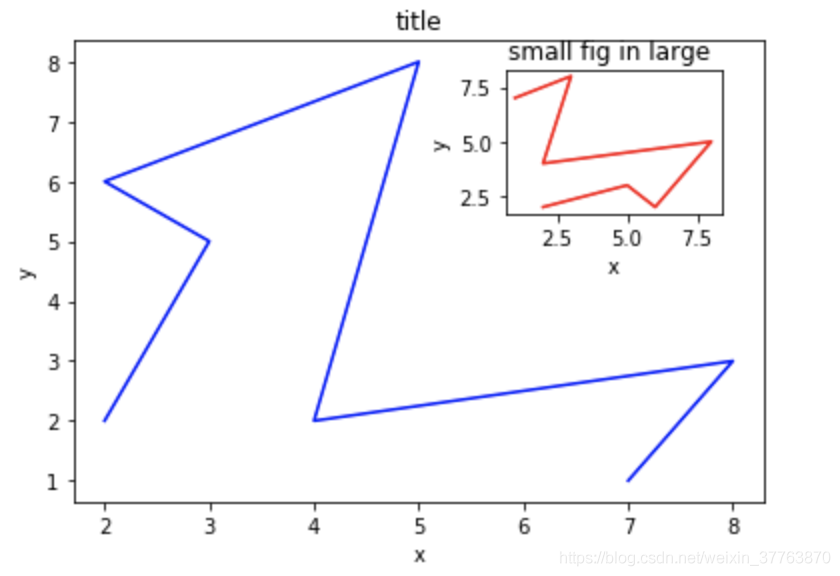
首先确定大图左下角的位置以及宽高:left, bottom, width, height = 0.1, 0.1, 0.8, 0.8
注意,4个值都是占整个figure坐标系的百分比。在这里,假设figure的大小是10x10,那么大图就被包含在由(1, 1)开始,宽8,高8的坐标系内。
将大图坐标系添加到figure中,颜色为r(red),取名为title。
接着,我们来绘制右上角的小图,步骤和绘制大图一样,注意坐标系位置和大小的改变:
import matplotlib.pyplot as plt

fig = plt.figure()   #定义一个图像窗口

x = [2, 3, 2, 5, 4, 8, 7]
y = [2, 5, 6, 8, 2, 3, 1]

left, bottom, width, height = 0.1, 0.1, 0.8, 0.8   #left、bottom为原点坐标(按比例),width, height为图的长宽(按比例)
ax1 = fig.add_axes([left, bottom, width, height])   #在fig中添加一个图
ax1.plot(x, y, 'blue')
ax1.set_xlabel('x')
ax1.set_ylabel('y')
ax1.set_title('title')

left, bottom, width, height = 0.6, 0.6, 0.25, 0.25
ax2 = fig.add_axes([left, bottom, width, height])    #在fig中再添加一个图
ax2.plot(y, x, 'r')
ax2.set_xlabel('x')
ax2.set_ylabel('y')
ax2.set_title('small fig in large ')

plt.show()
效果如下:
4.设置双坐标轴
有时候我们会用到次坐标轴,即在同个图上有第2个y轴存在。同样可以用matplotlib做到,而且很简单。
对ax1调用twinx()方法,生成如同镜面效果后的ax2
import matplotlib.pyplot as plt
import numpy as np

x = np.arange(0,10,0.1)
y1 = 2*(x**2)
y2 = -0.5*(x**2)

fig, ax1 = plt.subplots()

ax2 = ax1.twinx()    #使用twinx添加y轴的坐标轴
ax1.plot(x, y1, 'g-')
ax2.plot(x, y2, 'r+')

#设置标签(共用X轴)
ax1.set_xlabel('X')
ax1.set_ylabel('Y1',color='g')
ax2.set_ylabel('Y2',color='r')

plt.show()

