1.说明
1.1 多图:
221,222
212
------------附最后讲解,这下更清楚了吧,取个名字:颠倒一下---
1.2 多图
211
223,224
------------附最后讲解,这下更清楚了吧-----
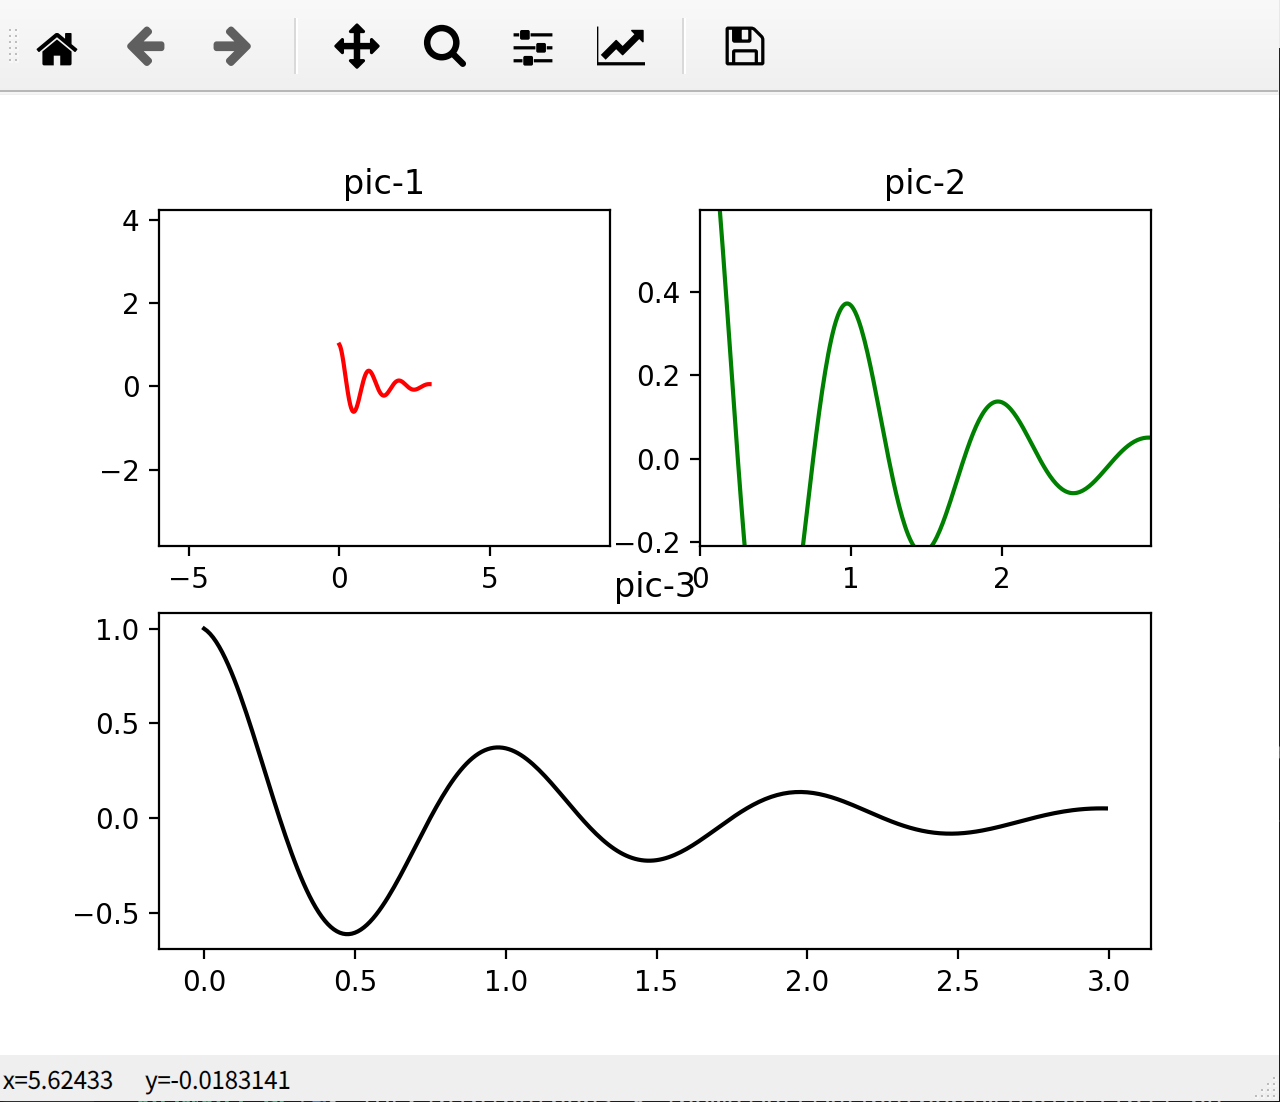
2.图
3.代码
import numpy as np
import matplotlib.pyplot as plt

def f(t):
    return np.exp(-t) * np.cos(2*np.pi*t)
t1 = np.arange(0.0, 3.0, 0.01)

#表1
#ax1 = plt.subplot(221)
ax1 = plt.subplot(2,2,1) #221=2,2,1
ax1.margins(2, 2)           # Values >0.0 zoom out
ax1.plot(t1, f(t1), 'r')
ax1.set_title('pic-1')
#表2
ax2 = plt.subplot(222) #222=2,2,2
ax2.margins(x=0, y=-0.25)   # Values in (-0.5, 0.0) zooms in to center
ax2.plot(t1, f(t1), 'g')
ax2.set_title('pic-2')

#表3
#ax3 = plt.subplot(212) #212=2,1,2=223+224=第2行,第1列,占2个位置?
ax3 = plt.subplot(2,1,2)
ax3.margins(0.05)           # Default margin is 0.05, value 0 means fit
ax3.plot(t1, f(t1), 'k')
ax3.set_title('pic-3')

plt.show()#展现图片
4.说明
subplot的参数221意思就是,把整个大的画板分成2*2,这个子图在第1个位置,占一个位置
因为分成了2*2,那么还可以有222,223,224.
如下布局
---------
221 222
223 224
---------
plt.subplot(2,2,1)表示将整个图像窗口分为2行2列, 当前位置为1.
教学地址
https://morvanzhou.github.io/tutorials/data-manipulation/plt/4-1-subpot1/
未说明:212=223+224=第2行,第1列,占2个位置
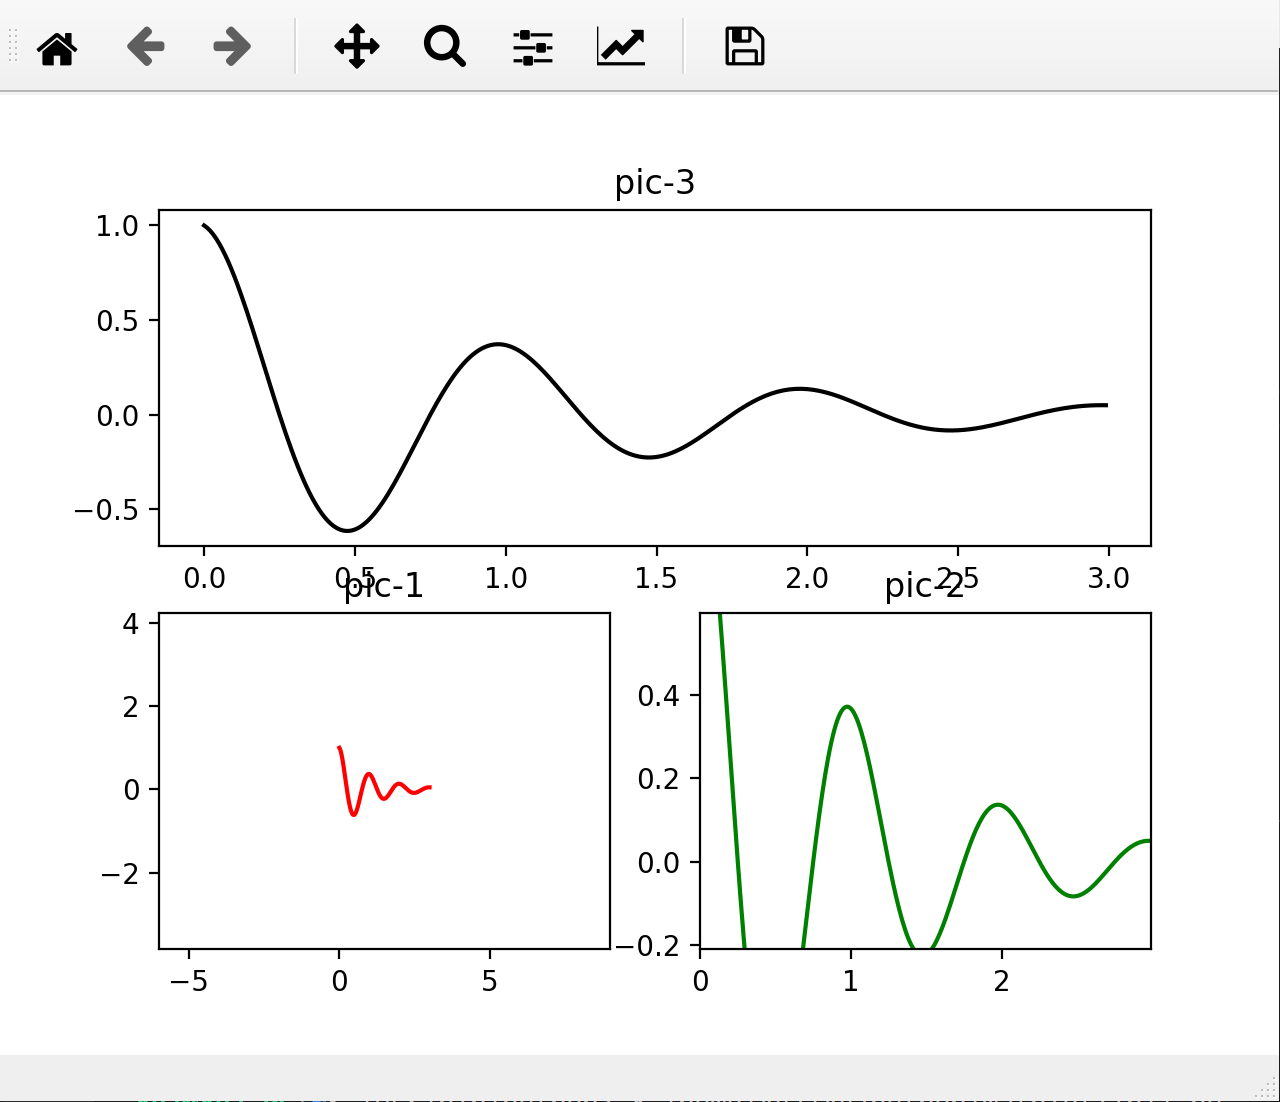
5.颠倒一下,更清楚
5.1 多图显示
--------------------------
211(221,222)
223 , 224(212)
------------------------
看懂了么?我搞懂了。
5.2 代码:修改一下
import numpy as np
import matplotlib.pyplot as plt

def f(t):
    return np.exp(-t) * np.cos(2*np.pi*t)
t1 = np.arange(0.0, 3.0, 0.01)

#表1
ax1 = plt.subplot(223)
ax1.margins(2, 2)
ax1.plot(t1, f(t1), 'r')
ax1.set_title('pic-1')
#表2
ax2 = plt.subplot(224)
ax2.margins(x=0, y=-0.25)
ax2.plot(t1, f(t1), 'g')
ax2.set_title('pic-2')

#表3
ax3 = plt.subplot(211)
ax3.margins(0.05)
ax3.plot(t1, f(t1), 'k')
ax3.set_title('pic-3')

plt.show()#展现图片
5.3 图