在matplotlib中,整个图像为一个Figure对象
在Figure对象中可以包含一个或者多个Axes对象 每个Axes对象相当于一个子图了
每个Axes(ax)对象都是一个拥有自己坐标系统的绘图区域
plt.figure, plt.subplot
1.
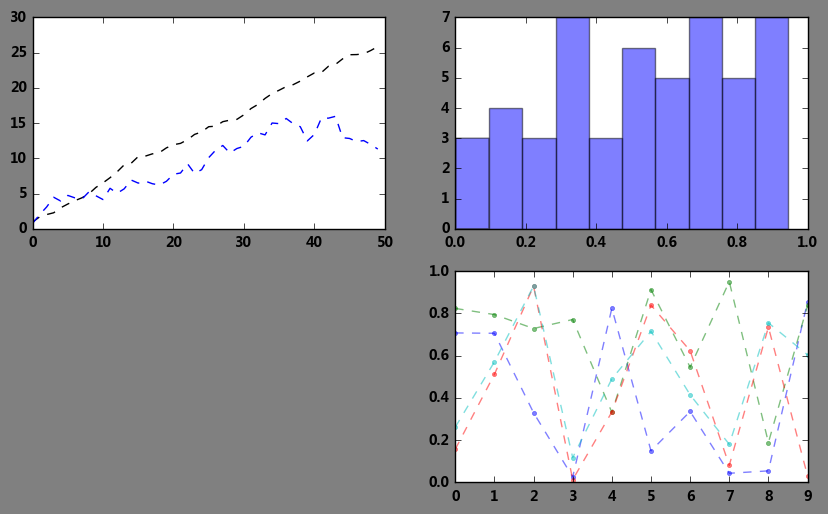
import numpy as np
import pandas as pd
import matplotlib.pyplot as plt
% matplotlib inline
# 导入相关模块

# 子图创建1 - 先建立子图然后填充图表

fig = plt.figure(figsize=(10,6),facecolor = 'gray')

ax1 = fig.add_subplot(2,2,1)  # 第一行的左图
plt.plot(np.random.rand(50).cumsum(),'k--')
plt.plot(np.random.randn(50).cumsum(),'b--')
# 先创建图表figure,然后生成子图,(2,2,1)代表创建2*2的矩阵表格,然后选择第一个,顺序是从左到右从上到下
# 创建子图后绘制图表,会绘制到最后一个子图

ax2 = fig.add_subplot(2,2,2)  # 第一行的右图
ax2.hist(np.random.rand(50),alpha=0.5)

ax4 = fig.add_subplot(2,2,4)  # 第二行的右图
df2 = pd.DataFrame(np.random.rand(10, 4), columns=['a', 'b', 'c', 'd'])
ax4.plot(df2,alpha=0.5,linestyle='--',marker='.')
# 也可以直接在子图后用图表创建函数直接生成图表
输出:
[<matplotlib.lines.Line2D at 0x1d078fe2e48>,
 <matplotlib.lines.Line2D at 0x1d078fea2e8>,
 <matplotlib.lines.Line2D at 0x1d078fea4e0>,
 <matplotlib.lines.Line2D at 0x1d078fea668>]
2.
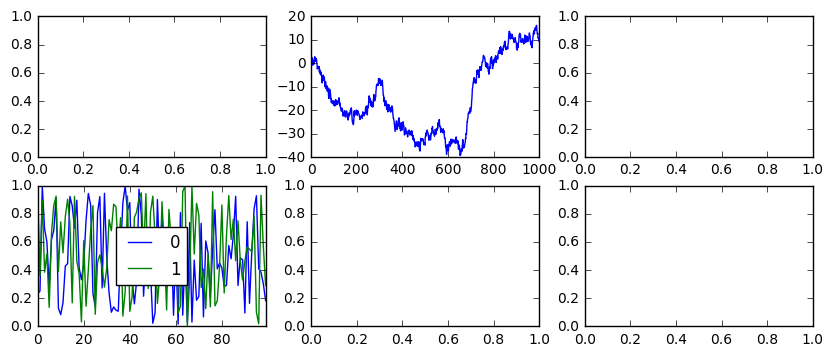
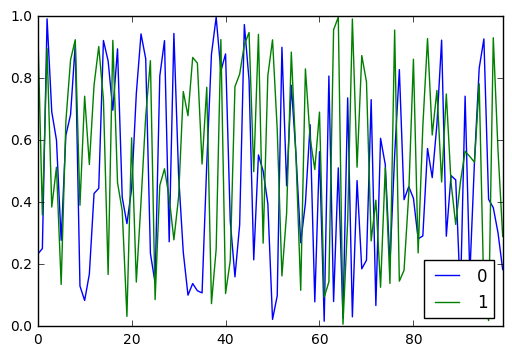
# 子图创建2 - 创建一个新的figure,并返回一个subplot对象的numpy数组 → plt.subplot

fig,axes = plt.subplots(2,3,figsize=(10,4))   #因为这里返回两个对象,一个使整体图表的对象,一个是不同子图组成的数组
print(fig)
print(axes, axes.shape, type(axes))
ts = pd.Series(np.random.randn(1000).cumsum())

# 生成图表对象的数组

ax1 = axes[0,1]   #指定了第0排第一个图表
ax1.plot(ts)

df = pd.DataFrame(np.random.rand(100,2))
df.plot()
df.plot(ax = axes[1,0])
输出:
Figure(720x288)
[[<matplotlib.axes._subplots.AxesSubplot object at 0x0000026A4E8A2668>
  <matplotlib.axes._subplots.AxesSubplot object at 0x0000026A4E620A90>
  <matplotlib.axes._subplots.AxesSubplot object at 0x0000026A4E039358>]
 [<matplotlib.axes._subplots.AxesSubplot object at 0x0000026A4DFB31D0>
  <matplotlib.axes._subplots.AxesSubplot object at 0x0000026A4E4BFCC0>
  <matplotlib.axes._subplots.AxesSubplot object at 0x0000026A4E0F7710>]] (2, 3) <class 'numpy.ndarray'>
<matplotlib.axes._subplots.AxesSubplot at 0x26a4dfb31d0>
3.
# plt.subplots,参数调整

fig,axes = plt.subplots(2,2,sharex=True,sharey=True)
# sharex,sharey:是否共享x,y刻度     所有subplot之间应该使用相同的x轴刻度,相同的y轴刻度。

for i in range(2):
    for j in range(2):
        axes[i,j].hist(np.random.randn(500),color='k',alpha=0.5)
plt.subplots_adjust(wspace=0.5,hspace=0.5)
# wspace,hspace:用于控制子图之间的水平间隔和垂直间隔
输出:
