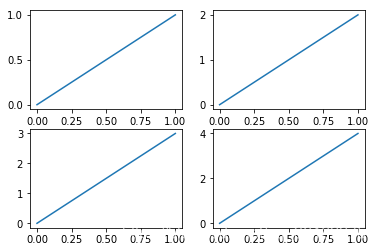
import matplotlib.pyplot as plt

plt.figure(figsize=(6, 4))
# plt.subplot(n_rows, n_cols, plot_num)
plt.subplot(2, 2, 1)
plt.plot([0, 1], [0, 1])

plt.subplot(222)
plt.plot([0, 1], [0, 2])

plt.subplot(223)
plt.plot([0, 1], [0, 3])

plt.subplot(224)
plt.plot([0, 1], [0, 4])

plt.show()
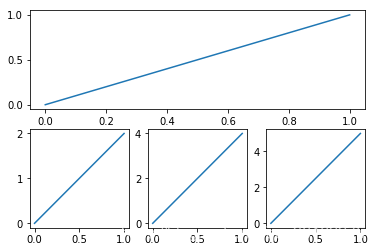
import matplotlib.pyplot as plt

plt.subplot(2,1,1)
plt.plot([0,1],[0,1])

plt.subplot(2,3,4)
plt.plot([0,1],[0,2])

plt.subplot(235)
plt.plot([0,1],[0,4])

plt.subplot(236)
plt.plot([0,1],[0,5])

plt.show()
# subplot 分格显示

import matplotlib.pyplot as plt
import matplotlib.gridspec
plt.figure()
# colspan和rowspan缺省, 默认跨度为1.
ax1 = plt.subplot2grid((3,3),(0,0),colspan=3)
ax1.plot([1,2],[1,2])
ax1.set_title('ax1_title')

ax2 = plt.subplot2grid((3,3),(1,0),colspan=2)
ax3 = plt.subplot2grid((3,3),(1,2),rowspan=2)
ax4 = plt.subplot2grid((3,3),(2,0))
ax5 = plt.subplot2grid((3,3),(2,1))

ax4.scatter([1,2],[2,2])
ax4.set_xlabel('ax4_x')
ax4.set_ylabel('ax4_y')
# 紧凑显示图像
plt.tight_layout()
plt.show()

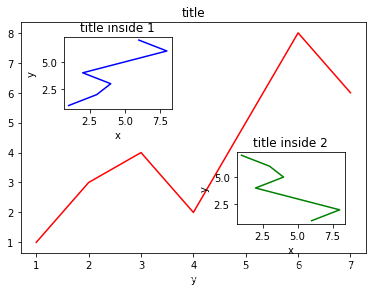
# 图中图 plot in plot
import matplotlib.pyplot as plt

fig = plt.figure()

x = [1,2,3,4,5,6,7]
y = [1,3,4,2,5,8,6]

# 0.1, 0.1, 0.8, 0.8 都是占据整个plot的percent
left,bottom,width,height = 0.1,0.1,0.8,0.8
ax1 = fig.add_axes([left,bottom,width,height])

# 绘制大图
ax1.plot(x,y,'r')
ax1.set_xlabel('x')
ax1.set_xlabel('y')
ax1.set_title('title')

# 小图
left, bottom, width, height = 0.2, 0.6, 0.25, 0.25
ax2 = fig.add_axes([left,bottom,width,height])
ax2.plot(y,x,'b')
ax2.set_xlabel('x')
ax2.set_ylabel('y')
ax2.set_title('title')
ax2.set_title('title inside 1')

# 更简单的方式
plt.axes([0.6, 0.2, 0.25, 0.25])
plt.plot(y[::-1], x, 'g') # 注意对y进行了逆序处理
plt.xlabel('x')
plt.ylabel('y')
plt.title('title inside 2')
#b = a[i:j:s]这种格式呢,i,j与上面的一样,但s表示步进,缺省为1.
# 所以a[i:j:1]相当于a[i:j]
# 当s<0时,i缺省时,默认为-1. j缺省时,默认为-len(a)-1
# 所以a[::-1]相当于 a[-1:-len(a)-1:-1],也就是从最后一个元素到第一个元素复制一遍。所以你看到一个倒序的东东。
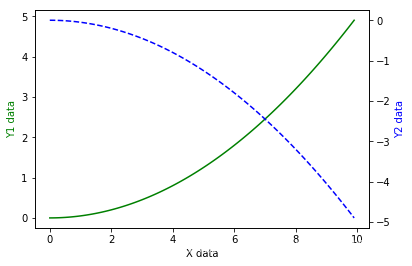
# 次坐标轴
import matplotlib.pyplot as plt
import numpy as np

x = np.arange(0,10,0.1)

y1 = 0.05 * x**2
y2 = -1*y1
fig, ax1 = plt.subplots()
# print(ax1)
# print(fig)
# 这里不是很懂为什么两个print输出的参数有一些不同

# ax2和ax1镜像
ax2 = ax1.twinx()

ax1.plot(x,y1,'g-')

ax1.set_xlabel('X data')
ax1.set_ylabel('Y1 data',color='g')

ax2.plot(x,y2,'b--')
ax2.set_ylabel('Y2 data',color='b')
Text(0,0.5,'Y2 data')
链接:https://nbviewer.jupyter.org/github/renhaofan/jupyfiles/blob/master/matplotlib3.ipynb