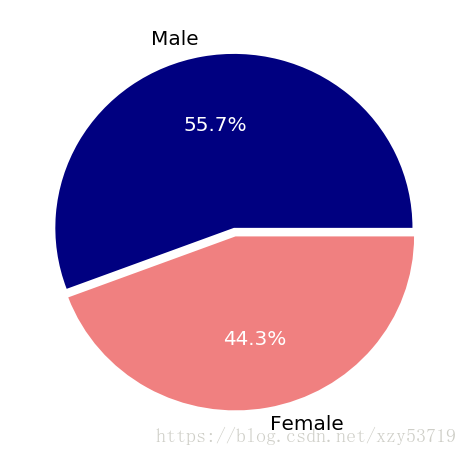
饼图pie
import matplotlib.pyplot as plt
import numpy as np
%matplotlib inline
m = 51212
f = 40732
m_perc = m/(m+f)
f_perc = f/(m+f)
colors = ['navy','lightcoral']
labels = ['Male','Female']
plt.figure(figsize=(8,8))
#autopct,百分比显示,固定样式
#explode,图标间间隔
paches, texts, autotexts = plt.pie([m_perc,f_perc],labels = labels ,colors=colors, autopct='%1.1f%%', explode=[0,0.05])

#修改字体颜色
for text in texts+autotexts:
    text.set_fontsize(20)
for text in autotexts:
    text.set_color('white')
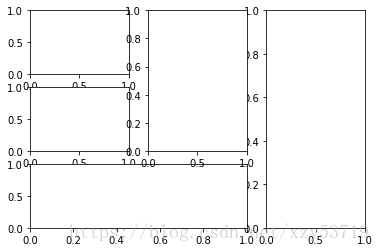
子图
#设置子图的自定义布局,大小不一致
ax1 = plt.subplot2grid((3,3),(0,0))
ax2 = plt.subplot2grid((3,3),(1,0))
ax3 = plt.subplot2grid((3,3),(0,2),rowspan=3)
ax4 = plt.subplot2grid((3,3),(2,0),colspan=2)
ax5 = plt.subplot2grid((3,3),(0,1),rowspan=2)
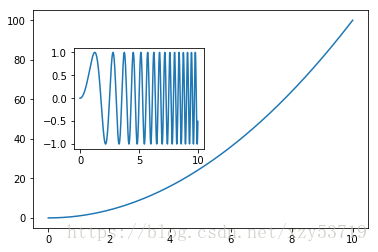
嵌套图
x = np.linspace(0,10,1000)
y1 = x**2
y2 = np.sin(x**2)
fig,ax1 = plt.subplots()
left,bottom,width,height = [0.22,0.4,0.3,0.35]
#添加子图
ax2 = fig.add_axes([left,bottom,width,height])
ax1.plot(x,y1)
ax2.plot(x,y2)
[<matplotlib.lines.Line2D at 0x188f1f03b38>]
import matplotlib.pyplot as plt
from mpl_toolkits.axes_grid1.inset_locator import inset_axes
def autolabel(rects):
for rect in rects:
height = rect.get_height()
ax1.text(rect.get_x() + rect.get_width()/2., 1.02*height, "{:,}".format(float(height)), ha='center', va='bottom',fontsize=18)
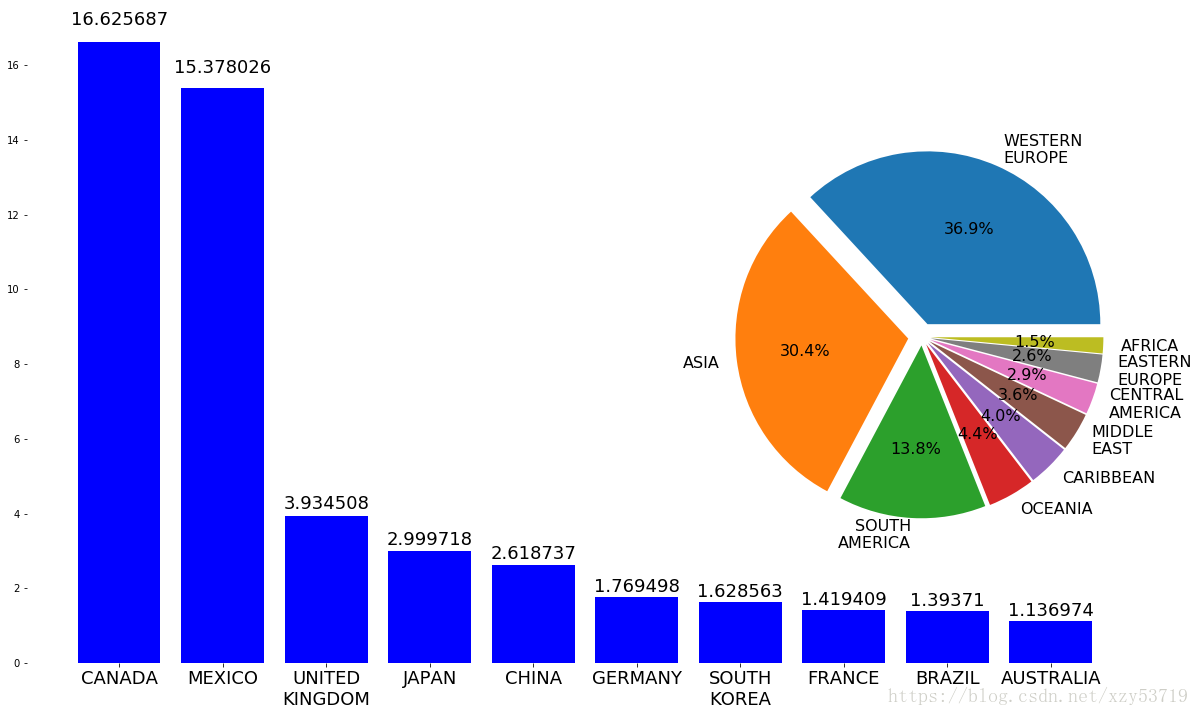
top10_arrivals_countries = ['CANADA','MEXICO','UNITED\nKINGDOM',\
'JAPAN','CHINA','GERMANY','SOUTH\nKOREA',\
'FRANCE','BRAZIL','AUSTRALIA']
top10_arrivals_values = [16.625687, 15.378026, 3.934508, 2.999718,\
2.618737, 1.769498, 1.628563, 1.419409,\
1.393710, 1.136974]
arrivals_countries = ['WESTERN\nEUROPE','ASIA','SOUTH\nAMERICA',\
'OCEANIA','CARIBBEAN','MIDDLE\nEAST',\
'CENTRAL\nAMERICA','EASTERN\nEUROPE','AFRICA']
arrivals_percent = [36.9,30.4,13.8,4.4,4.0,3.6,2.9,2.6,1.5]
fig, ax1 = plt.subplots(figsize=(20,12))
pic1 = ax1.bar(range(10),top10_arrivals_values,color='blue')
plt.xticks(range(10),top10_arrivals_countries,fontsize=18)
ax2 = inset_axes(ax1,width = 6,height = 6,loc = 5)
explode = (0.08, 0.08, 0.05, 0.05,0.05,0.05,0.05,0.05,0.05)
patches, texts, autotexts = ax2.pie(arrivals_percent,labels=arrivals_countries,autopct='%1.1f%%',explode=explode)
for text in texts+autotexts:
text.set_fontsize(16)
for spine in ax1.spines.values():
spine.set_visible(False)
autolabel(pic1)
import numpy as np
from matplotlib.patches import Circle, Wedge, Polygon, Ellipse
from matplotlib.collections import PatchCollection
import matplotlib.pyplot as plt

fig, ax = plt.subplots()

patches = []

# Full and ring sectors drawn by Wedge((x,y),r,deg1,deg2)
leftstripe = Wedge((.46, .5), .15, 90,100)# Full sector by default
midstripe = Wedge((.5,.5), .15, 85,95)
rightstripe = Wedge((.54,.5), .15, 80,90)
lefteye = Wedge((.36, .46), .06, 0, 360, width=0.03)  # Ring sector drawn when width <1
righteye = Wedge((.63, .46), .06, 0, 360, width=0.03)
nose = Wedge((.5, .32), .08, 75,105, width=0.03)
mouthleft = Wedge((.44, .4), .08, 240,320, width=0.01)
mouthright = Wedge((.56, .4), .08, 220,300, width=0.01)
patches += [leftstripe,midstripe,rightstripe,lefteye,righteye,nose,mouthleft,mouthright]

# Circles
leftiris = Circle((.36,.46),0.04)
rightiris = Circle((.63,.46),0.04)
patches += [leftiris,rightiris]

# Polygons drawn by passing coordinates of vertices
leftear = Polygon([[.2,.6],[.3,.8],[.4,.64]], True)
rightear = Polygon([[.6,.64],[.7,.8],[.8,.6]], True)
topleftwhisker = Polygon([[.01,.4],[.18,.38],[.17,.42]], True)
bottomleftwhisker = Polygon([[.01,.3],[.18,.32],[.2,.28]], True)
toprightwhisker = Polygon([[.99,.41],[.82,.39],[.82,.43]], True)
bottomrightwhisker = Polygon([[.99,.31],[.82,.33],[.81,.29]], True)
patches+=[leftear,rightear,topleftwhisker,bottomleftwhisker,toprightwhisker,bottomrightwhisker]

# Ellipse drawn by Ellipse((x,y),width,height)
body = Ellipse((0.5,-0.18),0.6,0.8)
patches.append(body)

# Draw the patches
colors = 100*np.random.rand(len(patches)) # set random colors
p = PatchCollection(patches, alpha=0.4)
p.set_array(np.array(colors))
ax.add_collection(p)

# Show the figure
plt.show()