opencv-python
- 几何变换
import cv2
import numpy as np
import matplotlib.pyplot as plt
import os
path=os.getcwd()
img_path=path+'\\'+'code.png'
print(img_path)
img=cv2.imread(img_path)
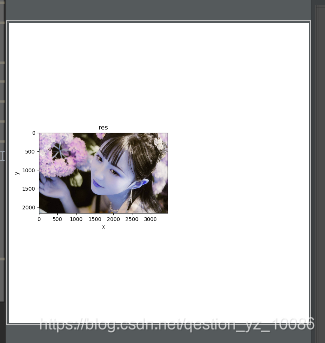
res1=cv2.resize(img,None,fx=2,fy=2,interpolation=cv2.INTER_CUBIC)
height,width=img.shape[:2]
res2=cv2.resize(img,(2*width,2*height),interpolation=cv2.INTER_CUBIC)
plt.figure(figsize=(8,8))
plt.subplot(121)
plt.imshow(res2)
plt.title("res")
plt.xlabel('x')
plt.ylabel('y')
plt.show()
- 图片缩放
import cv2
import numpy as np
import matplotlib.pyplot as plt
import os
path=os.getcwd()
img_path=path+'\\'+'code.png'
print(img_path)
img=cv2.imread(img_path)
result=cv2.resize(img,(200,100))

cv2.imshow("src",img)
cv2.imshow("result",result)

cv2.waitKey(0)
cv2.destroyAllWindows()

import cv2
import numpy as np
import matplotlib.pyplot as plt
import os
path=os.getcwd()
img_path=path+'\\'+'code.png'
img=cv2.imread(img_path)
width,height=img.shape[:2]

result=cv2.resize(img(int(width*0.6),int(height*0.4)))

cv2.imshow("src",img)
cv2.imshow("result",result)

cv2.waitKey(0)
cv2.destroyAllWindows()
import cv2
import numpy as np
import matplotlib.pyplot as plt
import os
path=os.getcwd()
img_path=path+'\\'+'code.png'
img=cv2.imread(img_path)
width,height=img.shape[:2]
#图片缩放
result=cv2.resize(img,None,fx=0.3,fy=0.3)
#显示图像
cv2.imshow("src",img)
cv2.imshow("result",result)
#等待显示
cv2.waitKey(0)
cv2.destroyAllWindows()

3.图像旋转
import cv2
import numpy as np
import matplotlib.pyplot as plt
import os
path=os.getcwd()
img_path=path+'\\'+'code.png'
img=cv2.imread(img_path)
#获得高,宽,以及通道数
rows,cols,channel=img.shape
#饶图像的中心旋转
M=cv2.getRotationMatrix2D((cols/2,rows/2),30,1)
rotated=cv2.warpAffine(img,M,(cols,rows))

#显示图像
cv2.imshow("img",img)
cv2.imshow("rotated",rotated)

#等待显示
cv2.waitKey(0)
cv2.destroyAllWindows()
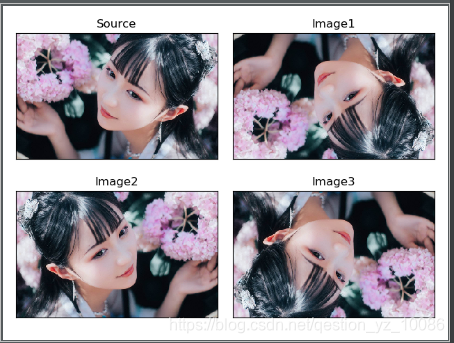
4.图像翻转
import cv2
import numpy as np
import matplotlib.pyplot as plt
import os
#读取图片
path=os.getcwd()
img_path=path+'\\'+'code.png'
img=cv2.imread(img_path)
img=cv2.resize(img,None,fx=0.2,fy=0.2)
src=cv2.cvtColor(img,cv2.COLOR_BGR2RGB)
#图像翻转
img1=cv2.flip(src,0)
img2=cv2.flip(src,1)
img3=cv2.flip(src,-1)
#获得高,宽,以及通道数
rows,cols,channel=img.shape

#显示图形
titles=['Source','Image1','Image2','Image3']
images=[src,img1,img2,img3]
for i in range(4):
    plt.subplot(2,2,i+1),plt.imshow(images[i],'gray')
    plt.title(titles[i])
    plt.xticks([]),plt.yticks([])
plt.show()
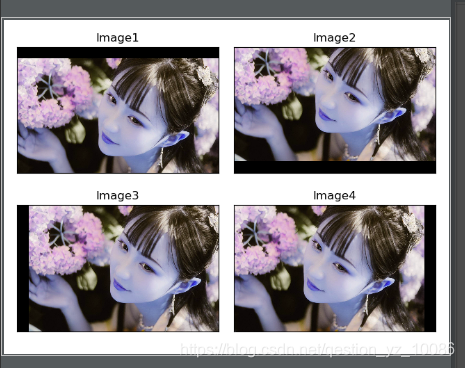
5.图像平移
import cv2
import numpy as np
import matplotlib.pyplot as plt
import os
path=os.getcwd()
img_path=path+'\\'+'code.png'
img=cv2.imread(img_path)
#获得高,宽,以及通道数
rows,cols,channel=img.shape

#图像平移下上右左平移
M=np.float32([[1,0,0],[0,1,100]])
img1=cv2.warpAffine(img,M,(img.shape[1],img.shape[0]))

M=np.float32([[1,0,0],[0,1,-100]])
img2=cv2.warpAffine(img,M,(img.shape[1],img.shape[0]))

M=np.float32([[1,0,100],[0,1,0]])
img3=cv2.warpAffine(img,M,(img.shape[1],img.shape[0]))

M=np.float32([[1,0,-100],[0,1,0]])
img4=cv2.warpAffine(img,M,(img.shape[1],img.shape[0]))

#显示图片
titles=['Image1','Image2','Image3','Image4']
images=[img1,img2,img3,img4]

for i in range(4):
    plt.subplot(2,2,i+1)
    plt.imshow(images[i],'gray')
    plt.title(titles[i])
    plt.xticks([])
    plt.yticks([])

plt.show()