<!DOCTYPE html>
<html lang="en">
<head>
<meta charset="utf-8">
<meta http-equiv="X-UA-Compatible" content="IE=edge">
<meta name="viewport" content="width=device-width, initial-scale=1">
<title>空气质量</title>
<link rel="stylesheet" href="http://v3.bootcss.com/dist/css/bootstrap.min.css">
<script src="https://cdn.bootcss.com/jquery/1.12.4/jquery.min.js"></script>
<script src="http://echarts.baidu.com/dist/echarts.min.js"></script>
</head>
<body>
<!--正文-->
<div class="container-fluid">
<div class="title">
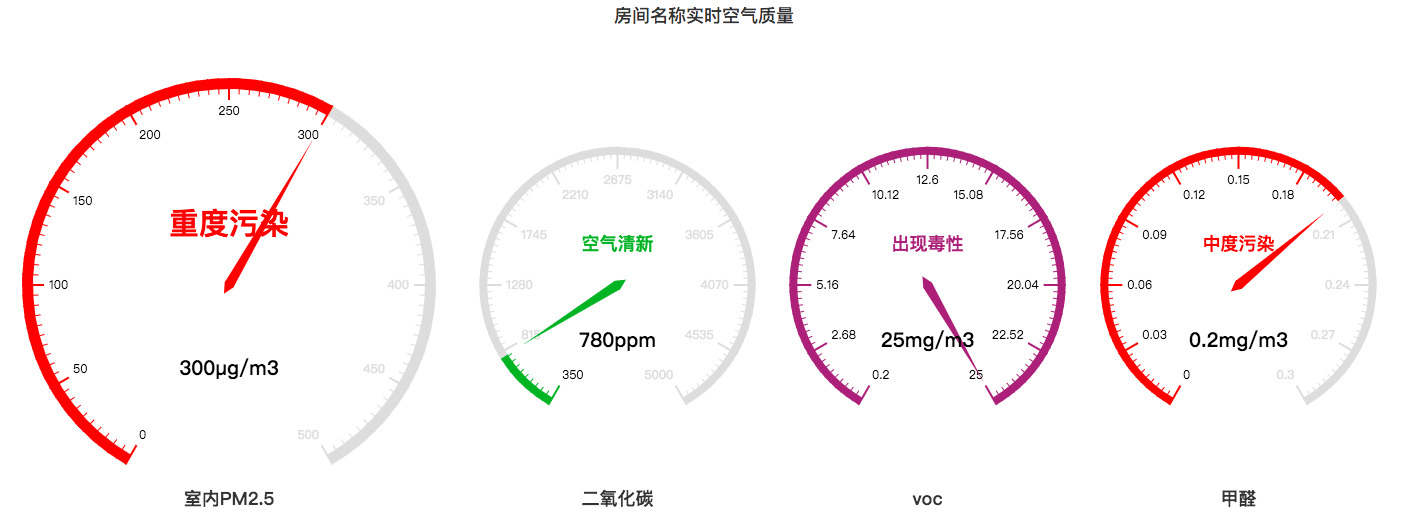
<h4 class="text-center">房间名称实时空气质量</h4>
</div>
<div class="gaugelabel">
<div class="gaugbox pull-left" style="width: 33%;">
<a href="#">
<div class="pull-left" id="pm" style="width: 100%;height: 500px"></div>
</a>
</div>
<div class="gaugbox pull-left" style="width: 22%">
<a href="#">
<div class="pull-left" id="co2" style="width: 100%;height: 500px"></div>
</a>
</div>
<div class="gaugbox pull-left" style="width: 22%">
<a href="#">
<div class="pull-left" id="voc" style="width: 100%;height: 500px"></div>
</a>
</div>
<div class="gaugbox pull-left" style="width: 22%">
<a href="#">
<div class="pull-left" id="jqz" style="width: 100%;height: 500px"></div>
</a>
</div>
</div>
</div>
</body>
<script>
$(document).ready(function() {
gaugeimg('pm', '室内PM2.5', 0, 500, 300, 'μg/m3');
gaugeimg('co2', '二氧化碳', 350, 5000, 780, 'ppm');
gaugeimg('voc', 'voc', 0.2, 25, 25, 'mg/m3');
gaugeimg('jqz', '甲醛', 0, 0.30, 0.2, 'mg/m3');
/*
*id:id;
*title:仪表盘名称
*min:最小值
*max:最大值
*val:当前实际值
*unit:单位符号
*/
function gaugeimg(id, title, min, max, val, unit) {
var myChart = echarts.init(document.getElementById(id)); //初始化
option = {
title: {
text: title,
x: 'center',
y: '90%'
},
tooltip: {
formatter: "{a} <br/>{b} : {c}" + unit
},
toolbox: {
show: false,
feature: {
mark: {
show: true
},
restore: {
show: true
},
saveAsImage: {
show: true
}
}
},
series: [{
center: ['50%', '50%'],
number: [0, '50%'],
startAngle: 240, //仪表盘起始角度
endAngle: -60, //仪表盘结束角度
//min: min,
//max: max,
splitNumber: 10, //分割段数
name: title,
type: 'gauge',
radius: '90%',
splitNumber: 10, // 分割段数,默认为5
axisLine: { // 坐标轴线
lineStyle: { // 属性lineStyle控制线条样式
color: [
[0.25, '#ddd'],
[1, '#ddd']
],
width: 8
}
},
axisTick: { // 坐标轴小标记
splitNumber: 10, // 每份split细分多少段
length: 12, // 属性length控制线长
lineStyle: { // 属性lineStyle控制线条样式
color: 'auto'
}
},
axisLabel: { // 坐标轴文本标签,详见axis.axisLabel
textStyle: { // 其余属性默认使用全局文本样式,详见TEXTSTYLE
color: 'auto'
}
},
splitLine: { // 分隔线
show: true, // 默认显示,属性show控制显示与否
length: 22, // 属性length控制线长
lineStyle: { // 属性lineStyle(详见lineStyle)控制线条样式
color: 'auto'
}
},
pointer: { //指针粗细
width: 5
},
title: {
textStyle: { // 其余属性默认使用全局文本样式,详见TEXTSTYLE
fontWeight: 'bolder'
},
"show": true,
"offsetCenter": [0, "-30%"],
"padding": [5, 10],
"fontSize": 18,
//"color": "auto",
},
detail: {
formatter: '{value}' + unit,
textStyle: { // 其余属性默认使用全局文本样式,详见TEXTSTYLE
color: 'auto',
fontWeight: 'bolder',
"fontSize": 20
}
},
data: [{
//value: val,
//name: name
}]
}]
};
option.series[0].min = min;
option.series[0].max = max;
option.series[0].data[0].value = val;
option.series[0].axisLine.lineStyle.color[0][0] = (val - min) / (max - min);
option.series[0].axisLine.lineStyle.color[0][1] = detectionData(val, id);
myChart.setOption(option);
}
/*
*颜色设置,
*/
function detectionData(str, id) {
if (id == 'pm') { //空气颜色设置
var color = new echarts.graphic.LinearGradient(0, 0, 1, 1, [{
offset: 0,
color: '#56b7ef'
}, {
offset: 1,
color: '#56b7ef'
}]);
option.series[0].data[0].name = '优';
if (str >= 51 && str <= 100) {
color = new echarts.graphic.LinearGradient(0, 0, 1, 1, [{
offset: 0,
color: '#00ab35'
}, {
offset: 1,
color: '#00ab35'
}]);
option.series[0].data[0].name = '良';
}
if (str >= 101 && str <= 150) {
color = new echarts.graphic.LinearGradient(0, 0, 1, 1, [{
offset: 0,
color: '#98c100'
}, {
offset: 1,
color: '#98c100'
}]);
option.series[0].data[0].name = '轻度污染';
}
if (str >= 151 && str <= 200) {
color = new echarts.graphic.LinearGradient(0, 0, 1, 1, [{
offset: 0,
color: '#f49c00'
}, {
offset: 1,
color: '#f49c00'
}]);
option.series[0].data[0].name = '中度污染';
}
if (str >= 201 && str <= 300) {
color = new echarts.graphic.LinearGradient(0, 0, 1, 1, [{
offset: 0,
color: '#fd2c00'
}, {
offset: 1,
color: '#fd2c00'
}]);
option.series[0].data[0].name = '重度污染';
} else if (str > 300) {
color = new echarts.graphic.LinearGradient(0, 0, 1, 1, [{
offset: 0,
color: '#9d3f7e'
}, {
offset: 1,
color: '#9d3f7e'
}]);
option.series[0].data[0].name = '严重污染';
}
option.series[0].axisLine.lineStyle.width = '11'; //重置仪表盘轴线宽度
option.series[0].axisTick.length = '16'; //重置仪表盘刻度线长度
option.series[0].title.color = color.colorStops[1].color; //字体颜色和轴线颜色一致
option.series[0].title.fontSize = 30; //第一个字体变大
return color;
}
if (id == 'co2') { //二氧化碳颜色设置
var color = new echarts.graphic.LinearGradient(0, 0, 1, 1, [{
offset: 0,
color: '#56b7ef'
}, {
offset: 1,
color: '#56b7ef'
}]);
option.series[0].data[0].name = '同一般室外环境';
if (str >= 450 && str <= 1000) {
color = new echarts.graphic.LinearGradient(0, 0, 1, 1, [{
offset: 0,
color: '#00ab35'
}, {
offset: 1,
color: '#00ab35'
}]);
option.series[0].data[0].name = '空气清新';
}
if (str >= 1001 && str <= 2000) {
color = new echarts.graphic.LinearGradient(0, 0, 1, 1, [{
offset: 0,
color: '#f49c00'
}, {
offset: 1,
color: '#f49c00'
}]);
option.series[0].data[0].name = '空气混浊';
}
if (str >= 2001 && str <= 5000) {
color = new echarts.graphic.LinearGradient(0, 0, 1, 1, [{
offset: 0,
color: '#fd2c00'
}, {
offset: 1,
color: '#fd2c00'
}]);
option.series[0].data[0].name = '头痛、轻度恶心';
} else if (str > 5000) {
color = new echarts.graphic.LinearGradient(0, 0, 1, 1, [{
offset: 0,
color: '#9f3979'
}, {
offset: 1,
color: '#9f3979'
}]);
option.series[0].data[0].name = '严重缺氧';
}
option.series[0].title.color = color.colorStops[1].color; //字体颜色和轴线颜色一致
return color;
}
if (id == 'voc') { //voc颜色
var color = new echarts.graphic.LinearGradient(0, 0, 1, 1, [{
offset: 0,
color: '#56b7ef'
}, {
offset: 1,
color: '#56b7ef'
}]);
option.series[0].data[0].name = '无效应水平';
if (str >= 0.3 && str < 3) {
color = new echarts.graphic.LinearGradient(0, 0, 1, 1, [{
offset: 0,
color: '#f49c00'
}, {
offset: 1,
color: '#f49c00'
}]);
option.series[0].data[0].name = '感到不舒服';
} else if (str >= 25) {
color = new echarts.graphic.LinearGradient(0, 0, 1, 1, [{
offset: 0,
color: '#9f3979'
}, {
offset: 1,
color: '#9f3979'
}]);
option.series[0].data[0].name = '出现毒性';
}
option.series[0].title.color = color.colorStops[1].color; //字体颜色和轴线颜色一致
return color;
}
if (id == 'jqz') { //甲醛颜色设置
var color = new echarts.graphic.LinearGradient(0, 0, 1, 1, [{
offset: 0,
color: '#56b7ef'
}, {
offset: 1,
color: '#56b7ef'
}]);
option.series[0].data[0].name = '正常';
if (str >= 0.10 && str <= 0.20) {
color = new echarts.graphic.LinearGradient(0, 0, 1, 1, [{
offset: 0,
color: '#00ab35'
}, {
offset: 1,
color: '#00ab35'
}]);
option.series[0].data[0].name = '轻度污染';
}
if (str >= 0.20 && str <= 0.30) {
color = new echarts.graphic.LinearGradient(0, 0, 1, 1, [{
offset: 0,
color: '#fd2c00'
}, {
offset: 1,
color: '#fd2c00'
}]);
option.series[0].data[0].name = '中度污染';
} else if (str > 0.30) {
color = new echarts.graphic.LinearGradient(0, 0, 1, 1, [{
offset: 0,
color: '#9f3979'
}, {
offset: 1,
color: '#9f3979'
}]);
option.series[0].data[0].name = '重度污染';
}
option.series[0].title.color = color.colorStops[1].color; //字体颜色和轴线颜色一致
return color;
}
}
})
</script>
</html>
1.要想使仪表盘颜色全部一样,设置
option.series[0].axisLine.lineStyle.color[0][0] =100;