代码:
<html>
<head>
<title>图表绘制</title>
<style type="text/css">
#dashboard {
width: 402px;
height: 293px;
margin: 50px auto;
}
</style>
</head>
<body>
<!-- 为ECharts准备一个具备大小(宽高)的Dom -->
<div id="dashboard"></div>
<script src="https://cdn.bootcdn.net/ajax/libs/echarts/5.0.1/echarts.js"></script>
<!-- <script src="https://cdn.bootcdn.net/ajax/libs/echarts/4.8.0/echarts-en.common.js"></script> -->
<script type="text/javascript">
const numericalData = [-3, -2.15, -1.29, -0.5, 0.3, 1.28, 2.14, 3]
const standard = ['1', '2', '3', '4', '5', '6', '7']
const realData = 0.7
const fakeData = 0.1
const colorTemplate1 = [
[0.142, '#83c970'],[0.284, '#c93600'],[0.426, '#0a5dc9'],
[0.568, '#c3c900'],[0.710, '#c900ab'],[0.852, '#0cc902'],[1, '#340ec9']
]
var myChart3 = echarts.init(document.getElementById('dashboard'));
var option3 = {
series: [
{
z: 0,
type: 'pie',
radius: '80%',
startAngle: 0,
hoverAnimation: false,
clockWise: false,
itemStyle: {
normal: {
color: new echarts.graphic.RadialGradient(0.5, 1, 1, [
{
offset: 0.5,
color: 'rgba(255,255,255,1)',
}, {
offset: 1,
color: 'rgba(33,150,243,0.01)'
}])
}
},
label: {
show: false
},
data: [{
value: 0.5
}, {
value: 0.5,
itemStyle: {
color: 'rgba(0,0,0,0)'
}
}]
},
{
type: 'gauge',
radius: '80%',
min: -3,
max: 3,
startAngle: 180,
endAngle: 0,
splitNumber: 6,
axisLine: {
roundCap: true,
lineStyle: {
width: 6,
color: colorTemplate1
}
},
splitLine:{
show:false},
axisTick: {
show: false},
pointer: {
icon: 'path://M2.9,0.7L2.9,0.7c1.4,0,2.6,1.2,2.6,2.6v115c0,1.4-1.2,2.6-2.6,2.6l0,0c-1.4,0-2.6-1.2-2.6-2.6V3.3C0.3,1.9,1.4,0.7,2.9,0.7z',
width: 3,
length: '80%',
offsetCenter: [0, '-10%'],
itemStyle: {
color: '#000'
}
},
anchor: {
show: true,
showAbove: true,
size: 6,
itemStyle: {
borderWidth: 2,
borderColor: '#000'
}
},
axisLabel: {
show: false,
distance: -20,
color: '#666',
fontSize: 12,
formatter: (val) => {
val = Number(val)
for (let i = 0; i < numericalData.length; i++) {
if (val > numericalData[i] && val <= numericalData[i + 1]) {
return standard[i]
}
if (val === numericalData[0]) {
return standard[0]
}
}
}
},
detail: {
fontSize: 14,
offsetCenter: [0, '30%'],
valueAnimation: true,
formatter: function (value) {
return "标题:"+ Math.round(value * 100) + '%';
},
color: '#333'
},
data: [{
value: 0.70
}]
},{
type: 'gauge',
radius: '98%',
min: -3,
max: 3,
detail: {
show: false},
startAngle: 170,
endAngle: 10,
splitNumber: 6,
data: [fakeData],
axisLine: {
show: false
},
splitLine:{
show:false
},
axisTick: {
show: false},
axisLabel: {
show: true,
distance: -20,
color: '#666',
fontSize: 12,
formatter: (val) => {
val = Number(val)
for (let i = 0; i < numericalData.length; i++) {
if (val > numericalData[i] && val <= numericalData[i + 1]) {
return standard[i]
}
if (val === numericalData[0]) {
return standard[0]
}
}
}
},
pointer: {
show: false}
}]
};
myChart3.setOption(option3);
</script>
</body>
</html>
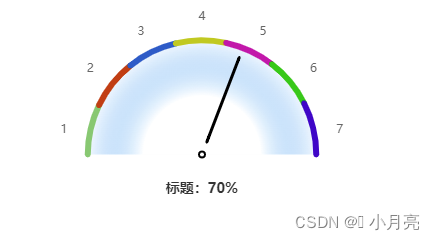
效果图: