pandas学习(两种数据结构DataFrame & Series)
DataFrame(类似numpy的二维数组,是一种带标签的二维对象)
有行索引&列索引(默认从0开始,可根据索引选值)
1. 创建方式:
- 从另一个DataFrame创建
- 从具有二维形状的Numpy数组(或类似的嵌套字典啦字典列表啦)来创建
- 从另一类数据结构Series来创建
从类似CSV文件来创建
获取所使用的红酒数据,注意分隔符是分号
import numpy as np
import pandas as pd
arr=np.array(np.arange(12)).reshape(4,3)
arr
array([[ 0,  1,  2],
       [ 3,  4,  5],
       [ 6,  7,  8],
       [ 9, 10, 11]])
df=pd.DataFrame(arr)

#pd.DataFrame(np.arange(12).reshape(4,3),index=['x1','x2','x3','x4'],columns=['y1','y2','y3'])
#如上index参数可以指定行索引(标签),columns指定列索引

df
   0   1   2
0  0   1   2
1  3   4   5
2  6   7   8
3  9  10  11
type(df)
<class 'pandas.core.frame.DataFrame'>
这里有一个地方要注意,如何描述Numpy数组的坐标
arr1=np.arange(6)
#arr1[0]
#0
df1=pd.DataFrame(arr1)
df1
   0
0  0
1  1
2  2
3  3
4  4
5  5
这里是通过字典创建
dic={'a':[1,2,3],'b':[4,5,6],'c':[7,8,9]}
type(dic)
<class 'dict'>
df1=pd.DataFrame(dic)
df1
   a  b  c
0  1  4  7
1  2  5  8
2  3  6  9
#嵌套字典创建,NAN是空缺值
dic1={'000':{'a':1,'b':2,'c':3},'001':{'d':4,'e':5,'f':6}}
df2=pd.DataFrame(dic1)
df2
   000  001
a  1.0  NaN
b  2.0  NaN
c  3.0  NaN
d  NaN  4.0
e  NaN  5.0
f  NaN  6.0
通过csv文件创建
from pandas.io.parsers import read_csv

df3=read_csv('Python_processing\\data\\winequality.csv',delimiter=';')
type(df3)
<class 'pandas.core.frame.DataFrame'>
df3
      fixed acidity  volatile acidity  citric acid  residual sugar  chlorides
0               7.4             0.700         0.00             1.9      0.076
1               7.8             0.880         0.00             2.6      0.098
2               7.8             0.760         0.04             2.3      0.092
3              11.2             0.280         0.56             1.9      0.075
4               7.4             0.700         0.00             1.9      0.076
5               7.4             0.660         0.00             1.8      0.075
6               7.9             0.600         0.06             1.6      0.069
7               7.3             0.650         0.00             1.2      0.065
8               7.8             0.580         0.02             2.0      0.073
...
#一份红酒相关数据,只截取了其中一部分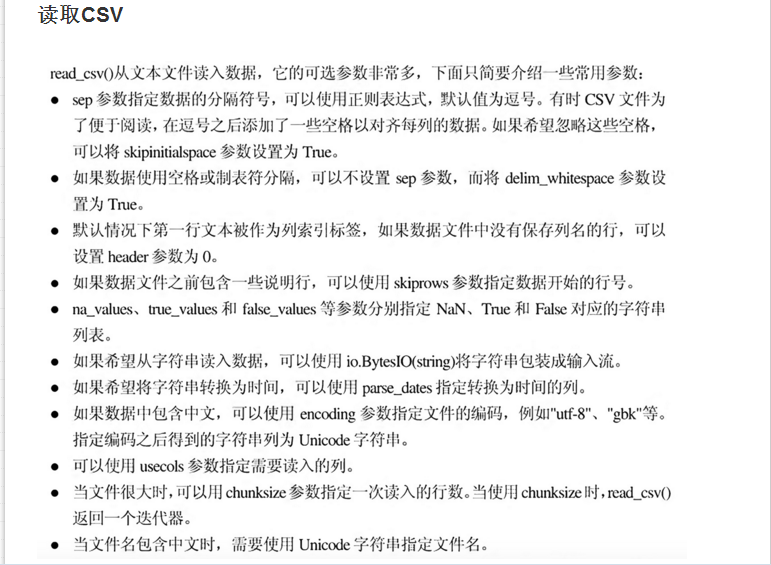
补充一个delimiter参数用于选择分隔符
2. 属性:
- df.shape(型),df.columns(各列的标题,列标签),df.dtypes(各列的数据类型)
df3.columns
Index(['fixed acidity', 'volatile acidity', 'citric acid', 'residual sugar',
       'chlorides', 'free sulfur dioxide', 'total sulfur dioxide', 'density',
       'pH', 'sulphates', 'alcohol', 'quality'],
dtype='object')- len(df)(查询df的行数),df.index((行)索引),df.values(只查看df的值,pandas自身迭代器效率低,不如使用Numpy提取数组的值)
df2.index
Index(['a', 'b', 'c', 'd', 'e', 'f'], dtype='object')
df1.index
RangeIndex(start=0, stop=3, step=1)

df2.values
array([[  1.,  nan],
       [  2.,  nan],
       [  3.,  nan],
       [ nan,   4.],
       [ nan,   5.],
[ nan, 6.]])- 选择DataFrame数据
df
    y1  y2  y3
x1   0   1   2
x2   3   4   5
x3   6   7   8
x4   9  10  11
#选择某列
df['y1']#或df.y1
x1    0
x2    3
x3    6
x4    9
Name: y1, dtype: int32
#选择某行
df[1:3]#或df['x2':'x3']*******这里注意了。选一行的话['x2','x2']
    y1  y2  y3
x2   3   4   5
x3   6   7   8

#根据行标签loc选择(多 :)某行,还可以选择一行的某几列
#注标签名
df.loc['x2']
df.loc['x2':'x3']
df.loc['x1',['y1','y2']] #同理可用来选择某列df.loc[:,['y1':'y2']]
y1    0
y2    1
Name: x1, dtype: int32

#根据标签iloc,df.iloc[index,columns],可连续选、跨行选
#注索引
df.iloc[0,2]
2
df.iloc[0]
y1    0
y2    1
y3    2
Name: x1, dtype: int32
df.iloc[1:3,0:2]
    y1  y2
x2   3   4
x3   6   7
df.iloc[[0,2],1:3]
    y2  y3
x1   1   2
x3   7   8

#通过ix标签,和上面相似
df.ix[0:2,['y1','y3']]
    y1  y3
x1   0   2
x2   3   5
#at和iat分别使用标签和索引下标获取单个值
df.at['x1','y1']
df.iat[0,0]
#通过布尔索引,判断真值
df.y1>1
x1    False
x2     True
x3     True
x4     True
Name: y1, dtype: bool
df[df.y1>1]- 对DataFrame元素修改
df=pd.DataFrame(np.arange(12).reshape(4,3),index=['x1','x2','x3','x4'],columns=['y1','y2','y3'])
df
    y1  y2  y3
x1   0   1   2
x2   3   4   5
x3   6   7   8
x4   9  10  11

#通过索引或标签确定待修改元素的位置
df.loc['x2','y2']=0
df.iloc[2,2]=0
df.iloc[3]=0#或df.loc['x4']=0
df
    y1  y2  y3
x1   0   1   2
x2   3   0   5
x3   6   7   0
x4   0   0   0

#添加列
df['y4']=np.nan #赋一维数组即可
df
    y1  y2  y3  y4
x1   0   1   2 NaN
x2   3   0   5 NaN
x3   6   7   0 NaN
x4   0   0   0 NaN
#也可以添加Series序列,**长度要对齐,不齐以NAN补缺,超出自动去掉**
df['y5']=pd.Series([1,2,3,4],index=['x1','x2','x3','x4'])3.利用DataFrame进行统计计算
- 数据集:装上数据获取的库,如 Tushare(http://pythonhosted.org/tushare/
),Quandl(https://www.quandl.com/tools/python
)每天最多能调用50次等。网上还有很多可供分析的免费数据集(http://www.kdnuggets.com/datasets/index.html )。
可以看下这篇文章Python数据分析及可视化的基本环境
#Tushare是股票相关数据
pip install tushare,Quandl
#获取太阳黑子的数据
import quandl
df = quandl.get('SIDC/SUNSPOTS_A')- isnull和notnull用来检测数据丢失
- fillna()方法用标量值替换空缺值,如df.fillna(0),用0替代NaN
- describe()统计描述函数,生成描述性统计,总结数据集分布的中心趋势,分散和形状,不包括NaN值,结果的索引将包括计数,平均值(mean),标准差(std),最小值,最大值以及百分位数(默认25、50、75)
CSDN的pandas.DataFrame.describe
df2.describe()
       000  001
count  3.0  3.0
mean   2.0  5.0
std    1.0  1.0
min    1.0  4.0
25%    1.5  4.5
50%    2.0  5.0
75%    2.5  5.5
max 3.0 6.0- count()返回非NAN数据项数量
- min(),max()
- median()返回中位数,等价第50位百分位数的值
- mad()计算平均绝对偏差(描述数据离散程度)
- mode()返回数据的众值
- std()返回数据的标准差(描述离散度)
- var()返回方差
- skew()偏态系数(skewness,表示数据分布的对称程度)
- kurt()峰态系数(kurtosis,反映数据分布曲线顶端尖峭或扁平程度)
df3['quality'].mad()
0.68317792428898461
df3['quality'].mode()
0    5  #注意5才是number值
dtype: int64
df3['pH'].std()
0.15438646490354277
df3['pH'].var()
0.023835180545412844
df3['pH'].skew()
0.19368349811284427
df3['pH'].kurt()
0.80694250824657399
Series(由不同类型元素所组成的一维数组)
由index(标签信息也称索引,可选,默认从0始)和values(Numpy数组)组成
- 创建方式:
- 由Numpy数组创建
- 由字典创建(键会经过排序后成为索引)
- 查询DataFrame的一列会返回一个Series
type(df.y1)
<class 'pandas.core.series.Series'>
s=pd.Series({'a':[1,2],'c':'abc','b':1.2})#键值可排序时才能排序
s
a    [1, 2]
b       1.2
c       abc
dtype: object- 属性
Series共享DataFrame的属性,同时多了一个name属性(df的columns)
s.values
array([list([1, 2]), 1.2, 'abc'], dtype=object)
s.index
Index(['a', 'b', 'c'], dtype='object')
s.name='test'
s
a    [1, 2]
b       1.2
c       abc
Name: test, dtype: object
切片 (可通过索引或标签切片)
可通过索引或标签访问- 索引切片不包含结束位置
- 标签切片包含结束标签
s[0:2]
a    [1, 2]
b       1.2
Name: test, dtype: object
s['a':'c']
a    [1, 2]
b       1.2
c       abc
Name: test, dtype: object