echart使用实例

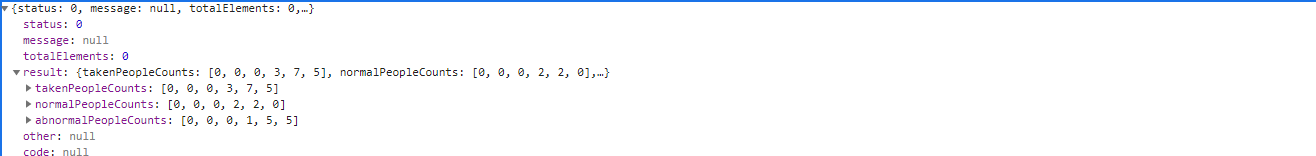
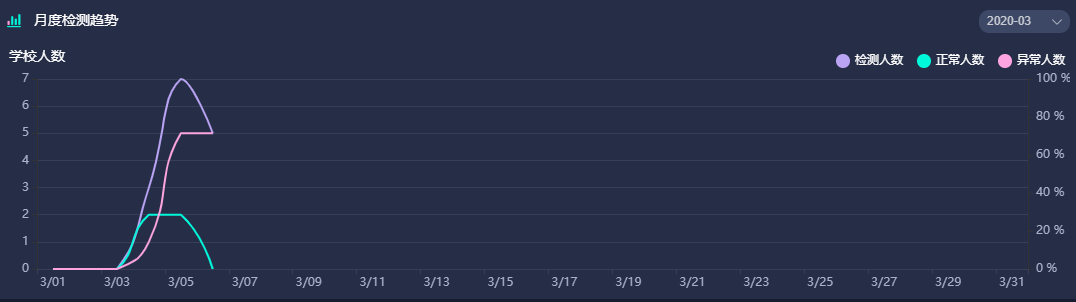
echart配置参数:res为后台返回值,datArr为日期数组[2/01,2/02.....2/28]

    function opt(res,dayArr) {
        return option = {
            tooltip: {},
            legend: {
                data:['检测人数','正常人数','异常人数'],
                textStyle:{
                    color:'#fff'
                },
                right:0,
                icon: "circle",
                itemWidth: 14,
                itemHeight: 14,
                itemGap: 14
            },
            grid:{
                left:30,
                right:42,
                top:30,
                bottom:30,
            },
            xAxis: {
                data: dayArr,
                axisLabel:{
                    textStyle:{
                        color:'#ACB2CC',
                        fontSize:'10px'
                    }
                },
                axisLine:{
                    lineStyle:{
                        color:'#383E55'
                    }
                }
            },
            yAxis: [{
                type: 'value',
                name:'学校人数',
                minInterval: 1,
                axisLabel:{
                    textStyle:{
                        color:"#ACB2CC"
                    }
                },
                nameTextStyle:{
                    color:"#FFFFFF",
                    fontSize:14,
                },
                splitLine:{
                    lineStyle:{
                        color:"#383E55"
                    }
                }
            },{
                type: 'value',
                name: '',
                min: 0,
                max: 100,
                interval: 20,
                axisLabel: {
                    formatter: '{value} %',
                    textStyle:{
                        color:"#ACB2CC"
                    }
                },
                nameTextStyle:{
                    color:"#FFFFFF",
                    fontSize:14,
                },
                splitLine:{
                    show:false
                }
            }],
            series: [{
                name: '检测人数',
                type: 'line',
                data: res.result.takenPeopleCounts,
                itemStyle:{
                    color:'#B9A4F4'
                },
                smooth: true,
                showSymbol: false,
                },{
                    name: '正常人数',
                    type: 'line',
                    data: res.result.normalPeopleCounts,
                    itemStyle:{
                        color:'#01F8DB'
                    },
                    smooth: true,
                    showSymbol: false,
                },{
                    name: '异常人数',
                    type: 'line',
                    data: res.result.abnormalPeopleCounts,
                    itemStyle:{
                        color:'#FEA5E1'
                    },
                    smooth: true,
                    showSymbol: false,
                }
            ]
        };
    }

猜你喜欢

转载自www.cnblogs.com/wscw/p/12428028.html
今日推荐