来自Bitly的USA.gov数据
0 读取文本文件(JSON格式)
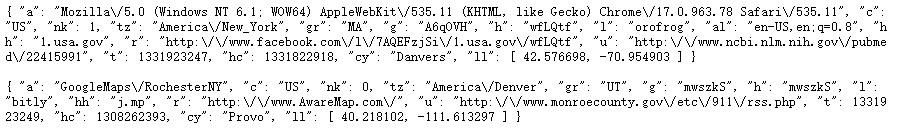
读取文件中第一行
path = 'pydata-book/datasets/bitly_usagov/example.txt'
open(path).readline() # 文件第一行

上下文管理器with
with open(path) as file:
    print(file.readline())
    print(file.readline())
import json
path = 'pydata-book/datasets/bitly_usagov/example.txt'
records = [json.loads(line) for line in open(path)]
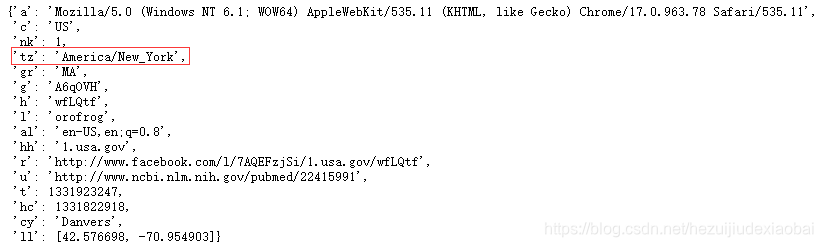
records[0]
1 用纯Python对时区进行计数
‘tz’: ‘America/New_York’ 时区 (time zone)
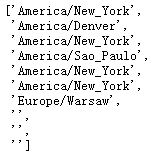
time_zones = [rec['tz'] for rec in records]
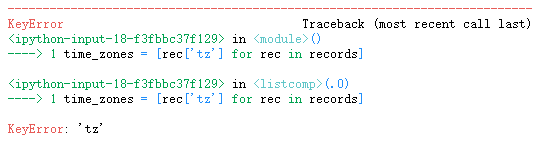
!!!不是所有记录都有时区字段
time_zones = [rec['tz'] for rec in records if 'tz' in rec] # 判别式
time_zones[:10]
遍历时区,将计数值保存在字典数据中 (count, time_zone)
def get_counts(sequence):
    counts = {} # 字典
    for x in sequence:
        if x in counts:
            counts[x] += 1
        else:
            counts[x] = 1
    return counts
将time_zones传入函数,并查看’America/New_York’的数量
counts = get_counts(time_zones)
counts['America/New_York']

collections.dedefaultdict
from collections import defaultdict

def get_counts2(sequence):
    counts = defaultdict(int) # 初始化为0
    for x in sequence:
        counts[x] += 1
    return counts

get_counts2(time_zones)['America/New_York']

len(time_zones)

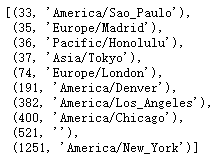
得到前10位时区及其计数值
def top10_counts(count_dict, n=10):
    value_key_pairs = [(count, tz) for tz, count in count_dict.items()]
    value_key_pairs.sort()
    return value_key_pairs[-n:]

top10_counts(counts)
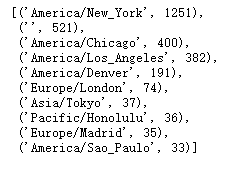
collections.Counter
from collections import Counter

counts = Counter(time_zones)
counts.most_common(10)
2 用Pandas对时区进行计数
创建DataFrame
import pandas as pd

frame = pd.DataFrame(records)
frame.info()
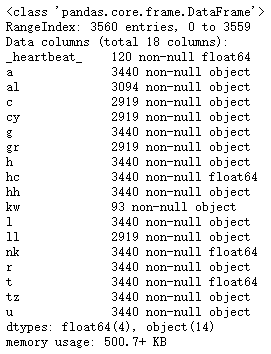
摘要视图(summary view)
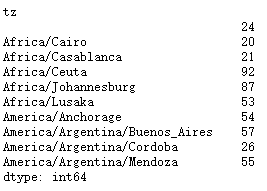
frame['tz'][:10]
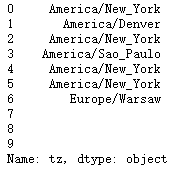
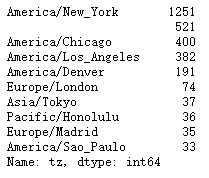
pd.Series.value_counts
tz_counts = frame['tz'].value_counts()
tz_counts[:10]
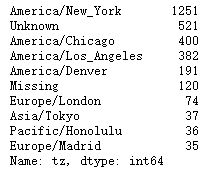
pd.Series.fillna
clean_tz = frame['tz'].fillna('Missing') # 替换缺失值(NA) -> 未知值(空字符串)则可以通过布尔型数组索引加以替换
clean_tz[clean_tz == ''] = 'Unknown'
tz_counts = clean_tz.value_counts()
tz_counts[:10]
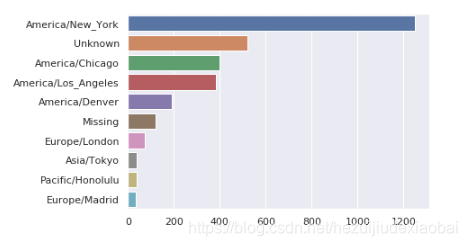
sns.barplot
import seaborn as sns

subset = tz_counts[:10]
sns.barplot(subset.values, subset.index)
‘a’ - 执行URL短缩操作的浏览器、设备、应用程序的相关信息 agent
User-Agent
用户代理
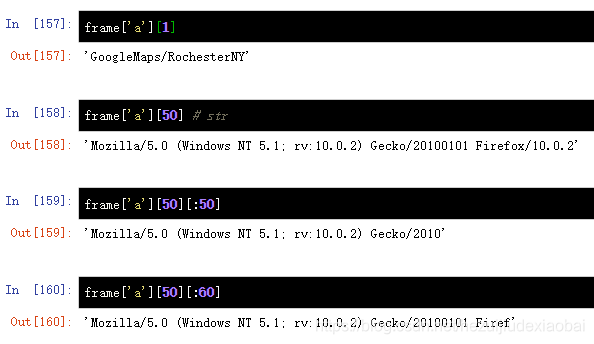
pd.Series.dropna
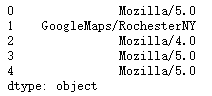
results = pd.Series([x.split()[0] for x in frame.a.dropna()])
results[:5]
results.value_counts()[:5]

按’Windows’ | ‘Not Windows’ 用户对时区统计信息进行分解(是否含’Windows’)
删除缺失值
pd.Series.notnull
cframe = frame[frame.a.notnull()]
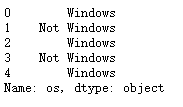
计算出各行是否含有’Windows’
np.where
str.contains
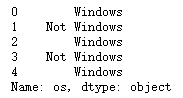
cframe['os'] = np.where(cframe['a'].str.contains('Windows'), 'Windows', 'Not Windows')
cframe['os'][:5]
按照时区 & 新得到的操作系统 列对数据进行分组
pd.Series.groupby # 分组
pd.Series.unstack # 透视索引标签
pd.Series.fillna # 填充缺失值
by_tz_os = cframe.groupby(['tz', 'os'])
agg_counts = by_tz_os.size().unstack().fillna(0)
agg_counts[:10]

根据agg_counts中的行数构造一个间接索引数组
pd.Series.sum
pd.Series.argsort
indexer = agg_counts.sum(1).argsort()
indexer[:10]
按照indexer截取最后10行最大值
pd.Series.take
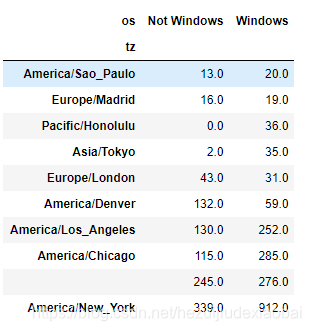
count_subset = agg_counts.take(indexer[-10:])
count_subset
pd.Series.nlargest #
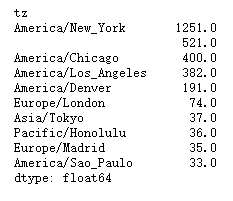
agg_counts.sum(1).nlargest(10)
pd.DataFrame.stack # 透视列标签
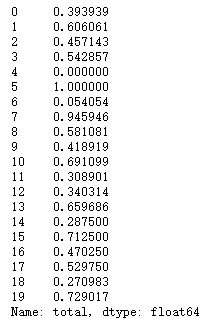
count_subset
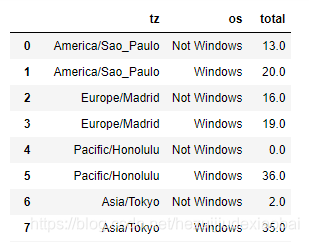
count_subset.stack()
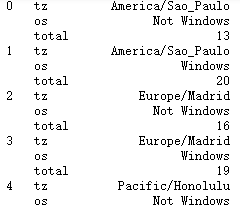
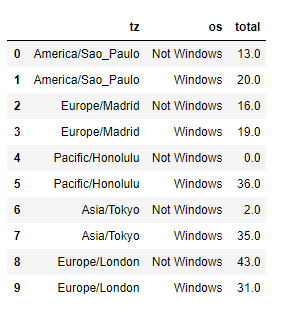
count_subset = count_subset.stack()
count_subset.name = 'total'
count_subset = count_subset.reset_index()
count_subset[:10]
sns.barplot #堆积条形图
sns.barplot(x='total', y='tz', hue='os', data=count_subset)
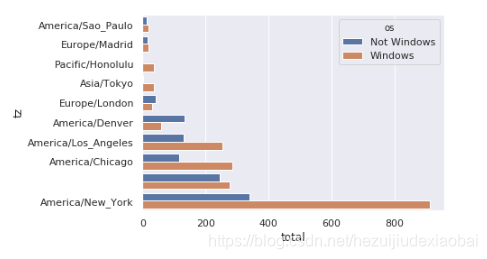
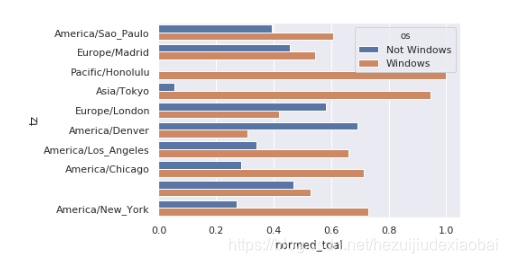
不易看出Windows用户在小分组中的相对比例,因此标椎化分组百分比之和为1
pd.Series.sum # 合计
pd.Series.apply # 应用函数
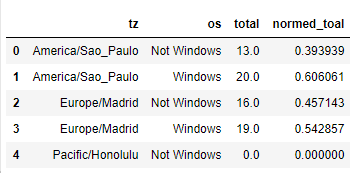
def norm_total(group):
    group['normed_toal'] = group.total / group.total.sum()
    return group

results = count_subset.groupby('tz').apply(norm_total)

results.head()
sns.barplot(x=‘normed_toal’, y=‘tz’, hue=‘os’, data=results)
pd.Series.transform # 高效计算标椎化的和
g = count_subset.groupby('tz')
results = count_subset.total / g.total.transform('sum')
results