-
读取数据
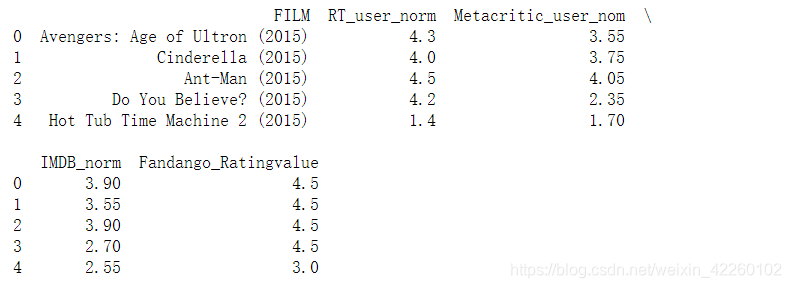
import pandas as pd
import matplotlib.pyplot as plt
reviews = pd.read_csv('fandango_scores.csv')
cols = ['FILM', 'RT_user_norm', 'Metacritic_user_nom', 'IMDB_norm', 'Fandango_Ratingvalue']
norm_reviews = reviews[cols]
print(norm_reviews[:5])
运行结果:
-
打印每个值对应的数据个数
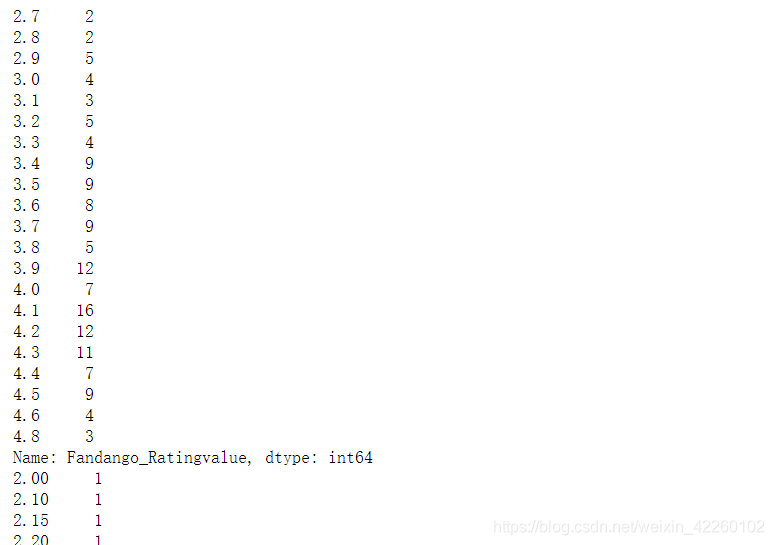
fandango_distribution = norm_reviews['Fandango_Ratingvalue'].value_counts()
fandango_distribution = fandango_distribution.sort_index()

imdb_distribution = norm_reviews['IMDB_norm'].value_counts()
imdb_distribution = imdb_distribution.sort_index()

print(fandango_distribution)
print(imdb_distribution)
运行结果:
-
数据压缩,不指定默认bins为10
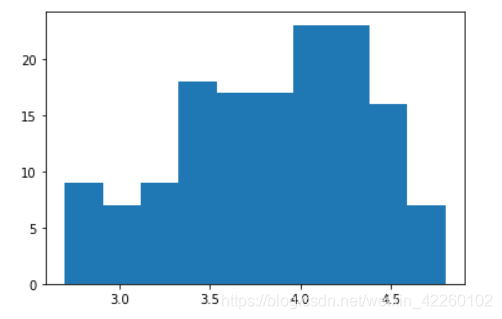
fig, ax = plt.subplots()
ax.hist(norm_reviews['Fandango_Ratingvalue'])
#ax.hist(norm_reviews['Fandango_Ratingvalue'],bins=20)
#ax.hist(norm_reviews['Fandango_Ratingvalue'], range=(4, 5),bins=20)
plt.show()
运行结果:
-
指定个数
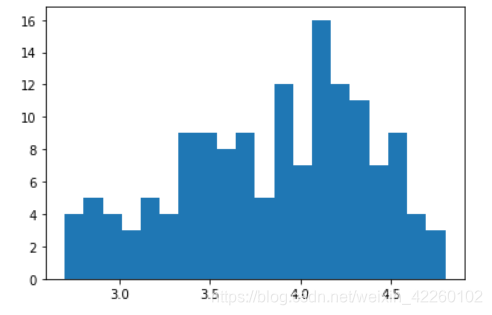
fig, ax = plt.subplots()
#ax.hist(norm_reviews['Fandango_Ratingvalue'])
ax.hist(norm_reviews['Fandango_Ratingvalue'],bins=20)
#ax.hist(norm_reviews['Fandango_Ratingvalue'], range=(4, 5),bins=20)
plt.show()
运行结果:
-
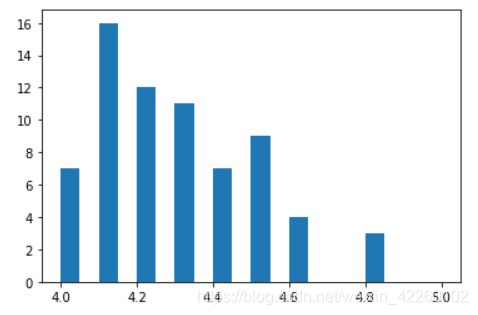
指定区间
fig, ax = plt.subplots()
#ax.hist(norm_reviews['Fandango_Ratingvalue'])
#ax.hist(norm_reviews['Fandango_Ratingvalue'],bins=20)
ax.hist(norm_reviews['Fandango_Ratingvalue'], range=(4, 5),bins=20)
plt.show()
运行结果:
-
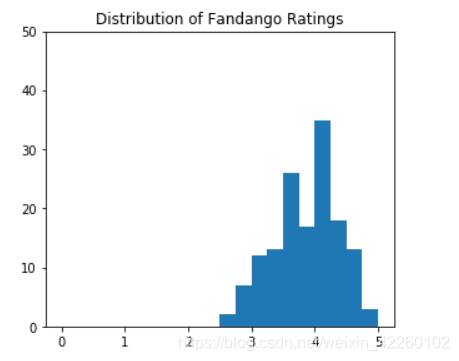
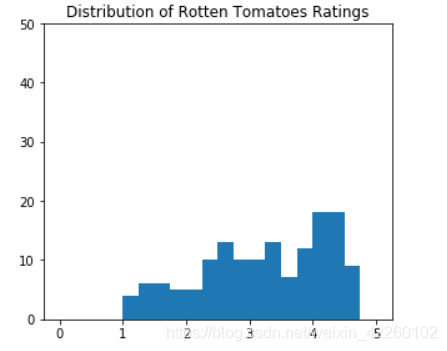
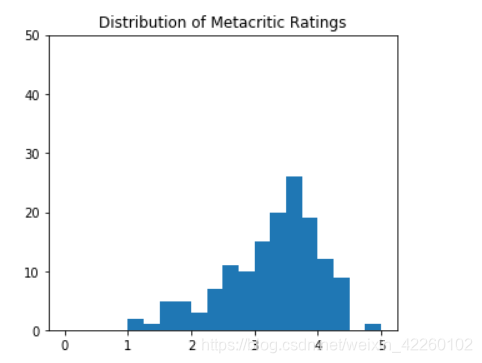
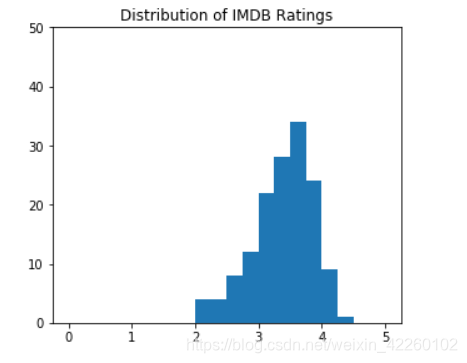
综合应用
扫描二维码关注公众号,回复: 9470748 查看本文章
fig = plt.figure(figsize=(5,20))
ax1 = fig.add_subplot(4,1,1)
ax2 = fig.add_subplot(4,1,2)
ax3 = fig.add_subplot(4,1,3)
ax4 = fig.add_subplot(4,1,4)
ax1.hist(norm_reviews['Fandango_Ratingvalue'], bins=20, range=(0, 5))
ax1.set_title('Distribution of Fandango Ratings')
ax1.set_ylim(0, 50)

ax2.hist(norm_reviews['RT_user_norm'], 20, range=(0, 5))
ax2.set_title('Distribution of Rotten Tomatoes Ratings')
ax2.set_ylim(0, 50)

ax3.hist(norm_reviews['Metacritic_user_nom'], 20, range=(0, 5))
ax3.set_title('Distribution of Metacritic Ratings')
ax3.set_ylim(0, 50)

ax4.hist(norm_reviews['IMDB_norm'], 20, range=(0, 5))
ax4.set_title('Distribution of IMDB Ratings')
ax4.set_ylim(0, 50)

plt.show()
运行结果:
-
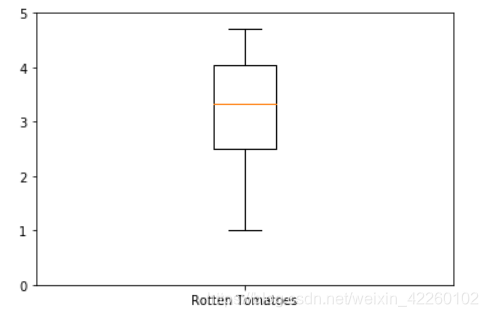
盒图初步
fig, ax = plt.subplots()
ax.boxplot(norm_reviews['RT_user_norm'])
ax.set_xticklabels(['Rotten Tomatoes'])
ax.set_ylim(0, 5)
plt.show()
运行结果:
-
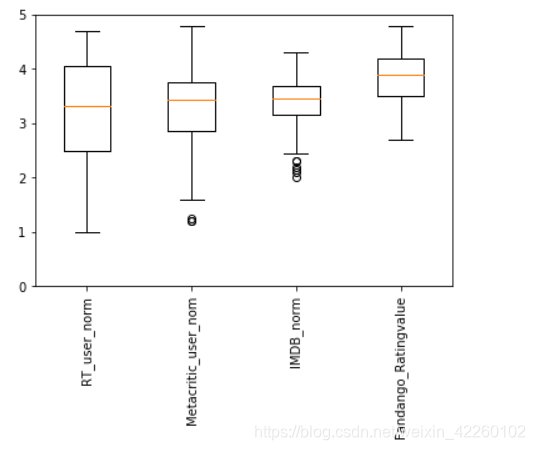
多个列
num_cols = ['RT_user_norm', 'Metacritic_user_nom', 'IMDB_norm', 'Fandango_Ratingvalue']
fig, ax = plt.subplots()
ax.boxplot(norm_reviews[num_cols].values)
ax.set_xticklabels(num_cols, rotation=90)
ax.set_ylim(0,5)
plt.show()
运行结果:
柱形图和盒图

猜你喜欢
转载自blog.csdn.net/weixin_42260102/article/details/103440032
今日推荐
周排行