前言
Matplotlib的可以把很多张图画到一个显示界面,在作对比分析的时候非常有用。
对应的有plt的subplot和figure的add_subplo的方法,参数可以是一个三位数字(例如111),也可以是一个数组(例如[1,1,1]),3个数字分别代表
- 子图总行数
- 子图总列数
- 子图位置
更多详情可以查看:matplotlib文档
下面贴出两种绘子图的方式的代码
方式一:通过plt的subplot
import numpy as np
import pandas as pd
import matplotlib.pyplot as plt
# author: chenqionghe
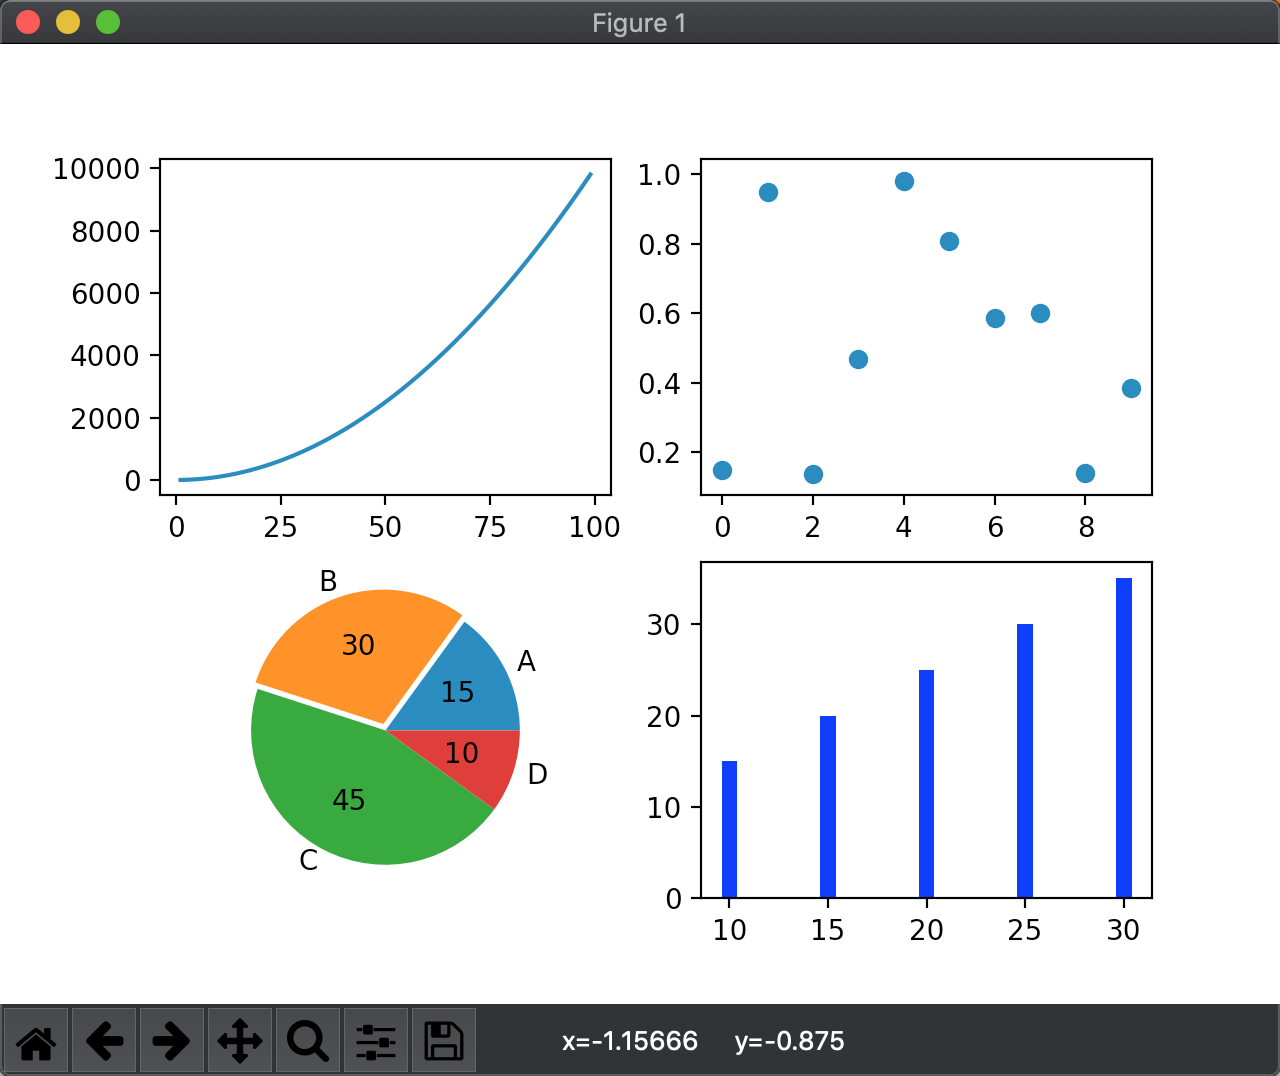
# 画第1个图:折线图
x=np.arange(1,100)
plt.subplot(221)
plt.plot(x,x*x)
# 画第2个图:散点图
plt.subplot(222)
plt.scatter(np.arange(0,10), np.random.rand(10))
# 画第3个图:饼图
plt.subplot(223)
plt.pie(x=[15,30,45,10],labels=list('ABCD'),autopct='%.0f',explode=[0,0.05,0,0])
# 画第4个图:条形图
plt.subplot(224)
plt.bar([20,10,30,25,15],[25,15,35,30,20],color='b')
plt.show()方式二:通过figure对象的add_subplot
import numpy as np
import pandas as pd
import matplotlib.pyplot as plt
# author: chenqionghe

fig=plt.figure()

# 画第1个图:折线图
x=np.arange(1,100)
ax1=fig.add_subplot(221)
ax1.plot(x,x*x)

# 画第2个图:散点图
ax2=fig.add_subplot(222)
ax2.scatter(np.arange(0,10), np.random.rand(10))

# 画第3个图:饼图
ax3=fig.add_subplot(223)
ax3.pie(x=[15,30,45,10],labels=list('ABCD'),autopct='%.0f',explode=[0,0.05,0,0])

# 画第4个图:条形图
ax4=fig.add_subplot(224)
ax4.bar([20,10,30,25,15],[25,15,35,30,20],color='b')
plt.show()
运行结果如下
就是这么简单,