import numpy as np
import matplotlib
matplotlib.use(“TkAgg”)
import matplotlib.pyplot as plt
from mpl_toolkits.mplot3d import Axes3D
import matplotlib.gridspec as gridspec
#method 1:subplot2grid
plt.figure()
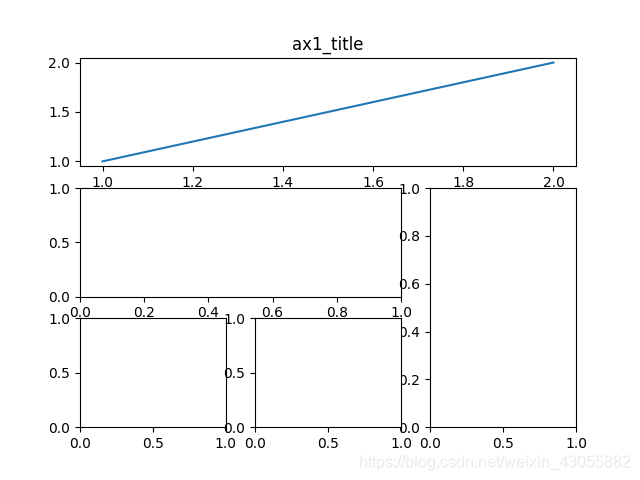
#共计分为3行3列,ax1从(0,0)算起,占据3列1行
ax1=plt.subplot2grid((3,3),(0,0),colspan=3,rowspan=1) #colspan,rowspan默认都为1
ax1.plot([1,2],[1,2])
#如果是整体设置title,直接用plt.title(),单个子图设置,则用ax1.set_title样子的
ax1.set_title(“ax1_title”)
ax2=plt.subplot2grid((3,3),(1,0),colspan=2)
ax3=plt.subplot2grid((3,3),(1,2),rowspan=2)
ax4=plt.subplot2grid((3,3),(2,0))
ax5=plt.subplot2grid((3,3),(2,1))
plt.show()