实验代码
# -*- coding: utf-8 -*-
"""
Created on Fri Jan 3 10:45:17 2020
@author: Administrator
@blog:https://blog.csdn.net/liuyunshengsir
加返利机器人:lys20191020
"""
import matplotlib.pyplot as plt
from sklearn.cluster import KMeans
from sklearn import datasets
iris = datasets.load_iris()
X = iris.data[:, :4] # #表示我们取特征空间中的4个维度
print(X.shape)
# plt 中文乱码的处理
plt.rcParams['font.sans-serif']=['SimHei']
plt.rcParams['axes.unicode_minus'] = False
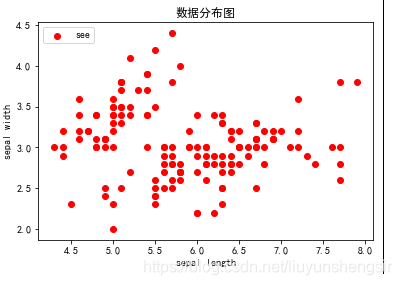
# 绘制数据分布图
plt.scatter(X[:, 0], X[:, 1], c="red", marker='o', label='see')
plt.xlabel('sepal length')
plt.ylabel('sepal width')
plt.legend(loc=2)
plt.title('数据分布图')
plt.show()
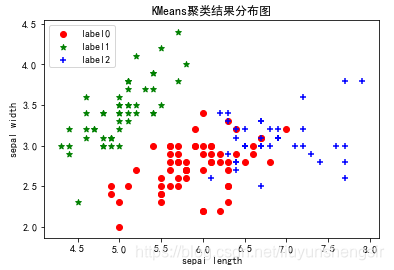
estimator = KMeans(n_clusters=3) # 构造聚类器
estimator.fit(X) # 聚类
label_pred = estimator.labels_ # 获取聚类标签
# 绘制k-means结果
x0 = X[label_pred == 0]
x1 = X[label_pred == 1]
x2 = X[label_pred == 2]
plt.scatter(x0[:, 0], x0[:, 1], c="red", marker='o', label='label0')
plt.scatter(x1[:, 0], x1[:, 1], c="green", marker='*', label='label1')
plt.scatter(x2[:, 0], x2[:, 1], c="blue", marker='+', label='label2')
plt.xlabel('sepal length')
plt.ylabel('sepal width')
plt.legend(loc=2)
plt.title('KMeans聚类结果分布图')
plt.show()
实验结果