第一R-squareda and Adjusted R-squared R-squared:
定义:衡量模型拟合度的一个量,是一个比例式,比例区间为[0,1],越接近1,表示模型拟合度越高
公式:R-squared= SSR/SST
= 1-SSE/SST
其中:SST是原始数据和均值之差的平方和,SSR即预测数据和原始数据均值之差的平方和,回归模型不能解释的方差,SSE是拟合数据和原始数据对应点的误差的平方和,且SST= SSE+SSR。For example:
lets say that we have 5, 6, 7, and 8, and a model predicts the outcomes as 4.5, 6.3, 7.2, and 7.9. Then,
SSE can be calculated as: SSE = (5 – 4.5) ^ 2 + (6 – 6.3) ^ 2 + (7 – 7.2) ^ 2 + (8 – 7.9) ^ 2;
and SST can be calculated as: mean = (5 + 6 + 7 + 8) / 4 = 6.5; SST = (5 – 6.5) ^ 2 + (6 – 6.5) ^ 2 + (7 – 6.5) ^ 2 + (8 – 6.5) ^ 2
R-squared 正常情况下取值范围为0-1,描述的是输入变量对输出变量的解释程度,在单变量线性回归中R-square越大,越接近1越好。然而只要增加了更多的变量,无论增加的变量是否和输出存在关系,则R-squared要么保持不变,要么增加。所以需要adjusted R-squared,它会对那些增加的且不会改善模型效果的变量增加一个惩罚项。
定义:The Adjusted R-squared value is similar to the Multiple R-squared value,
but it accounts for the number of variables. This means that the Multiple R-squared will always increase
when a new variable is added to the prediction model, but if the variable is a non-significant one, the Adjusted R-squared value will decrease.
公式: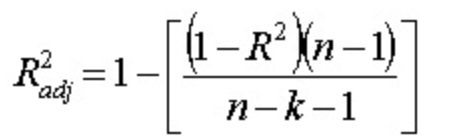
where:
- N is the number of points in your data sample.(样本数量)
- K is the number of independent regressors, i.e. the number of variables in your model, excluding the constant.(即模型中变量的个数,不包括常数)
第二:协方差和相关系数
两个随机变量线性相关性越大,协方差越大,线性相关性越小,协方差越小。
![]()
当X,Y是同一个随机变量时,X与其自身的协方差就是X的方差,可以说方差是协方差的一个特例。

由于随机变量的取值范围不同,连个协方差之间不具备可比性。如X,Y,Z分别是三个随机变量,想要比较X跟Y的相关性强,还是X与Z的相关性强。直接通过cov(X,Y)与cov(X,Z)无法直接比较。定义相关系数为:
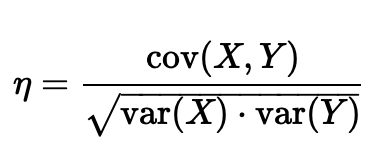
将协方差归一化之后才具有可比性,得到相关系数,取值范围为[-1,1].1表示完全线性相关,-1表示完全线性负相关,0表示线性无关。线性无关并不代表完全无关,更不代表相互独立。
样本协方差:

协方差矩阵 :多维随机变量的协方差矩阵


样本的协方差矩阵:


第三:MSE
![]()
用 真实值-预测值 然后平方之后求和平均,就是线性回归的损失函数。
第四:RMSE
RMSE也是一种回归评价指标,Root Mean Square Error,均方根误差

