这个单子没什么新的技术,还是和那四个化学一样,不知道他们最后的分数怎么样,希望高一点吧,不然我也不好意思,这里面附带一个爬虫,就直接拿来用了
#!/usr/bin/env python
# coding: utf-8
# In[1]:
#!/usr/bin/env python
# coding: utf-8
# In[ ]:
#!/usr/bin/python
# -*- coding: utf-8 -*-
import requests
import time
import re
import csv
from bs4 import BeautifulSoup

#设置URL固定部分
url='http://www.cbooo.cn/year?year='
#设置请求头部信息
headers = {
    'User-Agent':'Mozilla/5.0 (Windows NT 10.0; WOW64) AppleWebKit/537.36 (KHTML, like Gecko) Chrome/55.0.2883.87 Safari/537.36'
}
#循环抓取列表页信息
for year in range(2009,2019):
    if year == 2009:
        year=str(year)
        a=(url+year)
        r=requests.get(url=a,headers=headers)
        html=r.content
    else:
        year=str(year)
        a=(url+year)
        r=requests.get(url=a,headers=headers)
        html2=r.content
        html = html + html2
    #每次间隔0.5秒
    time.sleep(0.5)
lj=BeautifulSoup(html,'html.parser')
#print(lj)
#提取名称、类型、总票房(万)、平均票价、场均人次及国家及地区
result=lj.find_all('td')
#print(result)
#print(len(result))
mname=[]
title=""
index=1
year=2009
for i in result:
    i=str(i)
    title=re.findall(r'</span>(.*?)</p>',i,re.I|re.M)
    if len(title)>0:
        mname.append(index)
        index=index+1
        mname.append(title[0])
    else:
        info=re.findall(r'<td>(.*?)</td>',i,re.I|re.M)
        mname.append(info[0])
#print(len(mname))
#print(mname)
k=0
data=[]
while k<2000:
    year=2009
    year=year+(k//200)
    data.append([mname[k],mname[k+1],mname[k+2],mname[k+3],mname[k+4],mname[k+5],mname[k+6],mname[k+7],year,1])
    k=k+8
#print(data)
print(len(data))#一共250条数据
#将结果存到CSV文件
with open('data.csv','w') as fout:
    cin= csv.writer(fout,lineterminator='\n')
    #写入row_1    cin.writerow(["index","name","type","zpf","mantimes","price","area","datatime","year","mark"])
    for item in data:
        cin.writerow(item)
import pandas as pd
import numpy  as np
import matplotlib.pyplot as plt
%matplotlib inline
from pylab import mpl
mpl.rcParams['font.sans-serif'] = ['FangSong'] # 指定默认字体
mpl.rcParams['axes.unicode_minus'] = False # 解决保存图像是负号'-'显示为方块的问题test=pd.read_csv('data.csv',encoding='gbk')
test.head()| id | 影片名 | 类型 | 总票房 | 平均票价 | 场均人次 | 国家及地区 | 上映日期 | 年 | |
|---|---|---|---|---|---|---|---|---|---|
| 0 | 1 | 2012世界末日 | 灾难 | 44745 | 32 | 68 | 美国 | 2009/11/13 | 2009 |
| 1 | 2 | 变形金刚2 | 科幻/动作 | 40364 | 32 | 53 | 美国 | 2009/6/24 | 2009 |
| 2 | 3 | 建国大业 | 剧情 | 39288 | 32 | 54 | 中国/中国香港 | 2009/9/16 | 2009 |
| 3 | 4 | 赤壁(下) | 动作 | 24353 | 34 | 49 | 中国/中国香港 | 2009/1/7 | 2009 |
| 4 | 5 | 三枪拍案惊奇 | 喜剧 | 22011 | 33 | 49 | 中国 | 2009/12/10 | 2009 |
检查数据合理性,对数据进行清洗
缺省值查看
test.isnull().sum()id 0
影片名 0
类型 1
总票房 0
平均票价 0
场均人次 0
国家及地区 1
上映日期 2
年 0
dtype: int64
test.loc[test['类型'].isnull()]
test.drop([36],inplace=True)
test.loc[test['上映日期'].isnull()]
test.drop([65],inplace=True)test.isnull().sum()id 0
影片名 0
类型 0
总票房 0
平均票价 0
场均人次 0
国家及地区 0
上映日期 0
年 0
dtype: int64
test.isnull().sum()id 0
影片名 0
类型 0
总票房 0
平均票价 0
场均人次 0
国家及地区 0
上映日期 0
年 0
dtype: int64
test.info()<class 'pandas.core.frame.DataFrame'>
Int64Index: 248 entries, 0 to 249
Data columns (total 9 columns):
id 248 non-null int64
影片名 248 non-null object
类型 248 non-null object
总票房 248 non-null int64
平均票价 248 non-null int64
场均人次 248 non-null int64
国家及地区 248 non-null object
上映日期 248 non-null object
年 248 non-null int64
dtypes: int64(5), object(4)
memory usage: 19.4+ KB
test.hist(figsize=(20,10))array([[<matplotlib.axes._subplots.AxesSubplot object at 0x0000021685CAD710>,
<matplotlib.axes._subplots.AxesSubplot object at 0x0000021685F6C898>],
[<matplotlib.axes._subplots.AxesSubplot object at 0x0000021685F94F28>,
<matplotlib.axes._subplots.AxesSubplot object at 0x0000021685FC75C0>],
[<matplotlib.axes._subplots.AxesSubplot object at 0x0000021685FEDC50>,
<matplotlib.axes._subplots.AxesSubplot object at 0x0000021685FEDC88>]],
dtype=object)
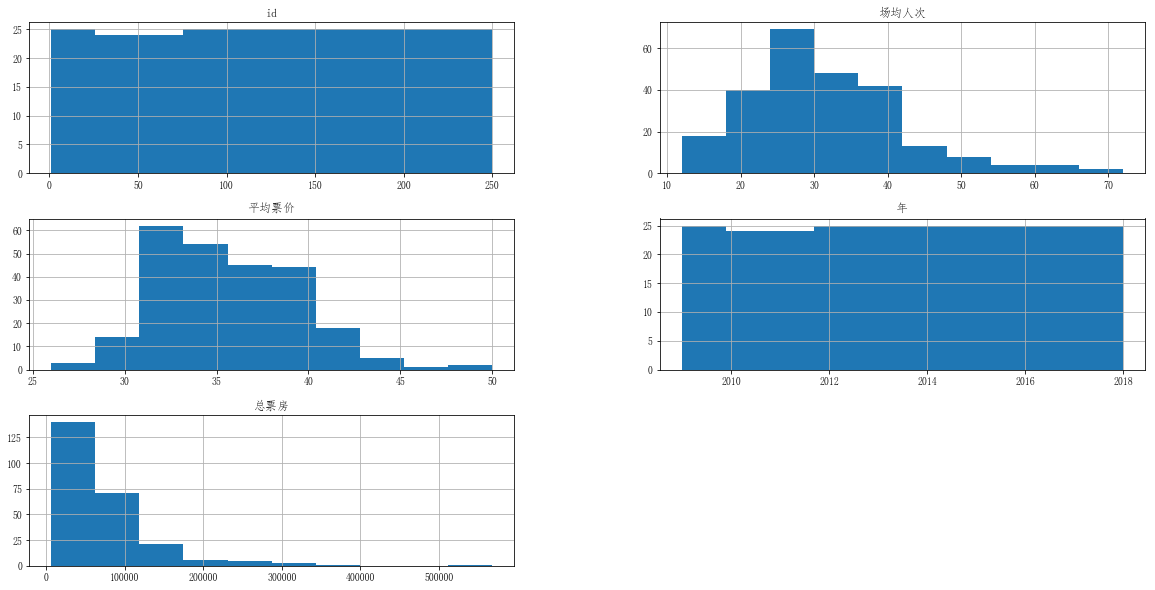
[外链图片转存失败,源站可能有防盗链机制,建议将图片保存下来直接上传(img-CNQ89Apa-1575806387908)(output_10_1.png)]
对所得数据按日期排序
test=test.sort_values(by='上映日期')test_num=test.groupby(by=['年']).sum()
test_num| id | 总票房 | 平均票价 | 场均人次 | |
|---|---|---|---|---|
| 年 | ||||
| 2009 | 325 | 395890 | 797 | 1058 |
| 2010 | 913 | 648652 | 856 | 961 |
| 2011 | 1509 | 710355 | 856 | 824 |
| 2012 | 2200 | 1011515 | 931 | 803 |
| 2013 | 2825 | 1174380 | 939 | 727 |
| 2014 | 3450 | 1633415 | 913 | 749 |
| 2015 | 4075 | 2495002 | 900 | 799 |
| 2016 | 4700 | 2513007 | 861 | 655 |
| 2017 | 5325 | 3287129 | 882 | 558 |
| 2018 | 5950 | 3916309 | 894 | 544 |
test_num['总票房'].plot()<matplotlib.axes._subplots.AxesSubplot at 0x21685cad940>
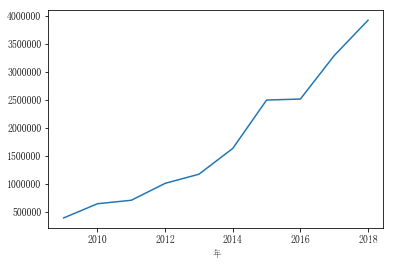
[外链图片转存失败,源站可能有防盗链机制,建议将图片保存下来直接上传(img-WOAUBwR1-1575806387910)(output_14_1.png)]
test_num['平均票价'].plot()<matplotlib.axes._subplots.AxesSubplot at 0x21686107cc0>
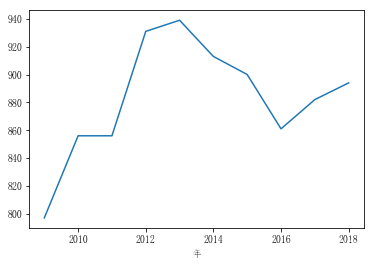
[外链图片转存失败,源站可能有防盗链机制,建议将图片保存下来直接上传(img-hMBEjtG2-1575806387911)(output_15_1.png)]
y = test_num['总票房']
X = test_num.drop(['总票房','id'],axis=1)
print('data shape: {0}; no. positive: {1}; no. negative: {2}'.format(
    X.shape, y[y==1].shape[0], y[y==0].shape[0]))
from sklearn.model_selection import train_test_split
X_train, X_test, y_train, y_test = train_test_split(X, y, test_size=0.2)
data shape: (10, 2); no. positive: 0; no. negative: 0
from sklearn import linear_model
model =linear_model.LinearRegression()
model.fit(X_train, y_train)
train_score = model.score(X_train, y_train)
test_score = model.score(X_test, y_test)
print('train score: {train_score:.6f}; test score: {test_score:.6f}'.format(
    train_score=train_score, test_score=test_score))
train score: 0.785987; test score: 0.901816
