这一章节,我们将介绍散点图的绘制:
散点图经常用来显示分布或者比较几个变量的相关性或者分组。
要绘制单个点我们需要使用scatter()函数,先看一个最简单的示例:
# -*- coding: utf-8 -*-
import matplotlib.pyplot as plt
from matplotlib.font_manager import FontProperties
font = FontProperties(fname=r"C:\Windows\Fonts\simhei.ttf", size=14)

plt.title(u'散点图示例', FontProperties=font)
plt.scatter(2, 4)
plt.show()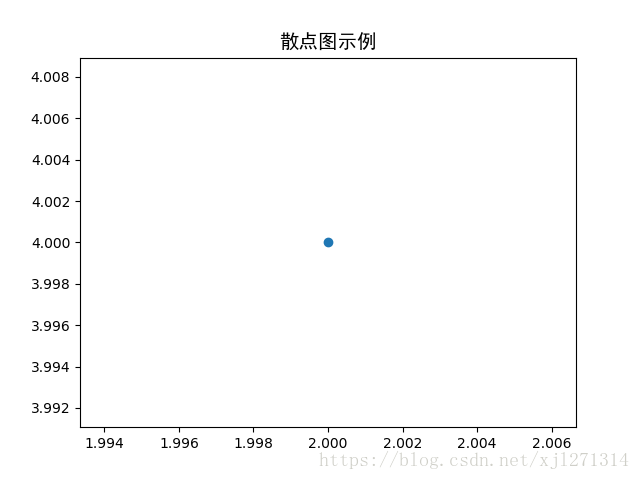
实际运用中,我们可能希望以一种颜色进行显示较小的值,用另外一种颜色显示较大的值,绘制某些大型数据的时候,你还可以对每个点都设置相同的样式,然后对某些特定的点使用不同的样式来突出他们。
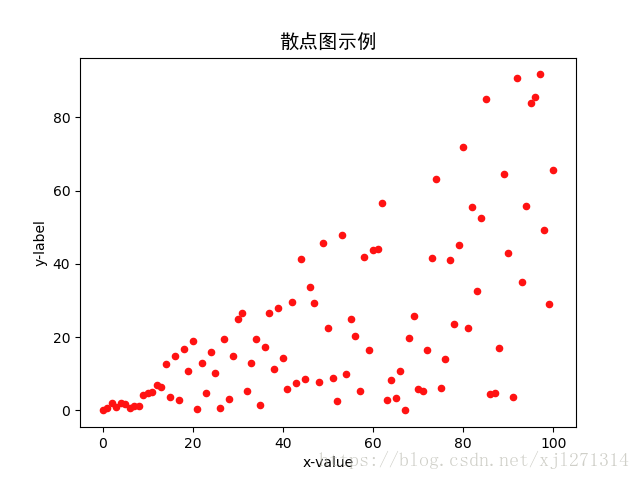
现在我们看一个稍微复杂一点的例子:
# -*- coding: utf-8 -*-
import matplotlib.pyplot as plt
import numpy as np
from matplotlib.font_manager import FontProperties
font = FontProperties(fname=r"C:\Windows\Fonts\simhei.ttf", size=14)

xValue = list(range(0, 101))
yValue = [x * np.random.rand() for x in xValue]

plt.title(u'散点图示例', FontProperties=font)

plt.xlabel('x-value')
plt.ylabel('y-label')
# plt.scatter(x, y, s, c, marker)
# x: x轴坐标
# y:y轴坐标
# s:点的大小/粗细 标量或array_like 默认是 rcParams['lines.markersize'] ** 2
# c: 点的颜色
# marker: 标记的样式 默认是 'o'
plt.legend()

plt.scatter(xValue, yValue, s=20, c="#ff1212", marker='o')
plt.show()
附录:marker的类型
| marker | type | 含义 |
|---|---|---|
| “.” | point | 点 |
| “,” | pixel | 像素 |
| “o” | circle | 圆 |
| “v” | triangle_down | 下三角 |
| “^” | triangle_up | 上三角 |
| “<” | triangle_left | 左三角 |
| “>” | triangle_right | 右三角 |
| “1” | tri_down | 类似奔驰的标志 |
| “2” | tri_up | 类似奔驰的标志 |
| “3” | tri_left | 类似奔驰的标志 |
| “4” | tri_right | 类似奔驰的标志 |
| “8” | octagon | 八角形 |
| “s” | square | 正方形 |
| “p” | pentagon | 五角星 |
| “*” | star | 星号 |
| “h” | hexagon1 | 六边形1 |
| “H” | hexagon2 | 六边形2 |
| “+” | plus | 加号 |
| “x” | x | x |
| “D” | diamond | 钻石 |
| “d” | thin_diamond | 细的钻石 |
| “ | “ | vline |
| “-“ | hline | 水平方向的线 |
| “TICKLEFT” | octagon | 像素 |