主要关注方法
plt.scatter()
参数:
- x坐标
- y坐标
- s size
- marker 形状
- c color 颜色
- alpha 透明度
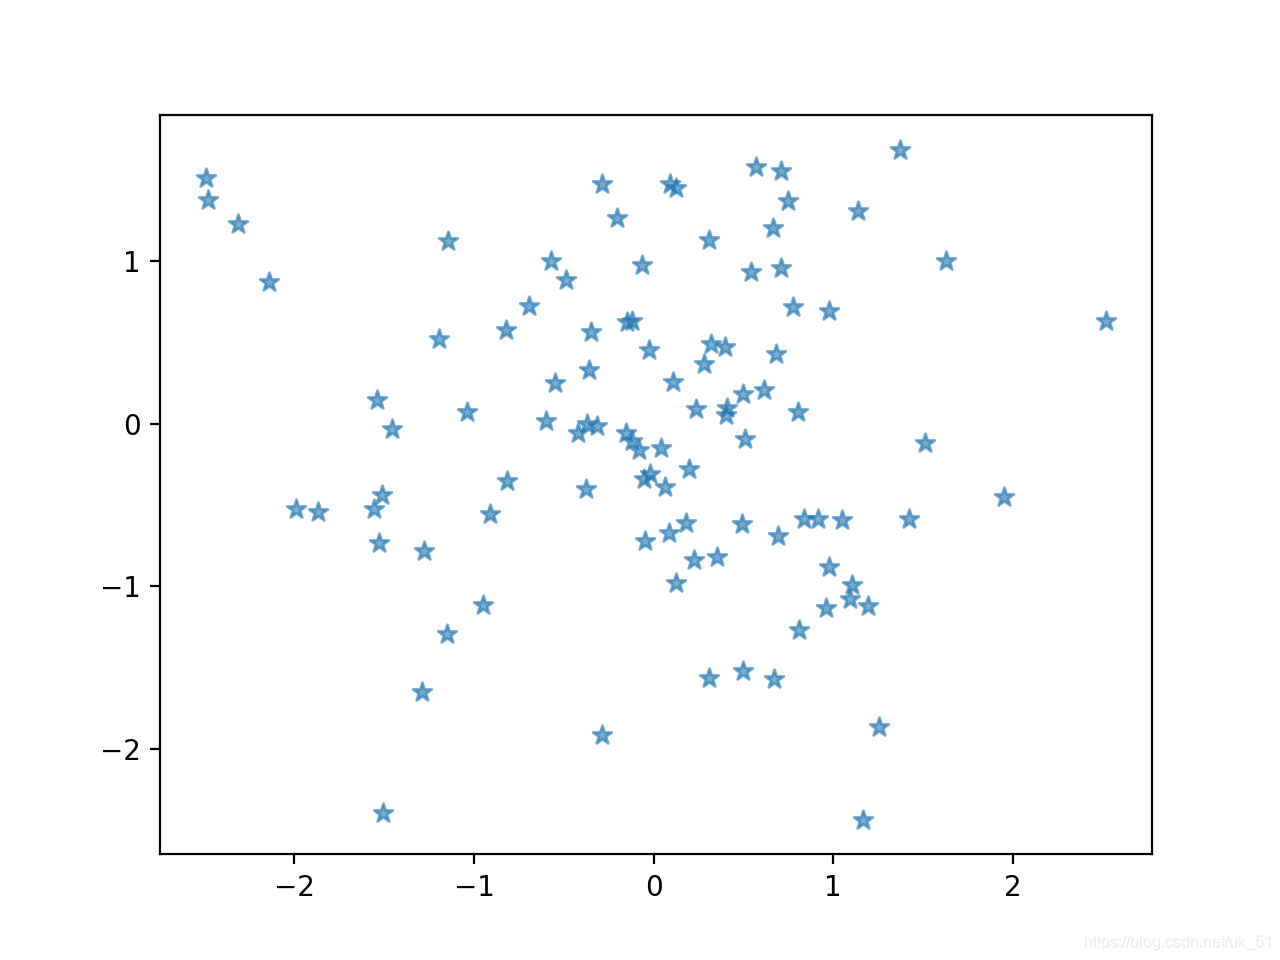
代码实现
from matplotlib import pyplot as plt
import numpy as np


n = 100
X = np.random.normal(0, 1, n)
Y = np.random.normal(0, 1, n)
plt.scatter(X, Y, s=50, marker='*',  alpha=0.6)

plt.show()
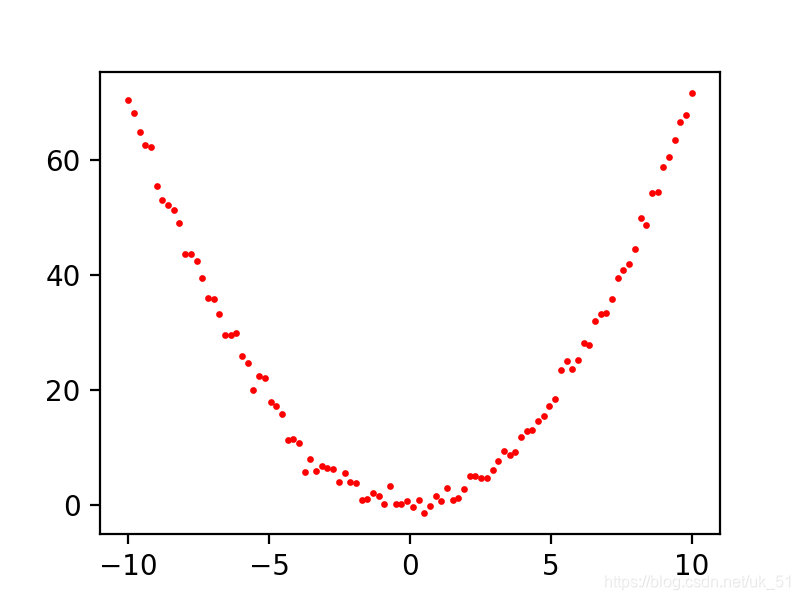
方程散点图
import matplotlib.pyplot as plt
import numpy as np

# x^2/a^2+y^2/b^2=1
a = 3
b = 2

x = np.linspace(-10,10,100)
noise = np.random.normal(0, 1.3, x.shape)
y = x**2/1.4  + noise
plt.figure(num=4, figsize=(4,3))
plt.scatter(x,y, 2, color='red')
plt.show()