1、Pandas简介
pandas是python的一个数据分析包,最初由AQR Capital Management于2008年4月开发,并于2009年底开源出来,目前由专注于Python数据包开发的PyData开发team继续开发和维护,属于PyData项目的一部分。Pandas最初被作为金融数据分析工具而开发出来,因此,pandas为时间序列分析提供了很好的支持。
Pandas的名称来自于面板数据(panel data)和python数据分析(data analysis)。panel data是经济学中关于多维数据集的一个术语,在Pandas中也提供了panel的数据类型。
官网:http://pandas.pydata.org/
参考文档:http://pandas.pydata.org/pandas-docs/stable/
2、Pandas安装
Python的Anaconda发行版,已经安装好了pandas库,因此无需另外安装。
使用Anaconda界面安装:打开Anaconda Navigator,选择开发环境,从Not installed下找到pandas相关的库,勾选安装。
Anaconda安装命令: conda install pandas
PyPi安装命令: pip install pandas
3、Pandas数据结构
(1)Pandas引入约定
from pandas import Series, DataFrame
import pandas as pd
(2)Series
Series是一种类似于一维数组的对象,它是由一组数据(各种Numpy数据类型)以及一组与之相关的数据标签(即索引)组成。仅由一组数据即可产生简单的Series。
1)通过一维数组创建Series
>> import numpy as np
>> import pandas as pd
>> from pandas import Series, DataFrame

>> arr = np.array([1, 2, 3, 4])
>> series01 = Series(arr)
>> series01
0	1
1	2
2	3
3	4
dtype: int32
>> series01.index
RangeIndex(start=0, stop=4, step=1)
>> series01.values
array([1, 2, 3, 4])
>> series01.dtype
dtype('int32')

>> series02 = Series([34.5, 56.78, 45.67])										# 通过数组创建时,如果没有为数据指定索引,则会自动创建一个从0到N-1(N为数据的长度)的整数型索引
>> series02
0	34.50
1	56.78
2	45.67
dtype: float64
>> series02.index = ['product1', 'product2', 'product3']						# 默认索引可通过赋值方式进行修改
>> series02
product1	34.50
product2	56.78
product3	45.67
dtype: float64

>> series03 = Series([98, 56, 88, 45], index=['语文', '数学', '英语', '体育'])		# 通过数组创建Series时,可以通过index参数传入一个明确的标签索引
>> series03
语文	98
数学	56
英语	88
体育	45
dtype: int64
>> series03.index
Index([u'语文', u'数学', u'英语', u'体育'], dtype='object')
>> series03.values
array([98, 56, 88, 45], dtype=int64)
2)通过字典的方式创建Series
Series可以被看成是一个定长的有序字典,是索引值到数据值的一个映射,因此可以直接通过字典来创建Series。
>> a_dict = {'20071001':6798.98, '20071002':34556.89, '20071003':3748758.88}
>> series04 = Series(a_dict)		# 通过字典创建Series时,字典中的key组成Series的索引,字典中的value组成Series中的values
>> series04.index
Index([u'20071001', u'20071002', u'20071003'], dtype='object')
>> series04
20071001	6798.98
20071002	34556.89
20071003	3748758.88
3)Series应用Numpy数组运算
通过索引取值:
>> series04['20071001']
6798.9799999999996
>> series04[0]
6798.9799999999996
Numpy中的数组运算,在Series中都保留使用,并且Series进行数组运算时,索引与值之间的映射关系不会改变。
>> series04
20071001	6798.98
20071002	34556.89
20071003	3748758.88
dtype: float64
>> series04[series04>10000]
20071002	34556.89
20071003	3748758.88
dtype: float64
>> series04 / 100
20071001	67.9898
20071002	345.5689
20071003	37487.5888
dtype: float64
>> series01 = Series([1, 2, 3, 4])
>> np.exp(series01)
0	2.718282
1	7.389056
2	20.085537
3	54.598150
dtype: float64
4)Series缺失值检测
>> scores = Series({"Tom":89, "John":88, "Merry":96, "Max":65})
>> scores
John	88
Max		65
Merry	96
Tom		89
dtype: int64
>> new_index = ['Tom', 'Max', 'Joe', 'John', 'Merry']
>> scores = Series(scores, index=new_index)
>> scores
Tom		89.0
Max		65.0
Joe		NaN				# NaN(not a number)在pandas中用于表示一个缺失或者NA值
John	88.0
Merry	96.0
dtype: float64
pandas中的isnull和notnull函数可用于Series缺失值检测,isnull和notnull都返回一个布尔类型的Series。
>> pd.isnull(scores)
Tom		False
Max		False
Joe		True
John	False
Merry	False
dtype: bool
>> pd.notnull(scores)
Tom		True
Max		True
Joe		False
John	True
Merry	True
dtype: bool
>> scores[pd.isnull(scores)]		# 过滤出为缺失值的项
Joe		NaN
dtype: float64
>> scores[pd.notnull(scores)]		# 过滤出不是缺失值的项
Tom		89.0
Max		65.0
John	88.0
Merry	96.0
dtype: float64
5)Series自动对齐
不同Series之间进行算术运算,会自动对齐不同索引的数据。
product_num = Series([23, 45, 67, 89], index=['p3', 'p1', 'p2', 'p5'])
product_price_table = Series([9.98, 2.34, 4.56, 5.67, 8.78], index=['p1', 'p2', 'p3', 'p4', 'p5'])
product_sum = product_num * product_price_table
product_sum
p1		449.10
p2		156.78
p3		104.88
p4		NaN
p5		781.42
dtype: float64
6)Series及其索引的name属性
Series对象本身及其索引都有一个name属性,可赋值设置。
>> product_num.name = 'ProductNums'
>> product_num.index.name = 'ProductType'
>> product_num
ProductType
p3		23
p1		45
p2		67
p5		89
Name: ProductNums, dtype: int64
(3)DataFrame
DataFrame是一个表格型的数据结构,含有一组有序的列,每列可以是不同的值类型(数值、字符串、布尔值等),DataFrame既有行索引也有列索引,可以被看做是由Series组成的字典。
1)通过二维数组创建DataFrame
>> df01 = DataFrame([['Tom', 'Merry', 'John'], [76, 98, 100]])
>> df01
		0		1			2
0		Tom		Merry		John
1		76		98			100
>> df02 = DataFrame([['Tom', 76], ['Merry', 98], ['John', 100]])
>> df02
		0		1
0		Tom		76
1		Merry	98
2		John	100
>> arr = np.array([['Tom', 76], ['Merry', 98], ['John', 100]])
>> df03 = DataFrame(arr, columns=['name', 'score'])
>> df03
		name	score
0		Tom		76
1		Merry	98
2		John	100
>> df04 = DataFrame(arr, index=['one', 'two', 'three'], columns=['name', 'score'])		# 自定义行索引index,自定义列索引columns
>> df04
		name	score
one		Tom		76
two		Merry	98
three	John	100
2)通过字典的方式创建DataFrame
>> data = {"apart":['1001', '1002', '1003', '1001'], "profits":[567.87, 987.87, 873, 498.87], "year":[2001, 2001, 2001, 2000]}
>> df = DataFrame(data)
>> df
		apart		profits		year
0		1001		567.87		2001
1		1002		987.87		2001
2		1003		873.00		2001
3		1001		498.87		2000
>> df.index
RangeIndex(start=0, stop=4, step=1)
>> df.columns
Index([u'apart', u'profits', u'year'], dtype='object')
>> df.values
array([['1001', 567.87, 2001L],
	   ['1002', 987.87, 2001L],
	   ['1003', 873.0, 2001L],
	   ['1001', 498.87, 2000L]], dtype=object)
>> data = {"apart":['1001', '1002', '1003', '1001'], "profits":[567.87, 987.87, 873, 498.87], "year":[2001, 2001, 2001, 2000]}
>> df = DataFrame(data, index=['one', 'two', 'three', 'four'])
>> df
		apart		profits		year
one		1001		567.87		2001
two		1002		987.87		2001
three	1003		873.00		2001
four	1001		498.87		2000
>> df.index
Index([u'one', u'two', u'three', u'four'], dtype='object')
(4)索引对象
不管是Series对象还是DataFrame对象,都有索引对象。索引对象负责管理轴标签和其他元数据(比如轴名称等)。通过索引可以从Series、DataFrame中取值或对某个位置的值重新赋值。Series或者DataFrame自动化对齐功能就是通过索引进行的。
1)通过索引从Series中取值
>> series02 = Series([34.56, 23.34, 45.66, 98.08], index=['2001', '2002', '2003', '2004'])
>> series02
2001	34.56
2002	23.34
2003	45.66
2004	98.08
dtype: float64
>> series02['2003']
45.659999999999997
>> series02['2002':'2004']		# 包含右边界,这与Python基础中的列表等不一样
2002	23.34
2003	45.66
2004	98.08
dtype: float64
>> series02['2001':]
2001	34.56
2002	23.34
2003	45.66
2004	98.08
dtype: float64
>> series02[:'2003']
2001	34.56
2002	23.34
2003	45.66
dtype: float64
>> series02['2001'] = 35.65
>> series02
2001	35.65
2002	23.34
2003	45.66
2004	98.08
dtype: float64
>> series02[:'2002'] = [23.45, 56.78]
>> series02
2001	23.45
2002	56.78
2003	45.66
2004	98.08
dtype: float64
2)通过索引从DataFrame中取值
可以直接通过列索引获取指定列的数据,要通过行索引获取指定行数据需要ix方法。
>> df
		apart	profits		year
0		1001	567.87		2001
1		1002	987.87		2001
2		1003	873.00		2001
3		1001	498.87		2000
>> df['year']
0		2001
1		2001
2		2001
3		2000
Name: year, dtype: int64
>> df.ix[0]
apart			1001
profits			567.87
year			2001
Name: 0, dtype: object
>> df = DataFrame(data)
>> df
		apart	profits		year
0		1001	567.87		2001
1		1002	987.87		2001
2		1003	873.00		2001
3		1001	498.87		2000
>> df['pdn'] = np.NaN
>> df
		apart	profits		year	pdn
0		1001	567.87		2001	NaN
1		1002	987.87		2001	NaN
2		1003	873.00		2001	NaN
3		1001	498.87		2000	NaN
4、Pandas基本功能
(1)汇总和计算描述统计
1)常用的数学和统计方法
| 方法 |
|
|---|---|
| count | 非NA值的数量 |
| describe | 针对Series或各DataFrame列计算多个统计量 |
| min/max | 计算最小值、最大值 |
| argmin、argmax | 计算能够获取到最小值和最大值的索引位置(整数) |
| idxmin、idxmax | 计算能够获取到最小值和最大值的索引值 |
| quantile | 计算样本的分位数(0到1) |
| sum | 值的总和 |
| mean | 值的平均数 |
| median | 值的算术中位数(50%分位数) |
| mad | 根据平均值计算平均绝对离差 |
| var | 样本数值的方差 |
| std | 样本值的标准差 |
| cumsum | 样本值的累计和 |
| cummin、cummax | 样本值的累计最小值、最大值 |
| cumprod | 样本值的累计积 |
| Pct_change | 计算百分数变化 |
>> data = {'a': [0, 2, 4, 6, 8, 10, 12, 14], 'b': [1, 3, 5, 7, 9, 11, 13, 15]}
>> df = DataFrame(data)
>> df.describe()
		a			b
count	8.00000		8.00000
mean	7.00000		8.00000
std		4.89898		4.89898
min		0.00000		1.00000
25%		3.50000		4.50000
50%		7.00000		8.00000
75%		10.50000	11.50000
max		14.00000	15.00000
>> frame
		d	a	b	c
three	0	1	2	3
one		4	5	6	7
>> frame.count()			# 对于DataFrame,这些统计方法,默认是计算各列上的数据
d	2
a	2
b	2
c	2
dtype: int64
>> frame.count(axis=1)		# 如果要应用于各行数据,则增加参数axis=1
three	4
one		4
dtype: int64
2)相关系数与协方差
>> df = DataFrame({"GDP": [12, 23, 34, 45, 56], "air_temperature": [23, 25, 26, 27, 30]}, index=['2001', '2002', '2003', '2004', '2005'])
>> df
		GDP		air_temperature
2001	12		23
2002	23		25
2003	34		26
2004	45		27
2005	56		30
>> df.corr()
					GDP			air_temperature
GDP					1.000000	0.977356
air_temperature		0.977356	1.000000
>> df.cov()
					GDP			air_temperature
GDP					302.5		44.0
air_temperature		44.0		6.7
>> df['GDP'].corr(df['air_temperature'])
0.97735555485044179
>> df['GDP'].cov(df['air_temperature'])
44.0
>> series = Series([13, 13.3, 13.5, 13.6, 13.7], index=['2001', '2002', '2003', '2004', '2005'])
>> series
2001	13.0
2002	13.3
2003	13.5
2004	13.6
2005	13.7
dtype: float64
>> df.corrwith(series)
GDP					0.968665
air_temperature		0.932808
dtype: float64
3)唯一值、值计数以及成员资格
unique方法用于获取Series唯一值数组。value_counts方法用于计算一个Series中各值出现的频率。isin方法用于判断矢量化集合的成员资格,可用于选取Series中或者DataFrame中列数据的子集。
>> ser = Series(['a', 'b', 'c', 'a', 'a', 'b', 'c'])
>> ser
0	a
1	b
2	c
3	a
4	a
5	b
6	c
dtype: object
>> ser.unique()
array(['a', 'b', 'c'], dtype=object)
>> df = DataFrame({'orderId': ['1001', '1002', '1003', '1004'], 'orderAmt': [345.67, 34.23, 456.77, 334.55], 'memberId': ['a1001', 'b1002', 'a1001', 'a1001']})
>> df
	memberId	orderAmt	orderId
0	a1001		345.67		1001
1	b1002		34.23		1002
2	a1001		456.77		1003
3	a1001		334.55		1004
>> df['memberId'].unique()
array(['a1001', 'b1002'], dtype=object)
>> ser
0	a
1	b
2	c
3	a
4	a
5	b
6	c
dtype: object
>> ser.value_counts()			# 默认情况下会按值出现频率降序排列
a	3
b	2
c	2
dtype: int64
>> ser.value_counts(ascending=False)
a	3
b	2
c	2
dtype: int64
>> mask = ser.isin(['b', 'c'])
>> mask
0	False
1	True
2	True
3	False
4	False
5	True
6	True
dtype: bool
>> ser[mask]					# 选出值为'b'、'c'的项
1	b
2	c
5	b
6	c
(2)处理缺失数据
1)缺失值NaN处理方法
| 方法 |
|
|---|---|
| dropna | 根据标签的值中是否存在缺失数据对轴标签进行过滤(删除),可通过阈值调节对缺失值的容忍度 |
| fillna | 用指定值或插值方法(如ffill或bfill)填充缺失数据 |
| isnull | 返回一个含有布尔值的对象,这些布尔值表示哪些值是缺失值NA |
| notnull | Isnull的否定式 |
2)缺失值检测
>> df = DataFrame([['Tom', np.nan, 456.67, 'M'], ['Merry', 34, 4567.34, np.NaN], ['John', 23, np.NaN, 'M'], ['Joe', 18, 342.45, 'F']], columns=['name', 'age', 'salary', 'gender'])
>> df
	name	age		salary	gender
0	Tom		NaN		456.67	M
1	Merry	34.0	4567.34	NaN
2	John	23.0	NaN		M
3	Joe		18.0	342.45	F
>> df.isnull()
	name	age		salary	gender
0	False	True	False	False
1	False	False	False	True
2	False	False	True	False
3	False	False	False	False
>> df.notnull()
	name	age		salary	gender
0	True	False	True	True
1	True	True	True	False
2	True	True	False	True
3	True	True	True	True
3)过滤缺失数据
>> series = Series([1, 2, 3, 4, np.NaN, 5])
>> series.dropna()
0	1.0
1	2.0
2	3.0
3	4.0
5	5.0
dtype: float64
>> data = DataFrame([[1., 3.4, 4.], [np.nan, np.nan, np.nan], [np.nan, 4.5, 6.7]])
>> data
	0		1		2
0	1.0		3.4		4.0
1	NaN		NaN		NaN
2	NaN		4.5		6.7
>> data.dropna()						# 默认丢弃只要含有缺失值的行
	0		1		2
0	1.0		3.4		4.0
>> data.dropna(how='all')				# 丢弃全部为缺失值的行
	0		1		2
0	1.0		3.4		4.0
2	NaN		4.5		6.7
>> data[4] = np.nan
>> data
	0		1		2		4
0	1.0		3.4		4.0		NaN
1	NaN		NaN		NaN		NaN
2	NaN		4.5		6.7		NaN
>> data.dropna(axis=1, how='all')		# 丢弃全部为缺失值的列
	0		1		2
0	1.0		3.4		4.0
1	NaN		NaN		NaN
2	NaN		4.5		6.7
4)填充缺失数据
>> df = DataFrame(np.random.randn(7, 3))
>> df.ix[:4, 1] = np.nan
>> df.ix[:2, 2] = np.nan
>> df
	0			1			2
0	1.101286	NaN			NaN
1	1.071460	NaN			NaN
2	0.058237	NaN			NaN
3	-1.629676	NaN			-0.556655
4	-1.036194	NaN			-0.063239
5	0.686838	0.666562	1.252273
6	0.852754	-1.035739	0.102285
>> df.fillna(0)
	0			1			2
0	1.101286	0.000000	0.000000
1	1.071460	0.000000	0.000000
2	0.058237	0.000000	0.000000
3	-1.629676	0.000000	-0.556655
4	-1.036194	0.000000	-0.063239
5	0.686838	0.666562	1.252273
6	0.852754	-1.035739	0.102285
>> df.fillna({1: 0.5, 2: -1, 3: -2})
	0			1			2
0	1.101286	0.500000	-1.000000
1	1.071460	0.500000	-1.000000
2	0.058237	0.500000	-1.000000
3	-1.629676	0.500000	-0.556655
4	-1.036194	0.500000	-0.063239
5	0.686838	0.666562	1.252273
6	0.852754	-1.035739	0.102285
(3)层次化索引
在某个方向上拥有多个(两个及两个以上)索引级别。通过层次化索引,pandas能够以低维度形式处理高维度数据。通过层次化索引,可以按层级统计数据。
1)Series层次化索引
>> data = Series([988.44, 95859, 3949.44, 32445.44, 234.45], index=[['2001', '2001', '2001', '2002', '2002'], ['苹果', '香蕉', '西瓜', '苹果', '西瓜']])
>> data
2001	苹果	988.44
		香蕉	95859.00
		西瓜	3949.44
2002	苹果	32445.44
		西瓜	234.45
dtype: float64
>> data.index.names = ['年份', '水果类别']
>> data
年份	水果类别
2001	苹果	988.44
		香蕉	95859.00
		西瓜	3949.44
2002	苹果	32445.44
		西瓜	234.45
dtype: float64
2)DataFrame层次化索引
>> df = DataFrame({'year': [2001, 2001, 2002, 2002, 2003], 'fruit': ['apple', 'banana', 'apple', 'banana', 'apple'], 'production': [2345, 3423, 4556, 4455, 534], 'profits': [2334.44, 44556.55, 6677.88, 77856.778, 3345.55]})
>> df
	fruit	production	profits		year
0	apple	2345		2334.440	2001
1	banana	3423		44556.550	2001
2	apple	4556		6677.880	2002
3	banana	4455		77856.778	2002
4	apple	534			3345.550	2003
>> df.set_index(['year', 'fruit'])
year	fruit		production	profits
2001	apple		2345		2334.440
		banana		3423		44556.550
2002	apple		4556		6677.880
		banana		4455		77856.778
2003	apple		534			3345.550
>> new_df = df.set_index(['year', 'fruit'])
>> new_df.index
MultiIndex(levels=[[2001, 2002, 2003], [u'apple', u'banana']],
		   labels=[[0, 0, 1, 1, 2], [0, 1, 0, 1, 0]],
		   names=[u'year', u'fruit'])
3)按层级统计数据
>> new_df.index
MultiIndex(levels=[[2001, 2002, 2003], [u'apple', u'banana']],
		   labels=[[0, 0, 1, 1, 2], [0, 1, 0, 1, 0]],
		   names=[u'year', u'fruit'])
>> new_df.sum(level='year')
year	production	profits
2001	5768		46890.990
2002	9011		84534.658
2003	534			3345.550
>> new_df.sum(level='fruit')
fruit	production	profits
apple	7435		12357.870
banana	7878		122413.328
5、Matplotlib
(1)Matplotlib简介
Matplotlib是python最著名的绘图库,它提供了一整套和matlab相似的命令API,十分适合交互式地进行制图。而且也可以方便地将它作为绘图控件,嵌入GUI应用程序中。
官网地址:http://matplotlib.org/。
学习方式,从官网examples入手学习:http://matplotlib.org/examples/index.html。
http://matplotlib.org/gallery.html有各种图示案例。
(2)Figure和Subplot
matplotlib的图像都位于Figure对象中,Figure对象下创建一个或多个subplot对象(即axes)用于绘制图表。
import matplotlib.pyplot as plt
import numpy as np

# 设置中文和 '-' 负号
from pylab import mpl
mpl.rcParams['font.sans-serif'] = ['FangSong']
mpl.rcParams['axes.unicode_minus'] = False

# 获得Figure对象
fig = plt.figure(figsize=(8, 6))
# 在Figure对象上创建axes对象
ax1 = fig.add_subplot(2, 2, 1)
ax2 = fig.add_subplot(2, 2, 2)
ax3 = fig.add_subplot(2, 2, 3)
# 在当前axes上绘制曲线图(ax3)
plt.plot(np.random.randn(50).cumsum(), 'k--')
# 在ax1上绘制柱状图
ax1.hist(np.random.randn(300), bins=20, color='k', alpha=0.3)
# 在ax2上绘制散点图
ax2.scatter(np.arange(30), np.arange(30) + 3 * np.random.randn(30))
plt.show()

import matplotlib.pyplot as plt
import numpy as np

# 设置中文和 '-' 负号
from pylab import mpl
mpl.rcParams['font.sans-serif'] = ['FangSong']
mpl.rcParams['axes.unicode_minus'] = False

fig, axes = plt.subplots(2, 2, sharex=True, sharey=True)
print axes

for i in range(2):
	for j in range(2):
		axes[i, j].hist(np.random.randn(500), bins=10, color='k', alpha=0.5)

plt.subplots_adjust(wspace=0, hspace=0)
plt.show()

(3)Matplotlib绘制曲线图
import numpy as np
import matplotlib.pyplot as plt
x = np.linspace(0, 10, 100)
y = np.sin(x)
z = np.cos(x ** 2)
plt.figure(figsize=(8, 4))				# 创建一个绘图对象,并且指定宽8英寸,高4英寸
# label:给所绘制的曲线一个名字,此名字在图示(legend)中显示
# 只要在字符串前后添加"$"符号,matplotlib就会使用其内嵌的latex引擎绘制数学公式
# color指定曲线颜色,linewidth指定曲线宽度,"b--"指定曲线的颜色和线型
plt.plot(x, y, label="$sin(x)$", color="red", linewidth=2)
plt.plot(x, z, "b--", label="$cos(x^2)$")
plt.xlabel("Time(s)")					# 设置x轴标题
plt.ylabel("Volt")						# 设置y轴标题
plt.title("PyPlot First Example")		# 设置图表标题
plt.ylim(-1.2, 1.2)						# 设置x轴范围
plt.legend()							# 显示图示说明
plt.grid(True)							# 显示虚线框
plt.show()								# 展示图表

(4)Matplotlib绘制散点图
import matplotlib.pyplot as plt
plt.axis([0, 5, 0, 20])
plt.title('My First Chart', fontsize=20, fontname='Times New Roman')
plt.xlabel('Counting', color='gray')
plt.ylabel('Square values', color='gray')
plt.text(1, 1.5, 'First')
plt.text(2, 4.5, 'Second')
plt.text(3, 9.5, 'Third')
plt.text(4, 16.5, 'Fourth')
plt.text(1, 11.5, r'$y=x^2$', fontsize=20, bbox={'facecolor': 'yellow', 'alpha': 0.2})
plt.grid(True)
plt.plot([1, 2, 3, 4], [1, 4, 9, 16], 'ro')
plt.plot([1, 2, 3, 4], [0.8, 3.5, 8, 15], 'g^')
plt.plot([1, 2, 3, 4], [0.5, 2.5, 5.4, 12], 'b*')
plt.legend(['First series', 'Second series', 'Third series'], loc=2)
plt.savefig('my_chart.png')
plt.show()

(5)颜色、标记和线型
通过help(plt.plot)查看文档。


import matplotlib.pyplot as plt
import numpy as np
from pylab import mpl
mpl.rcParams['font.sans-serif'] = ['FangSong']
mpl.rcParams['axes.unicode_minus'] = False
x = np.arange(-5, 5)
y = np.sin(np.arange(-5, 5))
plt.axis([-5, 5, -5, 5])
plt.plot(x, y, color='g', linestyle='dashed', marker='o')
plt.text(-3, -3, '$y=sin(x)$', fontsize=20, bbox={'facecolor': 'yellow', 'alpha': 0.2})
plt.show()
(6)刻度、标签和图例
- xlim、ylim控制图表的范围
- xticks、yticks控制图表刻度位置
- xtickslabels,yticklabels控制图表刻度标签
(7)将图表保存到文件
- plt.savefig(文件名称)
(8)Matplotlib输出中文
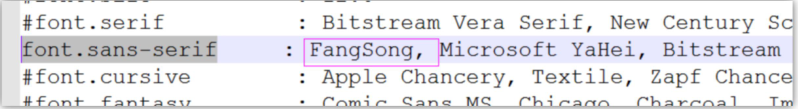
修改matplotlib安装目录(Lib/site-packages/ matplotlib )下mpl-data子目录的matplotlibrc文件,去掉font.family和font.sans-serif的注释,并且在font.sans-serif添加FangSong中文字体。
或者在代码中添加下面这个函数并调用该函数:
def set_ch():
	from pylab import mpl
	mpl.rcParams['font.sans-serif'] = ['FangSong']
	mpl.rcParams['axes.unicode_minus'] = False

set_ch()
import numpy as np
months = ['Jan', 'Feb', 'Mar', 'Apr', 'May', 'Jun', 'Jul', 'Aug', 'Sep', 'Oct', 'Nov', 'Dec']
mean_sales = [343.56, 566.99, 309.81, 456.78, 989, 345.98, 235.67, 934, 119.09, 245.6, 213.98, 156.77]
np_months = np.array([i+1 for i, _ in enumerate(months)])
np_mean_sales = np.array(mean_sales)
plt.figure(figsize=(15, 8))
plt.bar(np_months, np_mean_sales, width=1, facecolor='yellowgreen', edgecolor='white')
plt.xlim(0.5, 13)
plt.xlabel(u"月份")
plt.ylabel(u"月均销售额")
for x, y in zip(np_months, np_mean_sales):
	plt.text(x, y, y, ha="center", va="bottom")
plt.show()

(9)用LaTex编写数学表达式
参考:http://matplotlib.org/users/mathtext.html
