直方图
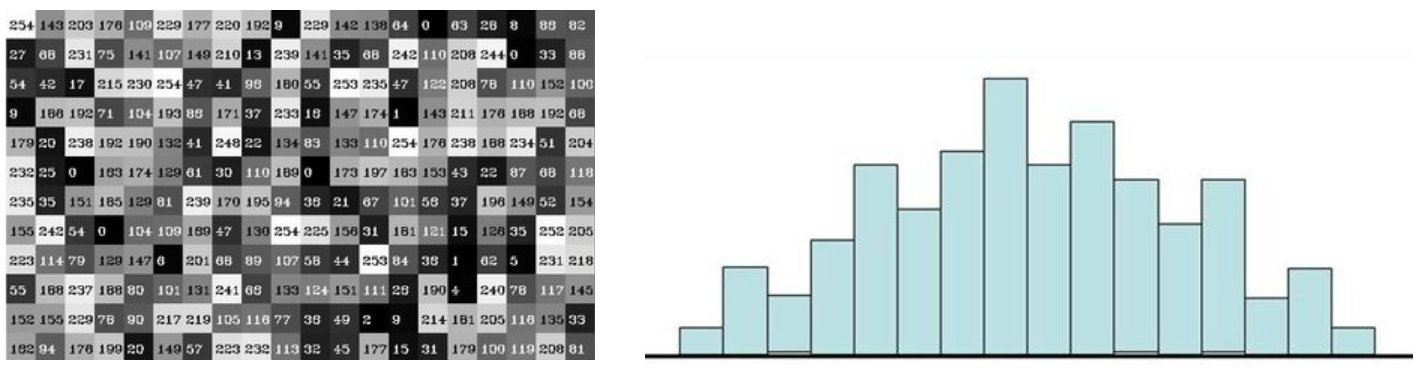
cv2.calcHist(images,channels,mask,histSize,ranges)
- images: 原图像图像格式为 uint8 或 float32。当传入函数时应 用中括号 [] 括来例如[img]
- channels: 同样用中括号括起来,它会告诉函数我们统幅图像的直方图。如果输入图像是灰度图,它的值就是[0]如果是彩色图像 的传入的参数可以是 [0][1][2] 它们分别对应着 BGR。
- mask: 掩模图像。统整幅图像的直方图就把它为 None。但是如果你想统图像某一分的直方图的你就制作一个掩模图像并使用它。
- histSize:BIN 的数目。也应用中括号括来
- ranges: 像素值范围常为 [0256]
img = cv2.imread('cat.jpg',0) #0表示灰度图
hist = cv2.calcHist([img],[0],None,[256],[0,256])
hist.shape
#print(hist)
#cv_show(hist,"hist")
效果:
(256, 1)
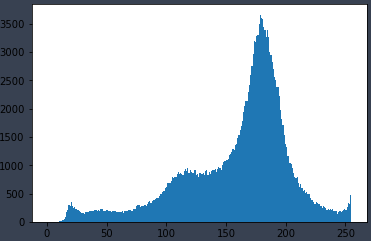
plt.hist(img.ravel(),256); #数据集扁平化
plt.show()
效果:
img = cv2.imread('cat.jpg')
color = ('b','g','r')
for i,col in enumerate(color):
    histr = cv2.calcHist([img],[i],None,[256],[0,256])
    plt.plot(histr,color = col)
    plt.xlim([0,256])
效果:

mask操作(掩模)
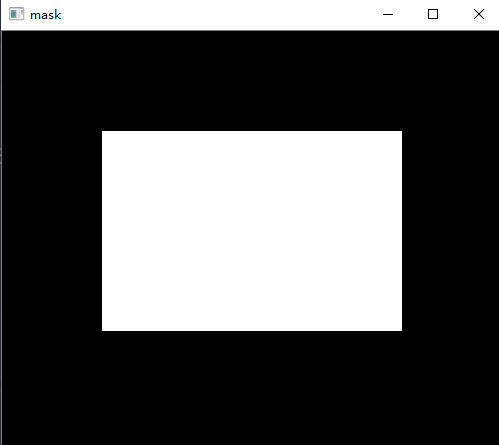
# 创建mast
mask = np.zeros(img.shape[:2], np.uint8)
print (mask.shape)
mask[100:300, 100:400] = 255
cv_show(mask,'mask')
效果:
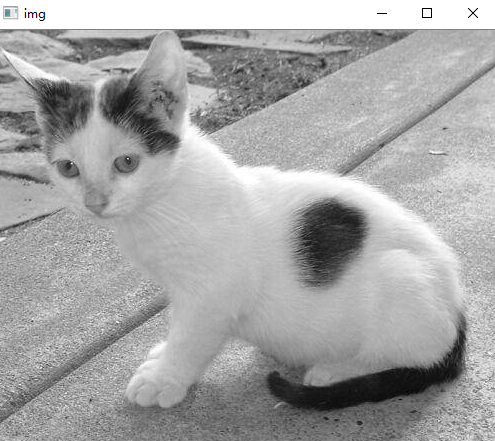
img = cv2.imread('cat.jpg', 0)
cv_show(img,'img')
效果:
masked_img = cv2.bitwise_and(img, img, mask=mask)#与操作
cv_show(masked_img,'masked_img')
效果:

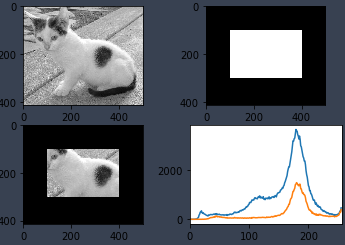
hist_full = cv2.calcHist([img], [0], None, [256], [0, 256])
hist_mask = cv2.calcHist([img], [0], mask, [256], [0, 256])
plt.subplot(221), plt.imshow(img, 'gray')
plt.subplot(222), plt.imshow(mask, 'gray')
plt.subplot(223), plt.imshow(masked_img, 'gray')
plt.subplot(224), plt.plot(hist_full), plt.plot(hist_mask)
plt.xlim([0, 256])
plt.show()
效果:
直方图均衡化
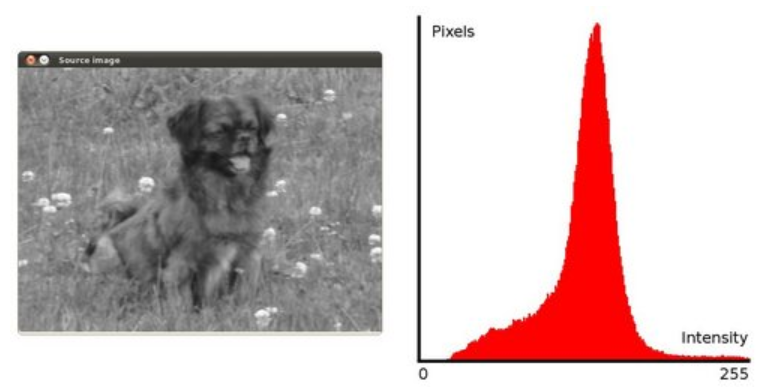


img = cv2.imread('clahe.jpg',0) #0表示灰度图 #clahe
plt.hist(img.ravel(),256);
plt.show()
效果:

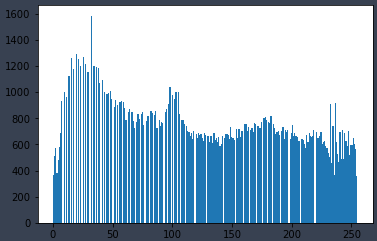
equ = cv2.equalizeHist(img) #均衡化
plt.hist(equ.ravel(),256)
plt.show()
效果:
res = np.hstack((img,equ)) #均衡前后
cv_show(res,'res')
效果:

自适应直方图均衡化
clahe = cv2.createCLAHE(clipLimit=2.0, tileGridSize=(8,8))
res_clahe = clahe.apply(img)
res = np.hstack((img,equ,res_clahe))
cv_show(res,'res')
效果:
