获取数据
library(jsonlite)
url <- 'https://view.inews.qq.com/g2/getOnsInfo?name=disease_h5'
pre <- fromJSON(url)
count <- fromJSON(pre$data)
#汇总
count$chinaTotal
$confirm
[1] 24433
$suspect
[1] 23260
$dead
[1] 493
$heal
[1] 968
#新增汇总
count$chinaAdd
$confirm
[1] 3962
$suspect
[1] 46
$dead
[1] 68
$heal
[1] 336
#每日汇总
count$chinaDayList
    date confirm suspect dead heal
1  01.13      41       0    1    0
2  01.14      41       0    1    0
3  01.15      41       0    2    5
4  01.16      45       0    2    8
5  01.17      62       0    2   12
6  01.18     198       0    3   17
7  01.19     275       0    4   18
8  01.20     291      54    6   25
9  01.21     440      37    9   25
10 01.22     571     393   17   25
11 01.23     830    1072   25   34
12 01.24    1287    1965   41   38
13 01.25    1975    2684   56   49
14 01.26    2744    5794   80   51
15 01.27    4515    6973  106   60
16 01.28    5974    9239  132  103
17 01.29    7711   12167  170  124
18 01.30    9692   15238  213  171
19 01.31   11791   17988  259  243
20 02.01   14380   19544  304  328
21 02.02   17236   21558  361  475
22 02.03   20471   23214  425  632
23 02.04   24363   23260  491  892
#每日新增
count$chinaDayAddList
    date confirm suspect dead heal
1  01.20      77      27    0    0
2  01.21     149      53    3    0
3  01.22     131     257    8    0
4  01.23     259     680    8    6
5  01.24     444    1118   16    3
6  01.25     688    1309   15   11
7  01.26     769    3806   24    2
8  01.27    1771    2077   26    9
9  01.28    1459    3248   26   43
10 01.29    1737    4148   38   21
11 01.30    1982    4812   43   47
12 01.31    2102    5019   46   72
13 02.01    2590    4562   45   85
14 02.02    2829    5173   57  147
15 02.03    3235    5072   64  157
16 02.04    3893    3971   65  262
数据可视化
新增趋势
add <- count$chinaDayAddList
#date转化为日期格式,其他转化为数字
add$date <- as.Date(add$date,'%m.%d')
add$confirm <- as.numeric(add$confirm)
add$suspect <- as.numeric(add$suspect)
#融合数据
library(reshape2)
melt_add <- melt(add,id='date',measure = c('confirm','suspect')
head(melt_add)
        date variable value
1 2020-01-20  confirm    77
2 2020-01-21  confirm   149
3 2020-01-22  confirm   131
4 2020-01-23  confirm   259
5 2020-01-24  confirm   444
6 2020-01-25  confirm   688
#绘图
library(ggplot2)
library(ggthemes)
ggplot(melt_add) +
     aes(x = date, y = value, colour = variable) +
     geom_line(size = 1L) +
     scale_color_hue() +
     labs(x = " ", y = " ", title = "武汉肺炎疫情数据", subtitle = "新增趋势(人)", color = " ") +
     theme_hc()+
     scale_x_date(breaks = date,date_labels = '%m-%d')
累计确诊/疑似&累计治愈/死亡
daylist <- count$chinaDayList
daylist$date <- as.Date(daylist$date,'%m.%d')
daylist$confirm <- as.numeric(daylist$confirm)
daylist$suspect <- as.numeric(daylist$suspect)
daylist$dead <- as.numeric(daylist$dead)
daylist$heal <- as.numeric(daylist$heal)
#数据长宽转换
count_con_sus <- melt(daylist,id='date',measure = c('confirm','suspect'))
count_dead_heal <- melt(daylist,id='date',measure = c('dead','heal'))
#绘图
#累计确诊/疑似
ggplot(count_con_sus) +
     aes(x = date, y = value, colour = variable) +
     geom_line(size = 1L) +
     scale_color_hue() +
     labs(x = " ", y = " ", title = "武汉肺炎疫情数据", subtitle = "累计确诊/疑似(人)", color = " ") +
     theme_hc()+
     scale_x_date(date_labels = '%m-%d')
#累计治愈/死亡
ggplot(count_dead_heal) +
     aes(x = date, y = value, colour = variable) +
     geom_line(size = 1L) +
     scale_color_hue() +
     labs(x = " ", y = " ", title = "武汉肺炎疫情数据", subtitle = "累计治愈/死亡(人)", color = " ") +
     theme_hc()+
     scale_x_date(date_labels = '%m-%d')
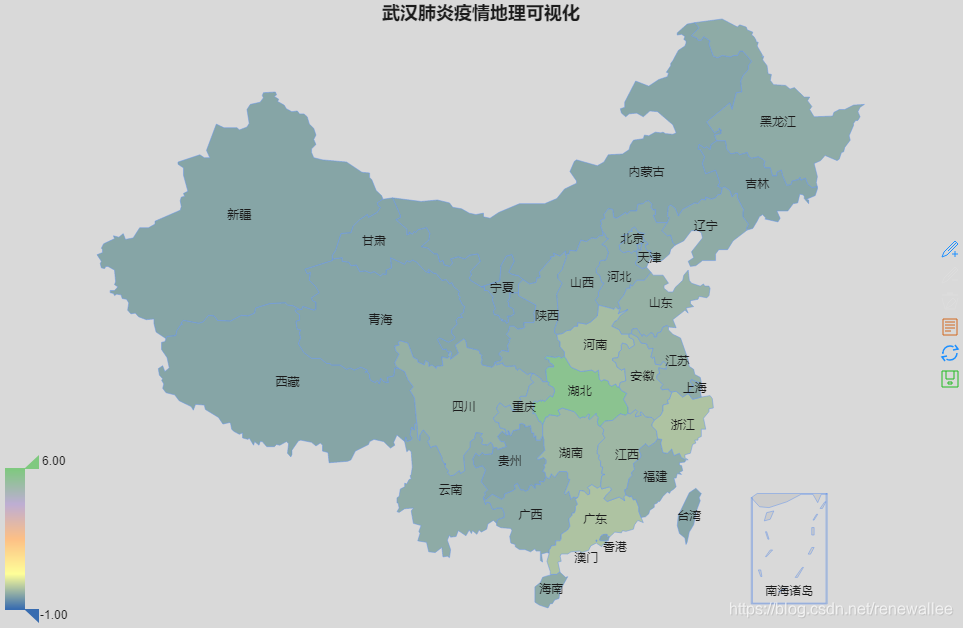
GEO 可视化
GEO 可视化包有许多这里使用最简单的 REmap 包,它是基于百度 Echarts 的 R 语言包。
install.packages("devtools")
devtools::install_github("lchiffon/REmap")
library(REmap)
#json格式数据是嵌套的,可以用View函数依次查看全球、中国省级、中国市级情况
View(count$areaTree)
china <- count$areaTree[[2]][[1]]
china <- china[c(1,3)]
china$total <- china$total$confirm
china$total <- as.numeric(china$total)
remapC(china,color = 'orange',title = '武汉肺炎疫情地理可视化')
#省际差别大,地图区分不明显。尝试一下标准化数据
library(RColorBrewer)
col <- brewer.pal(5,'Accent')
china$total <- scale(china$total)
remapC(china,color = col,title = '武汉肺炎疫情地理可视化')