前言
ELK是三款软件的简称,分别是Elasticsearch、Logstash、Kibana组成,在发展的过程中,又有新成员Beats的加入,所以就形成了Elastic Stack.所以说,ELK是旧的称呼,Elastic Stack是新的名字。
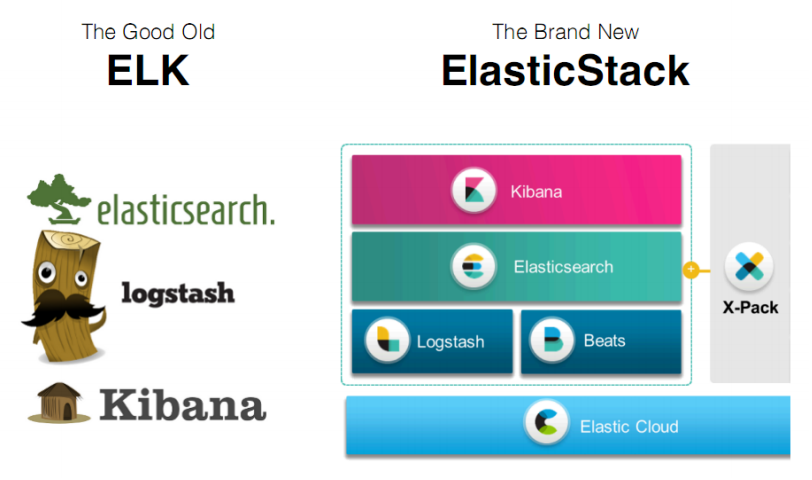
全系的Elastic Stack技术栈包括:
Elasticsearch
Elasticsearch 基于java,是个开源分布式搜索引擎,它的特点有:分布式、零配置、自动发现、索引自动分片、索引
副本机制、restful风格接口、多数据源、自动搜索负载等。
Logstash
Logstash 基于java,是一个开源的用于收集、分析和存储日志的工具。
Kibana
Kibana 基于nodejs,也是一个开源和免费的工具,Kibana可以为 Logstash 和 ElasticSearch 提供的日志分析友好的Web 界面,可以汇总、分析和搜索重要数据日志。
Beats
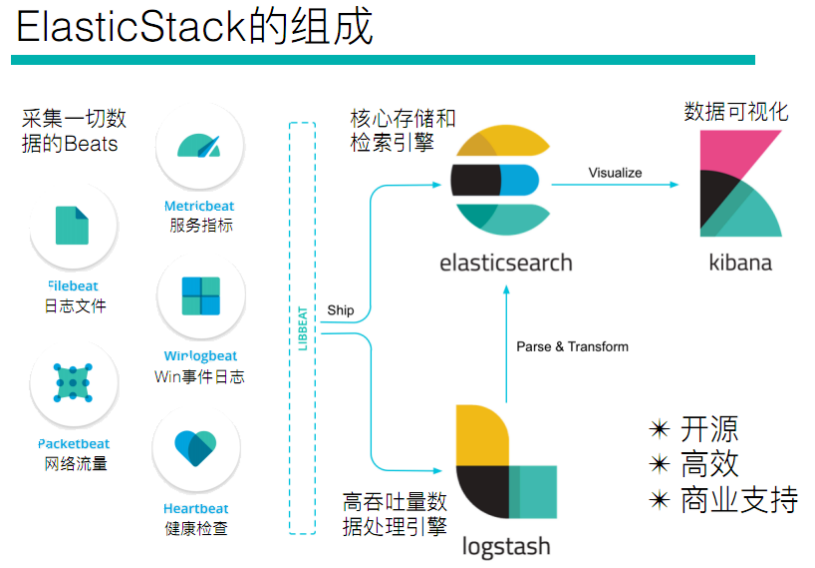
Beats是elastic公司开源的一款采集系统监控数据的代理agent,是在被监控服务器上以客户端形式运行的数据收集器的统称,可以直接把数据发送给Elasticsearch或者通过Logstash发送给Elasticsearch,然后进行后续的数据分析活动。
Beats由如下组成:
Packetbeat:是一个网络数据包分析器,用于监控、收集网络流量信息,Packetbeat嗅探服务器之间的流量,解析应用层协议,并关联到消息的处理,其支持ICMP (v4 and v6)、DNS、HTTP、Mysql、PostgreSQL、Redis、MongoDB、Memcache等协议;Filebeat:用于监控、收集服务器日志文件,其已取代 logstash forwarder;Metricbeat:可定期获取外部系统的监控指标信息,其可以监控、收集 Apache、HAProxy、MongoDB、MySQL、Nginx、PostgreSQL、Redis、System、Zookeeper等服务;Winlogbeat:用于监控、收集Windows系统的日志信息;
一、主机规划
| HostName | IP | Mem |
|---|---|---|
| ELK1 | 192.168.182.13 | 3G |
本文所有资源包,提取码:e43f
二、基础环境配置
1、时间同步
[root@localhost ~]# yum -y install ntp
[root@localhost ~]# systemctl enable ntpd
[root@localhost ~]# systemctl start ntpd
[root@localhost ~]# ntpdate -u cn.pool.ntp.org
[root@localhost ~]# hwclock --systohc
[root@localhost ~]# timedatectl set-timezone Asia/Shanghai
2、关闭防火墙 && Selinux
[root@localhost ~]# systemctl stop firewalld
[root@localhost ~]# setenforce 0
3、安装Jdk环境
运维之道 | Linux环境安装配置JDK(rpm、源码)
三、Elasticsearch 安装
1、将下载的elasticsearch包上传到服务器进行安装。
[root@linux-elk1 ~]# yum install -y elasticsearch-6.8.1.rpm
2、配置elasticsearch
[root@linux-elk1 ~]# vim /etc/elasticsearch/elasticsearch.yml

cluster.name: ELK-Cluster    #ELK的集群名称,名称相同即属于是同一个集群
node.name: elk-node1    #本机在集群内的节点名称
path.data: /elk/data    #数据存放目录
path.logs: /elk/logs    #日志保存目录
bootstrap.memory_lock: true    #服务启动的时候锁定足够的内存,防止数据写入swap
network.host: 192.168.182.13    #监听的IP地址
http.port: 9200    #服务监听的端口
discovery.zen.ping.unicast.hosts: ["192.168.182.13"]
3、修改内存限制,内存锁定需要进行配置需要2g以上内存,否则会导致无法启动elasticsearch
[root@linux-elk1 ~]# vim /usr/lib/systemd/system/elasticsearch.service
# 在[Service]下加入下面这行内容
LimitMEMLOCK=infinity

[root@linux-elk1 ~]# systemctl daemon-reload
[root@linux-elk1 ~]# vim /etc/elasticsearch/jvm.options
-Xms2g
-Xmx2g     #最小和最大内存限制
4、创建数据目录和日志目录及权限修改
[root@linux-elk1 ~]# mkdir -p /elk/{data,logs}
[root@linux-elk1 ~]# chown elasticsearch.elasticsearch /elk/ -R
5、启动elasticsearch及检查端口是否处于监听状态
[root@linux-elk1 ~]# systemctl start elasticsearch
[root@linux-elk1 ~]# netstat -nltup |grep java
tcp6       0      0 192.168.182.13:9200     :::*                    LISTEN      20774/java
tcp6       0      0 192.168.182.13:9300     :::*                    LISTEN      20774/java
6、通过浏览器访问elasticsearch端口
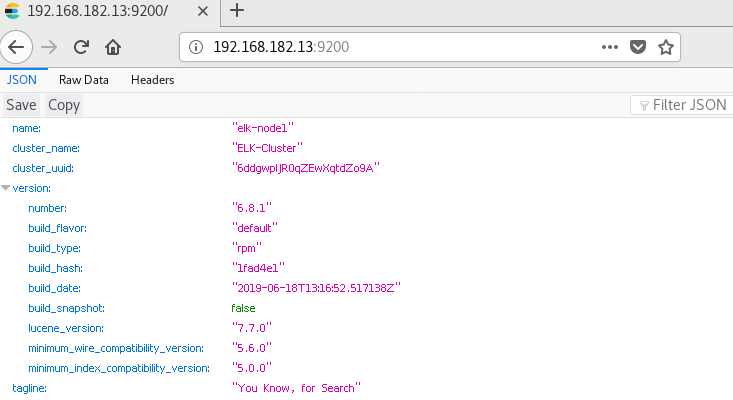
7、监控elasticsearch状态
通过shell命令获取集群状态,这里获取到的是一个json格式的返回值,例如对status进行分析,如果等于green(绿色)就是运行在正常,等于yellow(黄色)表示副本分片丢失,red(红色)表示主分片丢失。
[root@elk1 elk]# curl http://192.168.182.13:9200/_cluster/health?pretty=true
{
  "cluster_name" : "ELK-Cluster",
  "status" : "green",
  "timed_out" : false,
  "number_of_nodes" : 1,
  "number_of_data_nodes" : 1,
  "active_primary_shards" : 0,
  "active_shards" : 0,
  "relocating_shards" : 0,
  "initializing_shards" : 0,
  "unassigned_shards" : 0,
  "delayed_unassigned_shards" : 0,
  "number_of_pending_tasks" : 0,
  "number_of_in_flight_fetch" : 0,
  "task_max_waiting_in_queue_millis" : 0,
  "active_shards_percent_as_number" : 100.0
}
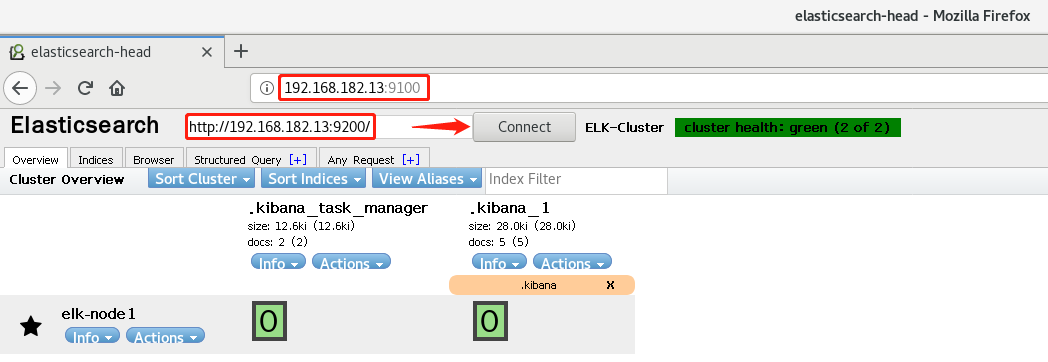
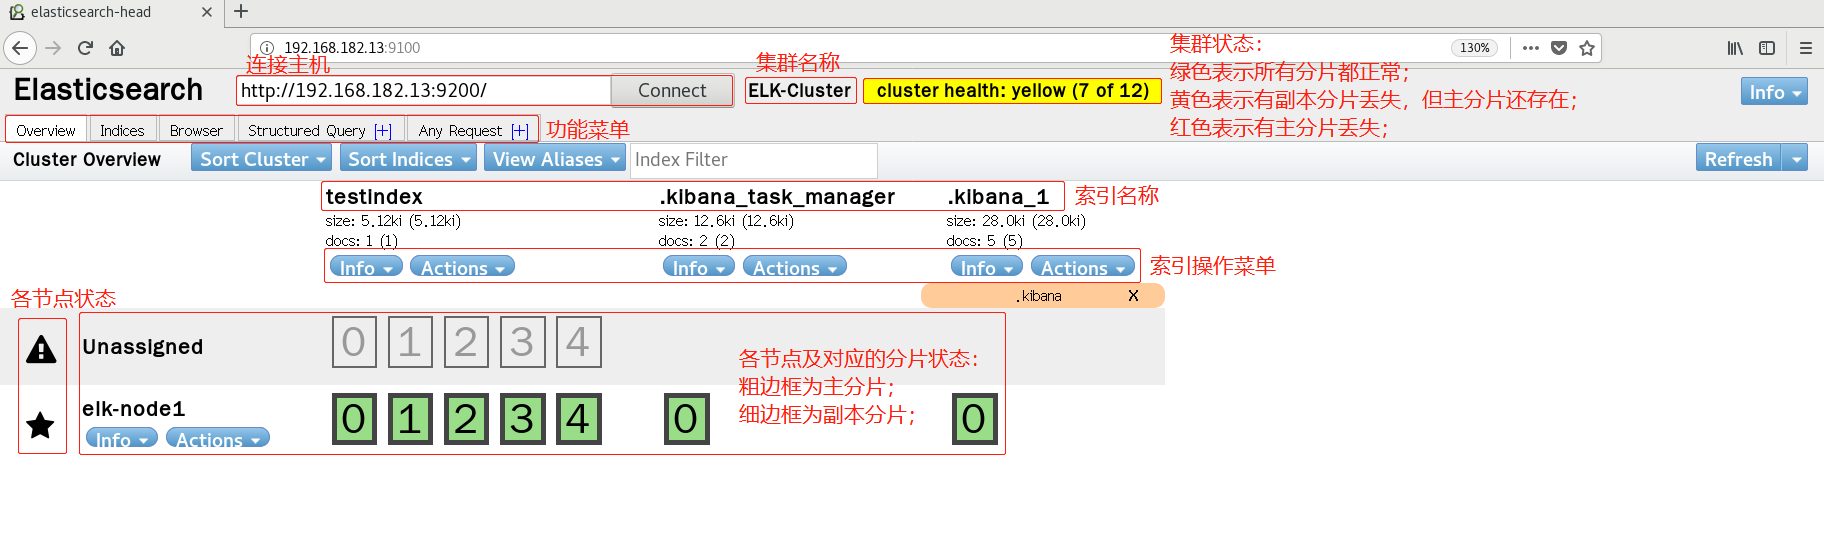
8、安装elasticsearch插件head
通过head插件来查看集群信息
- 安装npm工具
运维之道 | Centos7源码安装node和npm - 安装head插件
[root@linux-elk1 src]# tar xvzf elasticsearch-head.tar.gz
[root@linux-elk1 src]# cd elasticsearch-head/
[root@linux-elk1 elasticsearch-head]# npm run start &
- 修改elasticsearch服务配置文件,开启跨域访问支持,然后重启elasticsearch服务
[root@linux-elk1 ~]# vim /etc/elasticsearch/elasticsearch.yml

http.cors.enabled: true     #最下方添加
http.cors.allow-origin: "*"
测试
9、浏览器访问9100端口,将连接地址修改为elasticsearch地址9200
-
A、提交测试数据
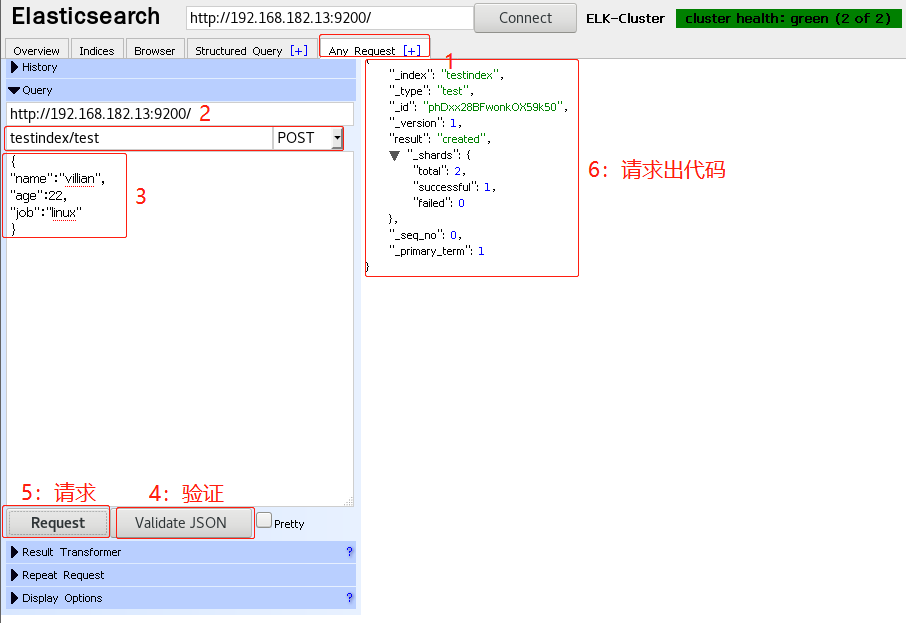
-
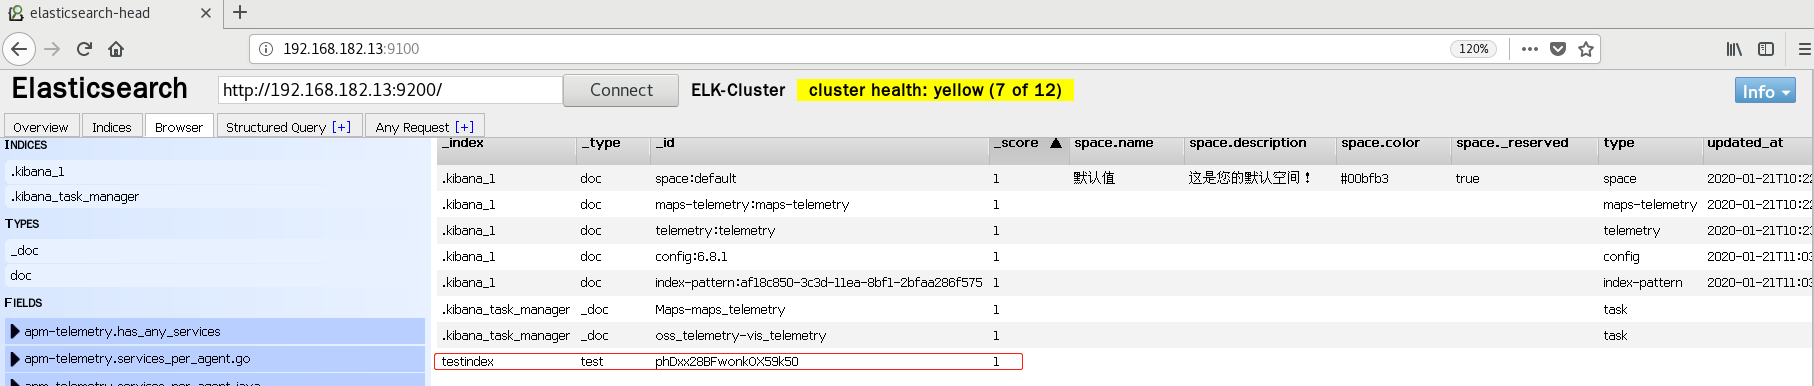
B、验证索引是否存在
- C、查看数据
- 为了方便管理elasticsearch-head插件,编写一个启动脚本
[root@linux-elk1 ~]# vim /usr/bin/elasticsearch-head

#!/bin/bash
#desc: elasticsearch-head service manager
#date: 2019

data="cd /usr/local/src/elasticsearch-head/; nohup npm run start > /dev/null 2>&1 & "

function START (){
    eval $data && echo -e "elasticsearch-head start\033[32m     ok\033[0m"
}

function STOP (){
    ps -ef |grep grunt |grep -v "grep" |awk '{print $2}' |xargs kill -s 9 > /dev/null && echo -e "elasticsearch-head stop\033[32m      ok\033[0m"
}

case "$1" in
    start)
        START
        ;;
    stop)
        STOP
        ;;
    restart)
        STOP
        sleep 3
        START
        ;;
    *)
        echo "Usage: elasticsearch-head (start|stop|restart)"
        ;;
esac

[root@linux-elk1 ~]# chmod +x /usr/bin/elasticsearch-head
四、Logstash 安装
Logstash 是一个开源的数据收集引擎,可以水平伸缩,而且logstash是整个ELK当中拥有最多插件的一个组件,其可以接收来自不同来源的数据并同意输出到指定的且可以是多个不同目的地
[root@linux-elk1 ~]# wget https://artifacts.elastic.co/downloads/logstash/logstash-6.8.1.rpm
[root@linux-elk1 ~]# yum -y localinstall logstash-6.8.1.rpm
测试logstash是否正常
1、测试标准输入输出
[root@linux-elk1 ~]# /usr/share/logstash/bin/logstash -e 'input { stdin {} } output { stdout { codec => rubydebug} }'
[root@linux-elk1 ~]# hello world
等等等等等.....

[INFO ] 2020-01-21 18:07:29.447 [Api Webserver] agent - Successfully started Logstash API endpoint {:port=>9600}
{
    "@timestamp" => 2020-01-21T10:07:28.818Z,
          "host" => "elk1",
       "message" => "hello world",
      "@version" => "1"
}
2、测试输出到文件
[root@linux-elk1 ~]# /usr/share/logstash/bin/logstash   -e 'input { stdin{} } output { file { path => "/tmp/log-%{+YYYY.MM.dd}messages.gz"}}'
hello world   #输入
[INFO ] 2019-07-04 17:33:06.065 [[main]>worker0] file - Opening file {:path=>"/tmp/log-2019.07.04messages.gz"}

[root@elk1 zwl]# tail /tmp/log-2020.01.21messages.gz
{"@version":"1","host":"elk1","message":"hello world","@timestamp":"2020-01-21T10:09:34.569Z"}
{"@version":"1","host":"elk1","message":"helo\bl\b","@timestamp":"2020-01-21T10:09:34.550Z"}
3、测试输出到elasticsearch
[root@linux-elk1 ~]# /usr/share/logstash/bin/logstash -e 'input { stdin{} } output { elasticsearch {hosts => ["192.168.1.31:9200"] index => "mytest-%{+YYYY.MM.dd}" }}'
4、elasticsearch服务器验证收到数据
[root@linux-elk1 ~]# ll /elk/data/nodes/0/_state/
总用量 28
-rw-r--r--. 1 elasticsearch elasticsearch 24522 1月  21 18:12 global-13.st
-rw-r--r--. 1 elasticsearch elasticsearch    71 1月  21 17:43 node-0.st
四、Kibana 安装
Kibana是一个通过调用elasticsearch服务器进行图形化展示搜索结果的开源项目
1、安装kibana
[root@linux-elk1 ~]# wget https://artifacts.elastic.co/downloads/kibana/kibana-6.8.1-x86_64.rpm
[root@linux-elk1 ~]# yum -y localinstall kibana-6.8.1-x86_64.rpm
[root@linux-elk1 ~]# vim /etc/kibana/kibana.yml
[root@linux-elk1 ~]# grep ^[a-Z] /etc/kibana/kibana.yml
server.port: 5601    #监听端口
server.host: "192.168.182.13"    #监听地址
elasticsearch.hosts: ["http://192.168.182.13:9200"]    #elasticsearch服务器地址
i18n.locale: "zh-CN"    #修改为中文
2、启动kibana并验证
[root@linux-elk1 ~]# systemctl start kibana
[root@linux-elk1 ~]# systemctl enable kibana
[root@linux-elk1 ~]# ss -nlt  |grep 5601
LISTEN     0      128    192.168.1.31:5601                     *:*
3、查看Kibana启动状态
五、通过logstash收集系统message日志
PS:通过logstash收集别的日志文件,前提需要logstash用户对被收集的日志文件有读的权限并对写入的文件有写的权限
1、配置logstash配置文件
[root@linux-elk1 ~]# vim /etc/logstash/conf.d/system-log.conf
input {
    file {
        path => "/var/log/messages"          #日志路径
        type => "systemlog"                  #类型,自定义,在进行多个日志收集存储时可以通过该项进行判断输出
        start_position => "beginning"        #logstash 从什么位置开始读取文件数据,默认是结束位置,也就是说 logstash 进程会以类似 tail -F 的形式运行。如果你是要导入原有数据,把这个设定改成 "beginning",logstash 进程就从头开始读取,类似 less +F 的形式运行。
        stat_interval => "2"                 #logstash 每隔多久检查一次被监听文件状态(是否有更新),默认是 1 秒
    }
}

output {
    elasticsearch {
        hosts => ["192.168.182.13:9200"]        #elasticsearch服务器地址
        index => "logstash-%{type}-%{+YYYY.MM.dd}"    #索引名称
    }
}
2、检测配置文件语法是否有错误
[root@localhost lib]# /usr/share/logstash/bin/logstash -f /etc/logstash/conf.d/system-log.conf -t
WARNING: Could not find logstash.yml which is typically located in $LS_HOME/config or /etc/logstash. You can specify the path using --path.settings. Continuing using the defaults
Could not find log4j2 configuration at path /usr/share/logstash/config/log4j2.properties. Using default config which logs errors to the console
[WARN ] 2020-01-21 20:24:22.950 [LogStash::Runner] multilocal - Ignoring the 'pipelines.yml' file because modules or command line options are specified
Configuration OK
[INFO ] 2020-01-21 20:24:39.384 [LogStash::Runner] runner - Using config.test_and_exit mode. Config Validation Result: OK. Exiting Logstash
3、修改日志文件的权限并重启logstash
[root@linux-elk1 ~]# ll /var/log/messages
-rw-------. 1 root root 786219 7月   5 10:10 /var/log/messages
#这里可以看到该日志文件是600权限,而elasticsearch是运行在elasticsearch用户下,这样elasticsearch是无法收集日志的。所以这里需要更改日志的权限,否则会报权限拒绝的错误。在日志中查看/var/log/logstash/logstash-plain.log 是否有错误。

[root@linux-elk1 ~]# chmod 644 /var/log/messages
[root@linux-elk1 ~]# systemctl  restart logstash
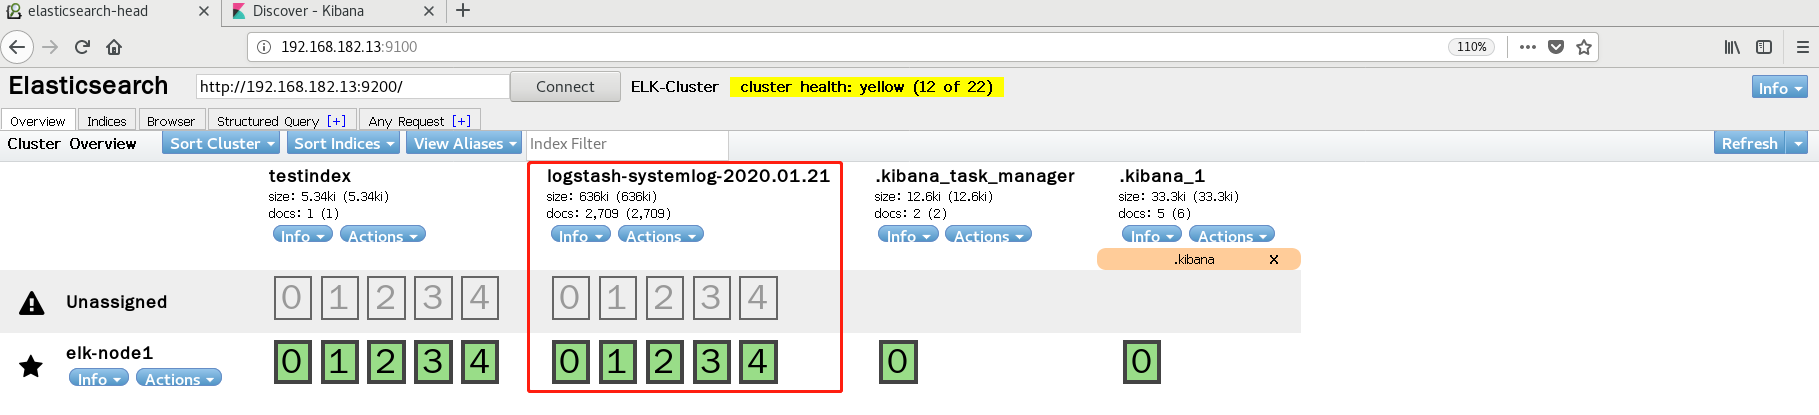
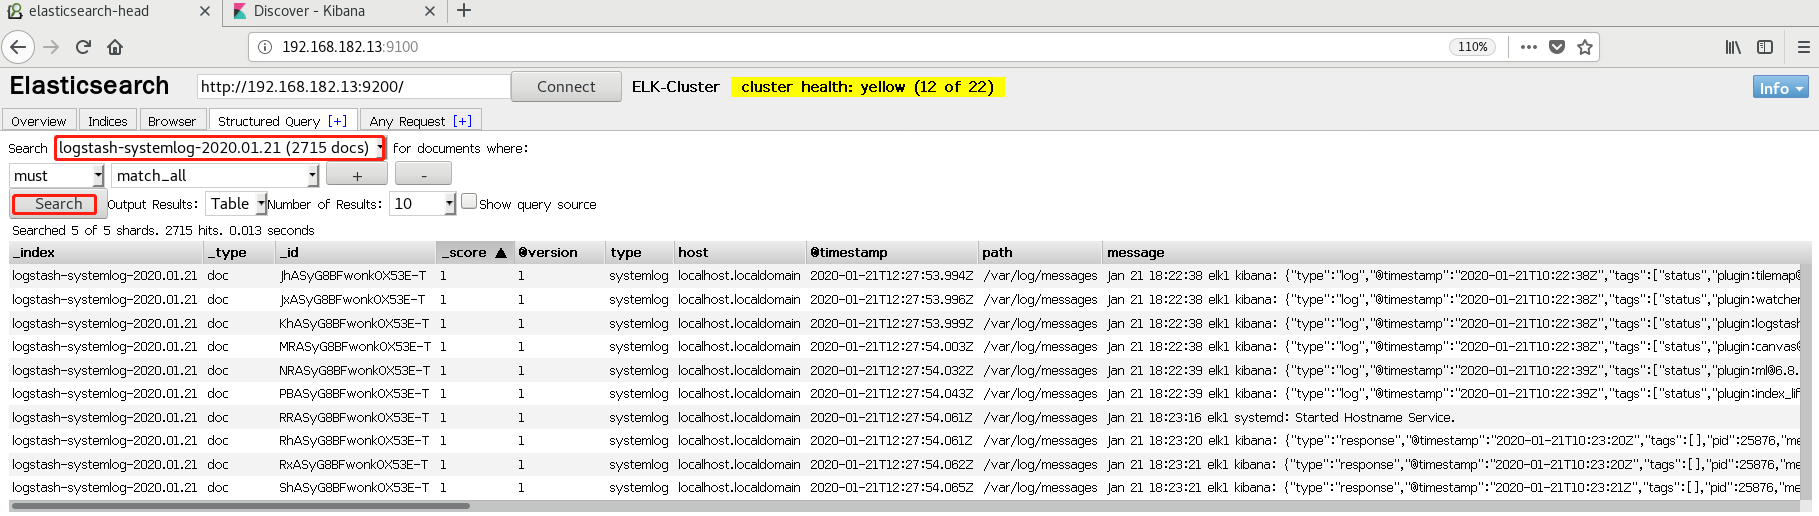
4、elasticsearch界面查看并查询
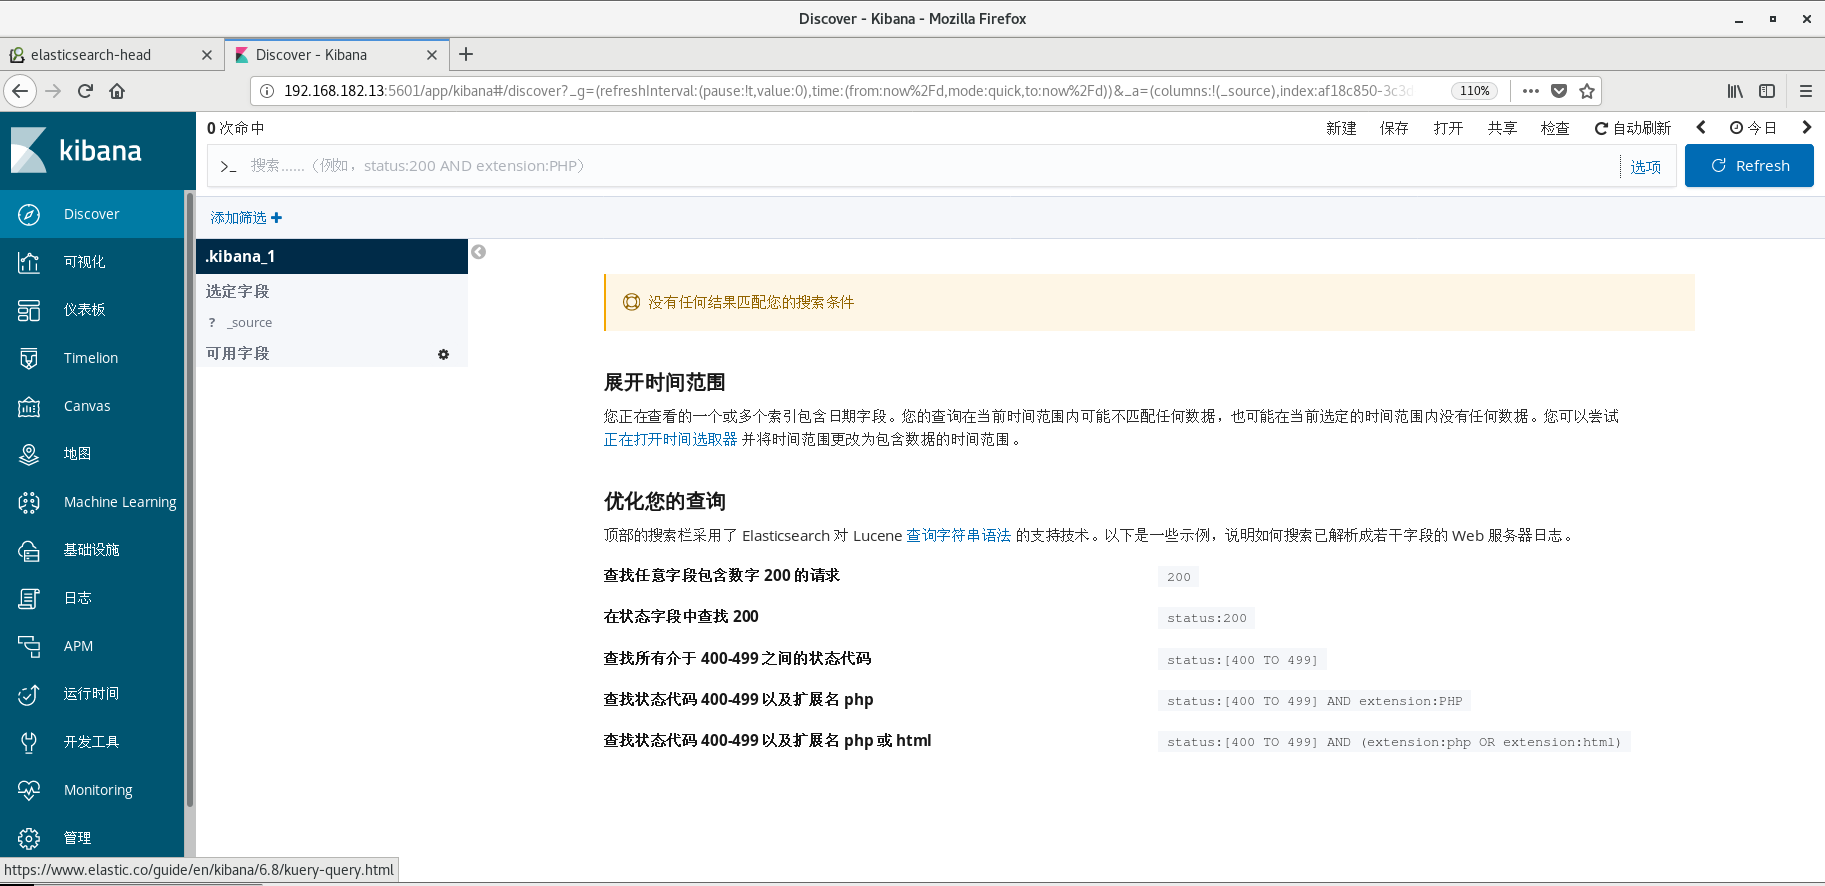
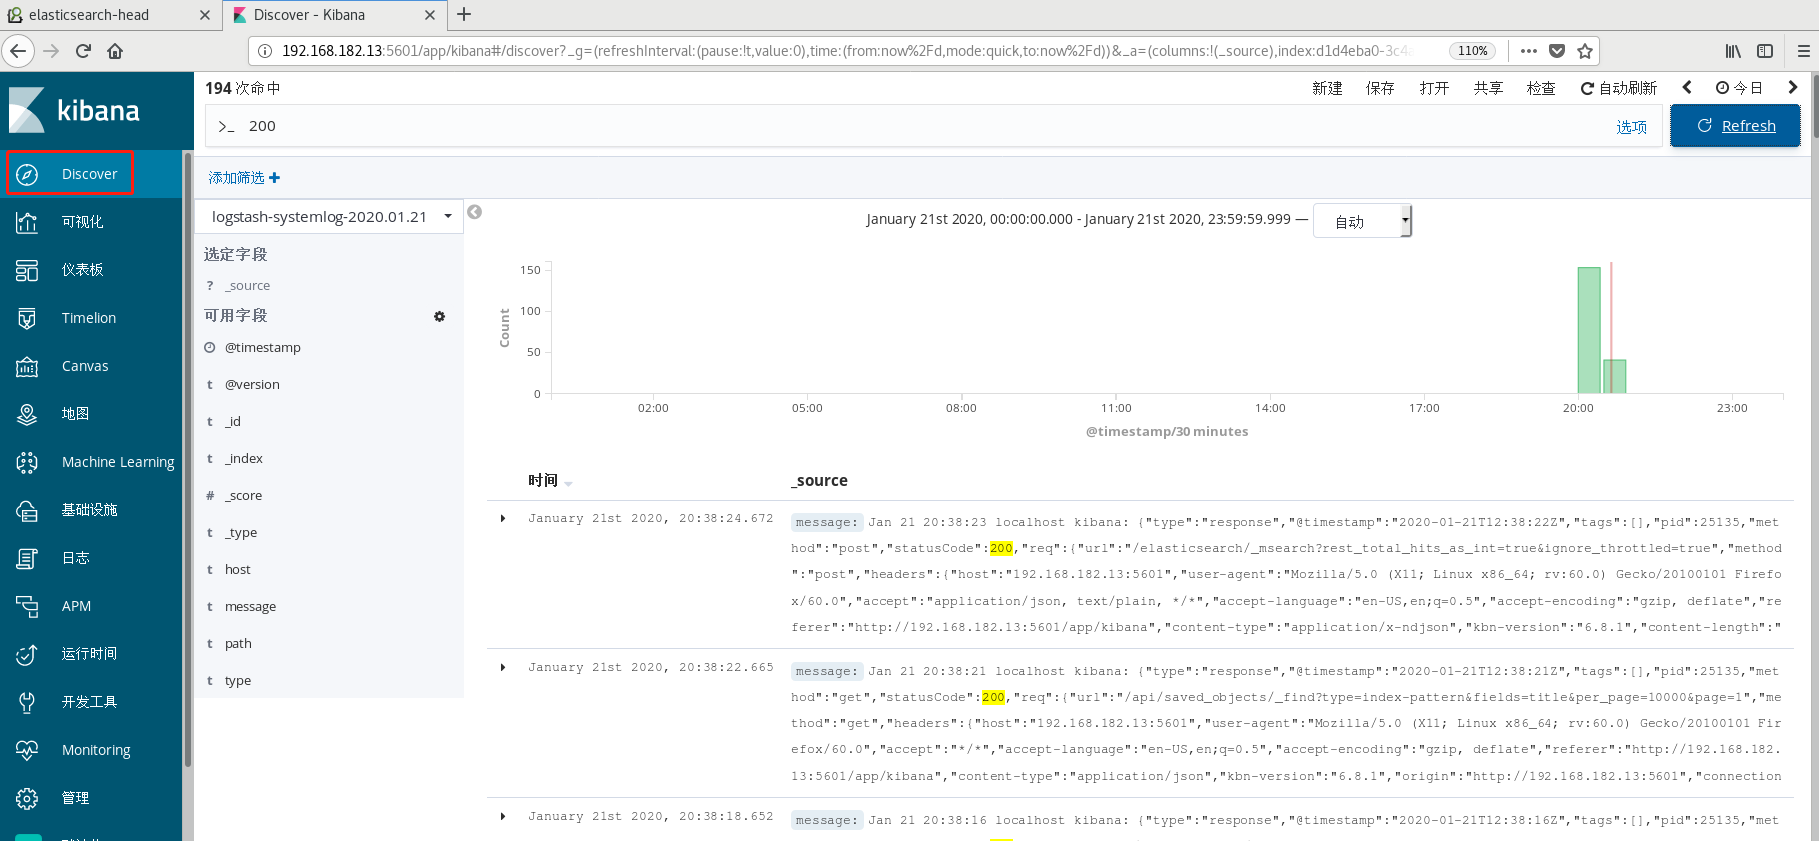
5、kibana界面创建索引并查看
-
添加索引模式

-
开始使用,并测试查询200状态
资料:https://www.cnblogs.com/yanjieli/p/11187430.html
