目录
一、Filebeat 收集 Nginx 日志实践
1.1 为什么收集 Nginx 日志
我们需要获取用户的信息,比如:来源的 IP 是哪个地域,网站的 PV、UV、状态码、访问时间等等,所以需要收集 Nginx 日志。
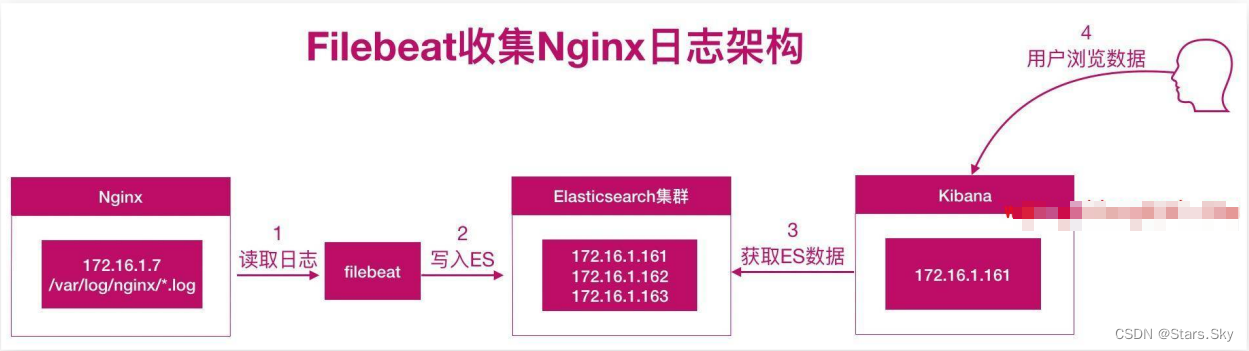
1.2 Nginx 日志收集架构图
nginx+filebeat --> elasticsearch --> kibana
1.3 Nginx 日志收集实践
1.3.1 安装 Nginx
[root@se-node3 ~]# yum -y install nginx

[root@se-node3 ~]# vim /etc/nginx/conf.d/elk.conf
server {
    listen 80;
    server_name elk.com;
    location / {
        root /opt;
        index index.html;
    }
}

[root@se-node3 ~]# echo elk123 >> /opt/index.html

[root@se-node3 ~]# systemctl enable --now nginx.service
1.3.2 配置 filebeat
配置 Filebeat,收集本机 Nginx 的日志:
[root@se-node3 ~]# vim /etc/filebeat/filebeat.yml
filebeat.inputs:
- type: log                    # 收集日志的类型
  enabled: true                # 启用日志收集
  paths:
    - /var/log/nginx/access.log           # 日志所在路径
  #include_lines: ['^WARN', '^ERR', 'sshd', '^CROND', '^systemd']

output.elasticsearch:          # 输出日志至 es
  hosts: ["192.168.170.132:9200", "192.168.170.133:9200", "192.168.170.134:9200"]   # es 集群 ip 和端口
  enabled: true
  index: "nginx-access-%{[agent.version]}-%{+yyyy.MM.dd}"     # 自定义索引名称
setup.ilm.enabled: false                                # 索引生命周期 ilm 功能默认开启,开启情况下索引名称只能为 filebeat-*
setup.template.name: "nginx"                           # 定义模板名称
setup.template.pattern: "nginx-*"                      # 定义模板的匹配索引名称

[root@se-node3 ~]# systemctl restart filebeat.service
1.3.3 kibana 展示
使用 kibana 添加索引(nginx-access*),然后展示数据:

1.4 Nginx json 日志收集实践
1.4.1 收集问题
我们实现了 Nginx 日志的收集,但是所有的数据都在 message 字段中,无法满足分析的需求,比如:
-
需要统计状态码的情况
-
统计所有请求总产生的流量大小
-
统计来源使用的客户端等等
这些是没有办法实现的。
1.4.2 解决方案
需要将日志中的每一个选项都拆分出来,拆分成 key-value 的形式,那么就需要借助 json 的格式。
-
基本写法: sky 男 20
-
json 写法: 姓名: sky 性别: 男 年龄: 20
当需要筛选年龄时,通过JSON 的方式就能很好的提取出对应指标的值。这样也便于后续的分析。
1.4.3 配置 json
将 nginx 日志格式转换成 json 格式:
# 配置 log_format 即可
[root@se-node3 ~]# vim /etc/nginx/nginx.conf
······
http {
    log_format  main  '$remote_addr - $remote_user [$time_local] "$request" '
                      '$status $body_bytes_sent "$http_referer" '
                      '"$http_user_agent" "$http_x_forwarded_for"';

    log_format  json  '{ "time_local": "$time_local", '
                          '"remote_addr": "$remote_addr", '
                          '"referer": "$http_referer", '
                          '"request": "$request", '
                          '"status": "$status", '
                          '"bytes": "$body_bytes_sent", '
                          '"browser_agent": "$http_user_agent", '
                          '"x_forwarded": "shttp_x_forwarded_for", '
                          '"up_addr": "Supstream addr", '
                          '"up_host": "$upstream_http_host", '
                          '"upstream_time": "$upstream_response_time", '
                          '"request_time": "$request_time"'
    '}';

    access_log  /var/log/nginx/access.log  json;
······
1.4.4 配置 Filebeat
nginx 修改日志为 JSON 格式后,需要修改 filebeat 配置文件:
[root@se-node3 ~]# vim /etc/filebeat/filebeat.yml
filebeat.inputs:
- type: log                    # 收集日志的类型
  enabled: true                # 启用日志收集
  paths:
    - /var/log/nginx/access.log           # 日志所在路径
  #include_lines: ['^WARN', '^ERR', 'sshd', '^CROND', '^systemd']
  json.keys_under_root: true    # 默认为 false 将 json 解析的格式存储至 messages 字段,true 则不存储至 messages 字段
  json.overwrite_keys: true    # 覆盖默认的 messages 字段,使用自定义 json 格式的 key

output.elasticsearch:          # 输出日志至 es
  hosts: ["192.168.170.132:9200", "192.168.170.133:9200", "192.168.170.134:9200"]   # es 集群 ip 和端口
  enabled: true
  index: "nginx-access-%{[agent.version]}-%{+yyyy.MM.dd}"     # 自定义索引名称
setup.ilm.enabled: false                                # 索引生命周期 ilm 功能默认开启,开启情况下索引名称只能为 filebeat-*
setup.template.name: "nginx"                           # 定义模板名称
setup.template.pattern: "nginx-*"                      # 定义模板的匹配索引名称

# 重启 nginx、Filebeat 并清空日志,重新生产 json 格式的日志
[root@se-node3 ~]# systemctl reload nginx.service
[root@se-node3 ~]# systemctl restart filebeat.service
[root@se-node3 ~]# > /var/log/nginx/access.log
1.4.5 Kibana 展示
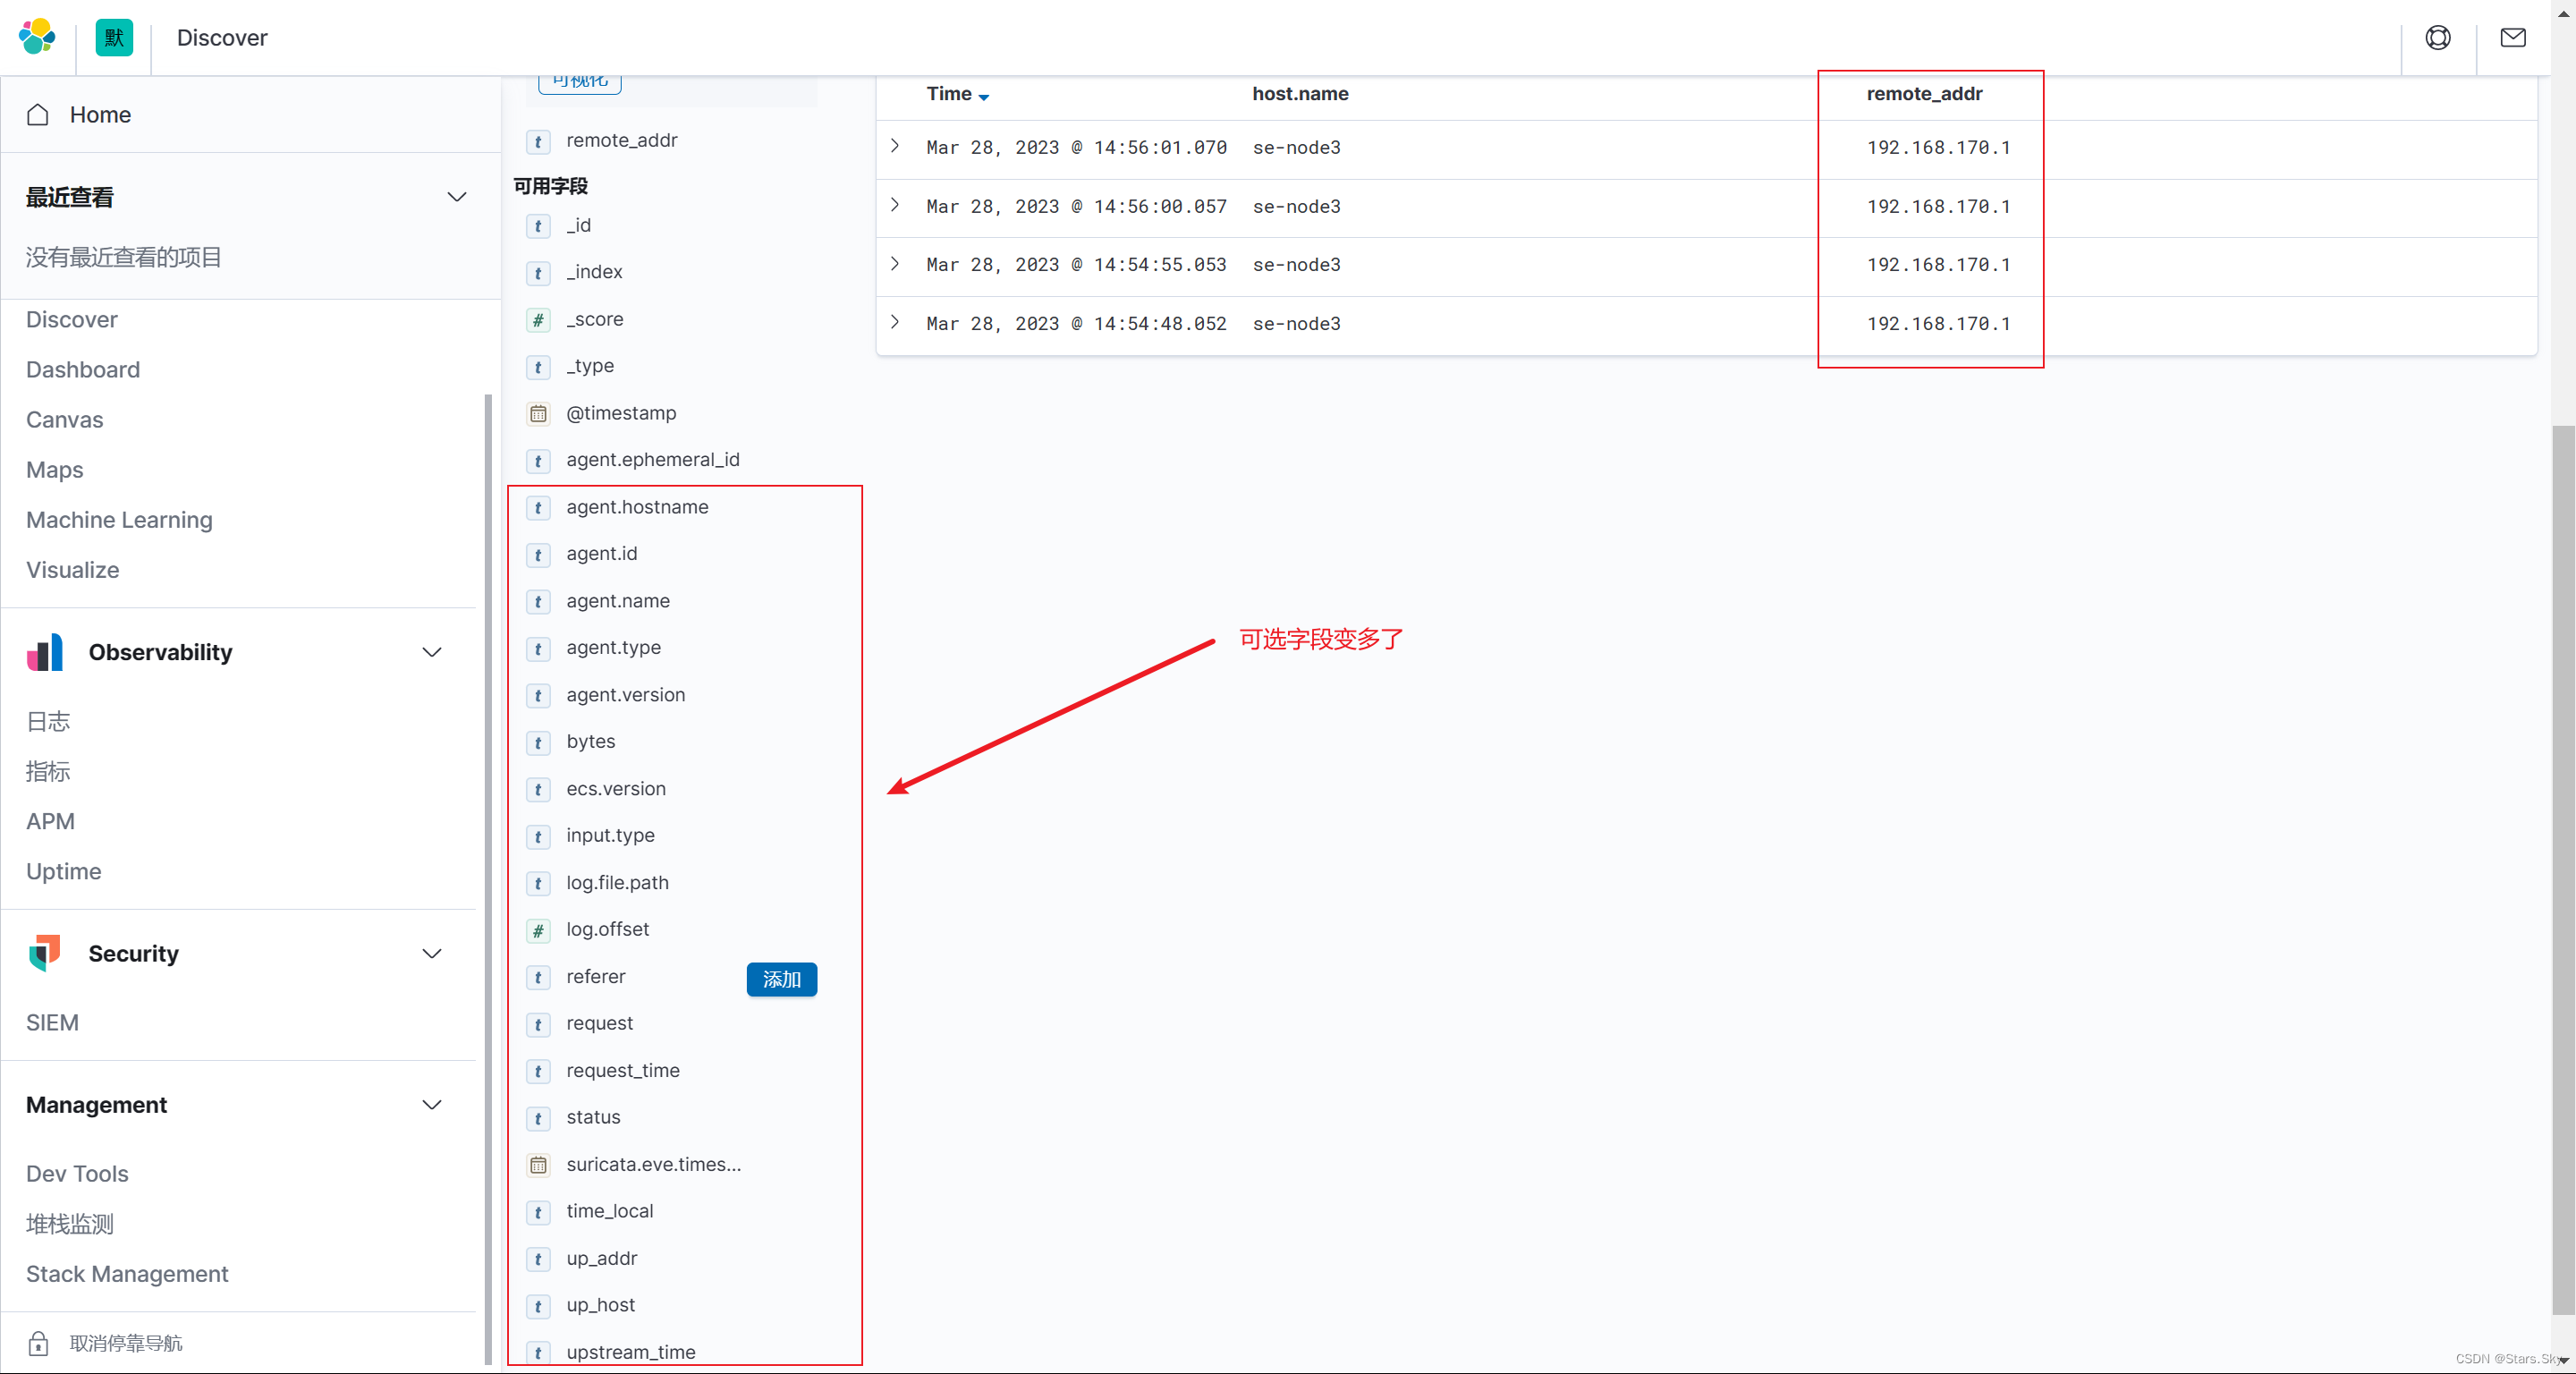
每次修改完 Filebeat 的配置文件后都需要删除 es、Kibana 的索引,并重新创建 kibana 索引模式才能生效:
1.5 Nginx 多个日志收集实践
nginx 存在访问日志和错误日志,那么如何使用 filebeat 同时收集 nginx 的访问日志、错误日志呢;我们希望的状态如下:
-
nginx 访问日志--存储--> nginx-access-7.8.1-2023.03 索引
-
nginx 错误日志--存储--> nginx-error-7.8.1-2023.03 索引

1.5.1 配置 Filebeat
配置 Filebeat 收集多个日志,需要通过 tags 标签进行区分:
[root@se-node3 ~]# vim /etc/filebeat/filebeat.yml
filebeat.inputs:
- type: log                    # 收集日志的类型
  enabled: true                # 启用日志收集
  paths:
    - /var/log/nginx/access.log           # 日志所在路径
  #include_lines: ['^WARN', '^ERR', 'sshd', '^CROND', '^systemd']
  json.keys_under_root: true
  json.overwrite_keys: true
  tags: ["nginx-access"]

- type: log                    # 收集日志的类型
  enabled: true                # 启用日志收集
  paths:
    - /var/log/nginx/error.log           # 日志所在路径
  tags: ["nginx-error"]

output.elasticsearch:          # 输出日志至 es
  hosts: ["192.168.170.132:9200", "192.168.170.133:9200", "192.168.170.134:9200"]   # es 集群 ip 和端口
  enabled: true
  indices:
    - index: "nginx-access-%{[agent.version]}-%{+yyyy.MM.dd}"     # 自定义索引名称
      when.contains:
        tags: "nginx-access"    # tags 为 nginx-access 的日志存储至 nginx-access-* 索引
    - index: "nginx-error-%{[agent.version]}-%{+yyyy.MM.dd}"     # 自定义索引名称
      when.contains:
        tags: "nginx-error"    # tags 为 nginx-error 的日志存储至 nginx-error-* 索引

setup.ilm.enabled: false                                # 索引生命周期 ilm 功能默认开启,开启情况下索引名称只能为 filebeat-*
setup.template.name: "nginx"                           # 定义模板名称
setup.template.pattern: "nginx-*"                      # 定义模板的匹配索引名称

[root@se-node3 ~]# systemctl restart filebeat.service
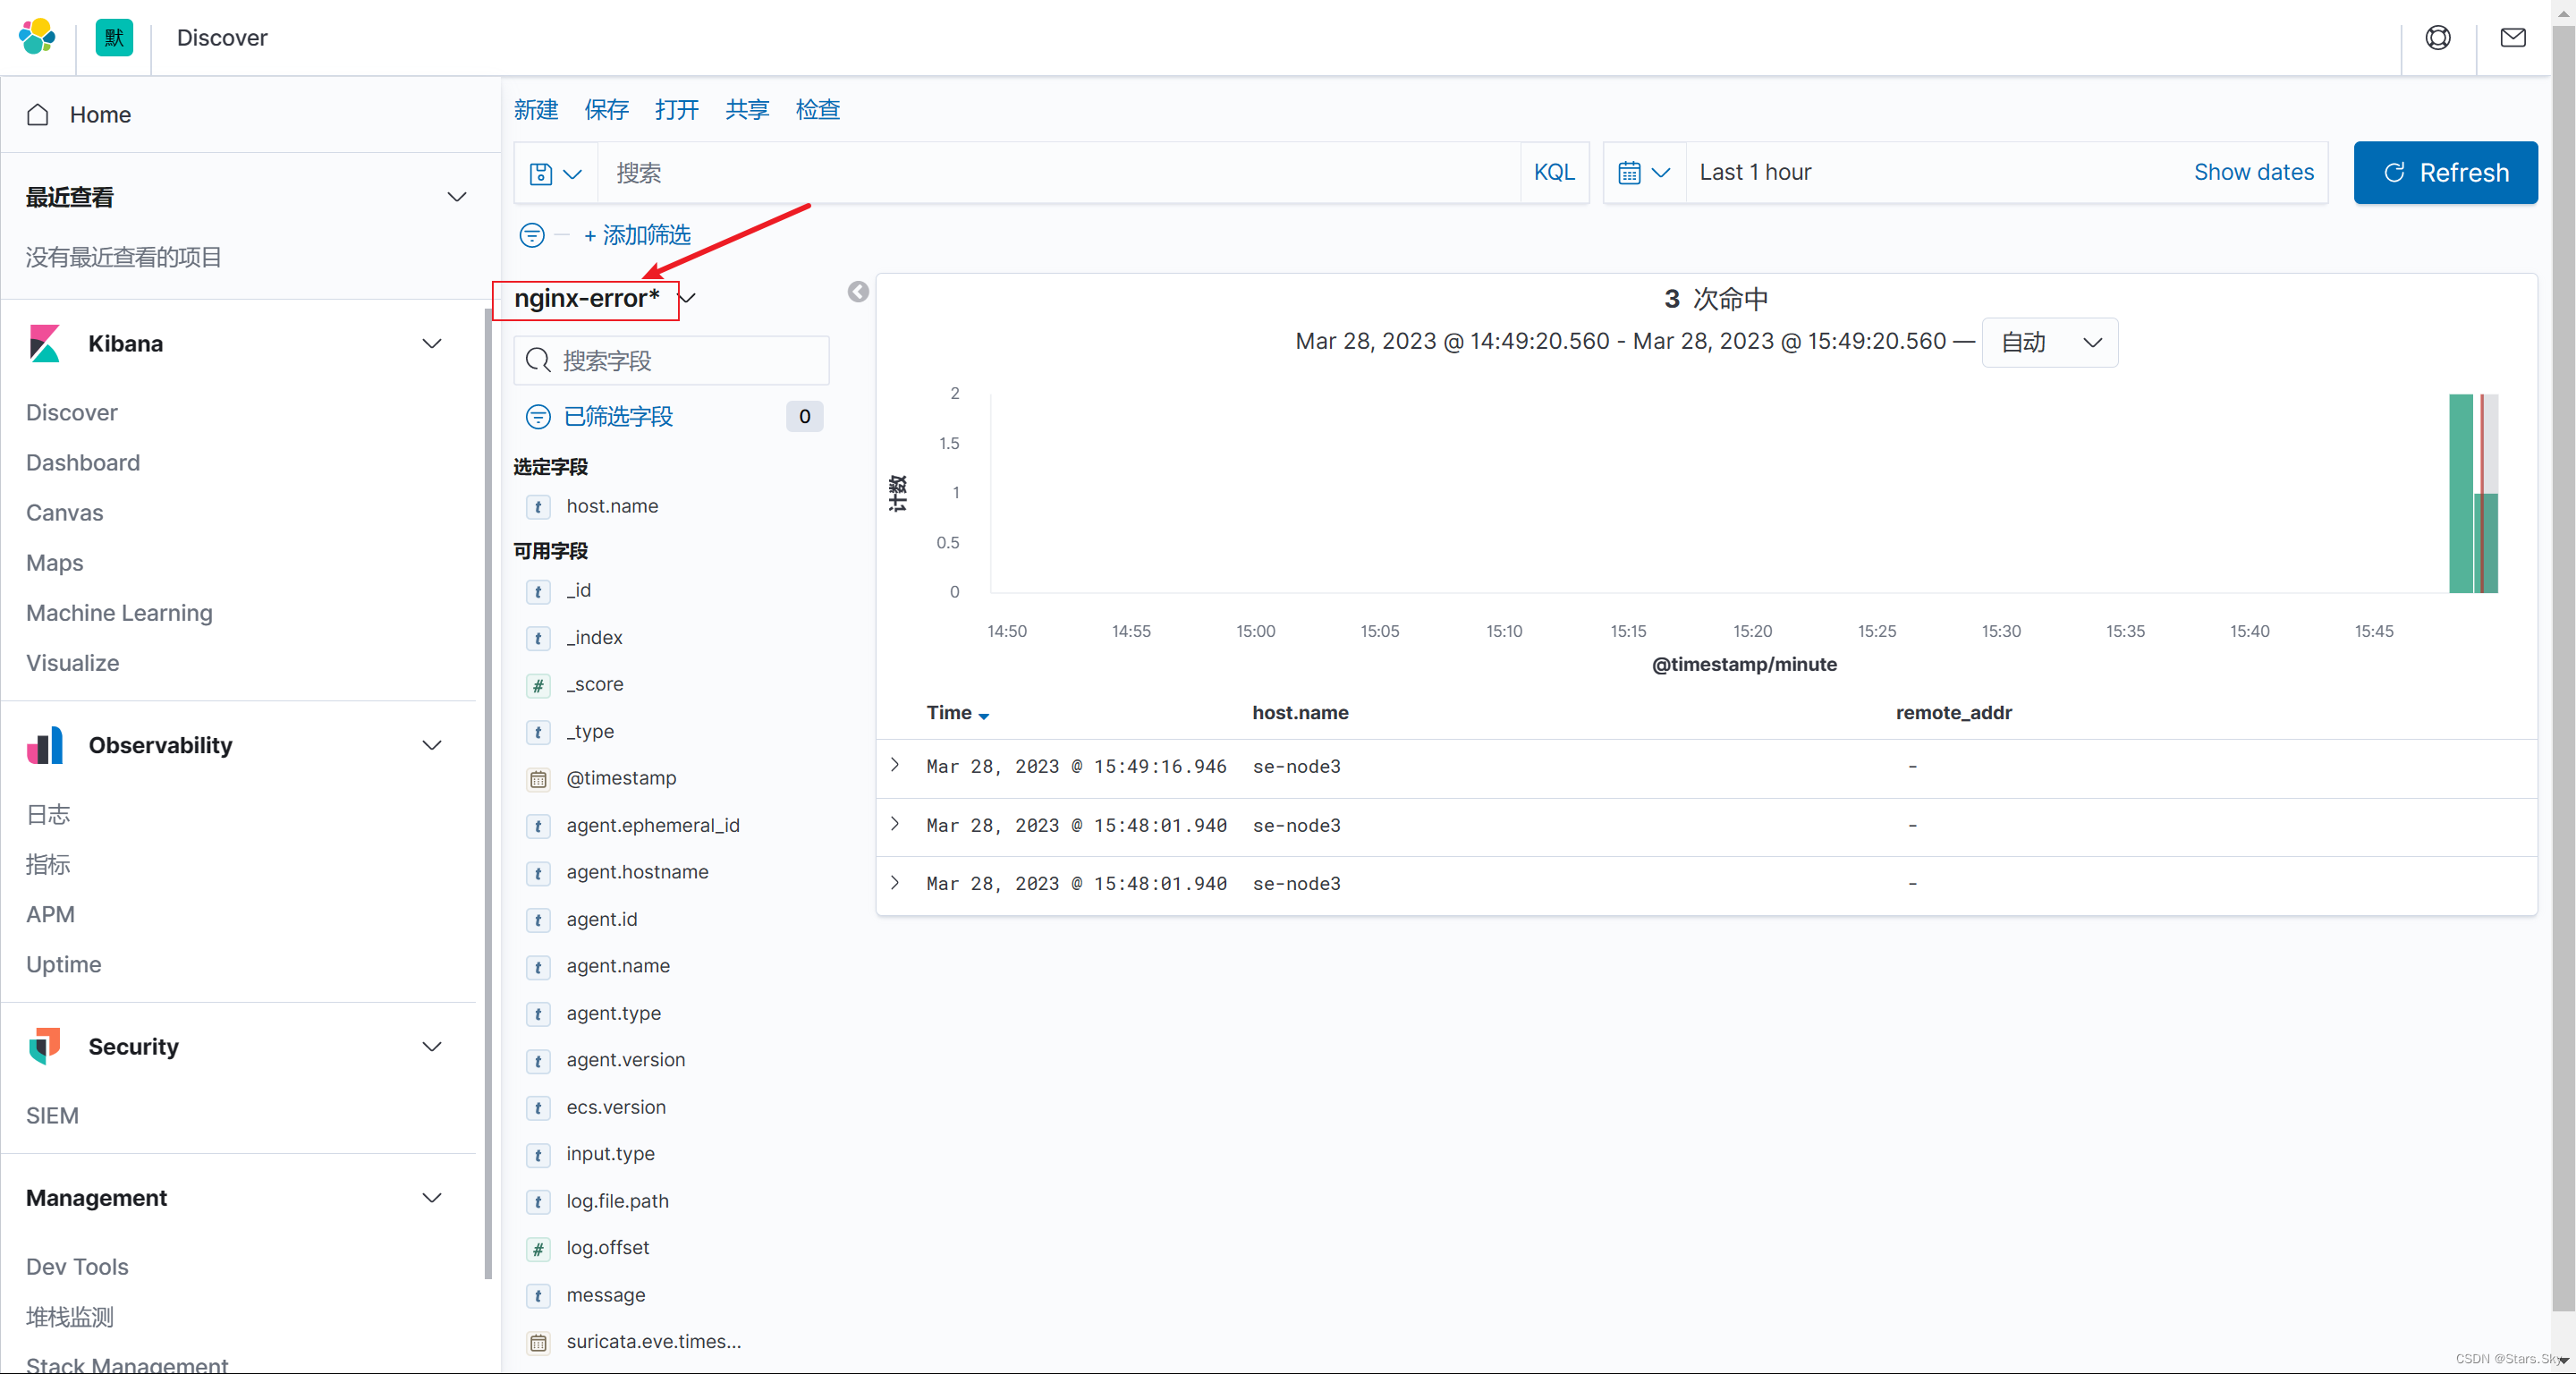
1.5.2 kibana 展示
使用 kibana 添 nginx 错误日志索引,然后展示数:
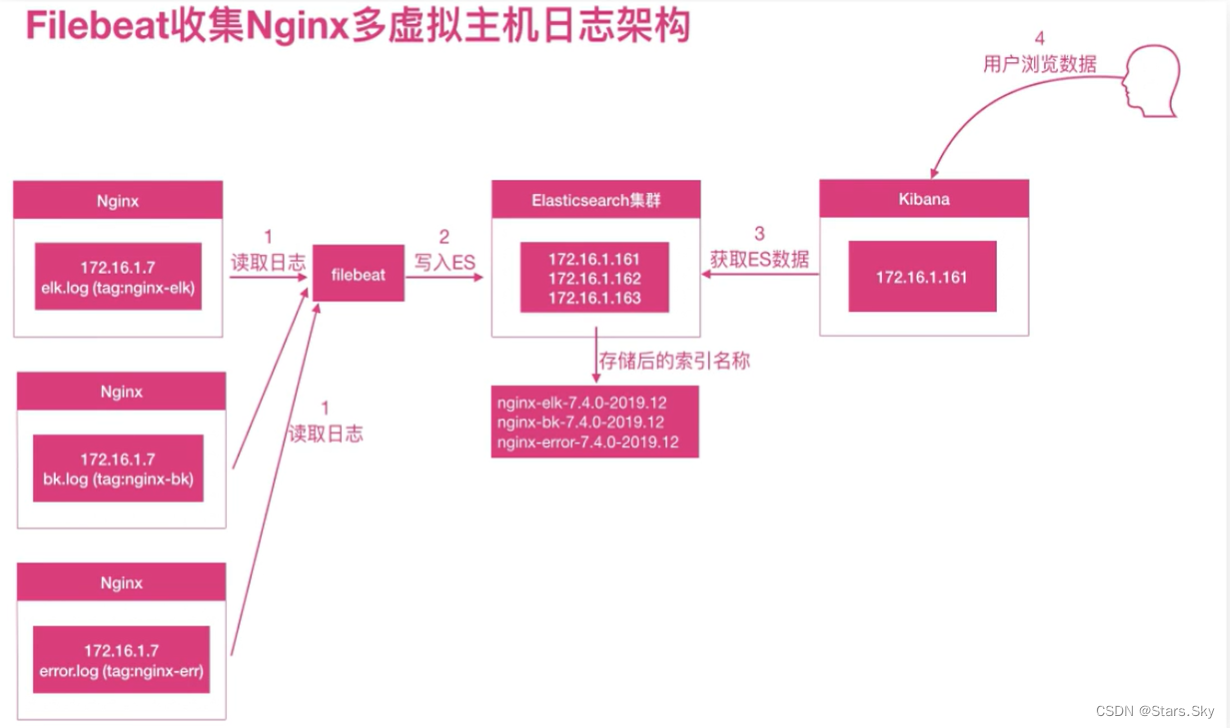
1.6 Nginx 多虚拟主机收集实践
Nginx 如果有多个站点,filebeat 该如何收集多个域名的访问日志。
1.6.1 nginx 配置多站点
[root@se-node3 ~]# vim /etc/nginx/conf.d/elk.conf
server {
    listen 80;
    server_name elk.com;
    access_log /var/log/nginx/elk.log json;
    location / {
        root /opt;
        index index.html;
    }
}

[root@se-node3 ~]# cp /etc/nginx/conf.d/elk.conf /etc/nginx/conf.d/kk.conf
[root@se-node3 ~]# vim /etc/nginx/conf.d/kk.conf
server {
    listen 86;
    server_name kk.com;
    access_log /var/log/nginx/kk.log json;
    location / {
        root /opt;
        index index.html;
    }
}

[root@se-node3 ~]# systemctl reload nginx.service
1.6.2 配置 Filebeat
[root@se-node3 ~]# vim /etc/filebeat/filebeat.yml
filebeat.inputs:
- type: log                    # 收集日志的类型
  enabled: true                # 启用日志收集
  paths:
    - /var/log/nginx/access.log           # 日志所在路径
  #include_lines: ['^WARN', '^ERR', 'sshd', '^CROND', '^systemd']
  json.keys_under_root: true
  json.overwrite_keys: true
  tags: ["nginx-access"]

- type: log                    # 收集日志的类型
  enabled: true                # 启用日志收集
  paths:
    - /var/log/nginx/elk.log           # 日志所在路径
  json.keys_under_root: true
  json.overwrite_keys: true
  tags: ["nginx-elk-access"]

- type: log                    # 收集日志的类型
  enabled: true                # 启用日志收集
  paths:
    - /var/log/nginx/kk.log           # 日志所在路径
  json.keys_under_root: true
  json.overwrite_keys: true
  tags: ["nginx-kk-access"]

- type: log                    # 收集日志的类型
  enabled: true                # 启用日志收集
  paths:
    - /var/log/nginx/error.log           # 日志所在路径
  tags: ["nginx-error"]

output.elasticsearch:          # 输出日志至 es
  hosts: ["192.168.170.132:9200", "192.168.170.133:9200", "192.168.170.134:9200"]   # es 集群 ip 和端口
  enabled: true
  indices:
    - index: "nginx-access-%{[agent.version]}-%{+yyyy.MM.dd}"     # 自定义索引名称
      when.contains:
        tags: "nginx-access"
    - index: "nginx-elk-access-%{[agent.version]}-%{+yyyy.MM.dd}"     # 自定义索引名称
      when.contains:
        tags: "nginx-elk-access"
    - index: "nginx-kk-access-%{[agent.version]}-%{+yyyy.MM.dd}"     # 自定义索引名称
      when.contains:
        tags: "nginx-kk-access"
    - index: "nginx-error-%{[agent.version]}-%{+yyyy.MM.dd}"     # 自定义索引名称
      when.contains:
        tags: "nginx-error"

setup.ilm.enabled: false                                # 索引生命周期 ilm 功能默认开启,开启情况下索引名称只能为 filebeat-*
setup.template.name: "nginx"                           # 定义模板名称
setup.template.pattern: "nginx-*"                      # 定义模板的匹配索引名称

[root@se-node3 ~]# systemctl restart filebeat.service
1.6.3 kibana 展示
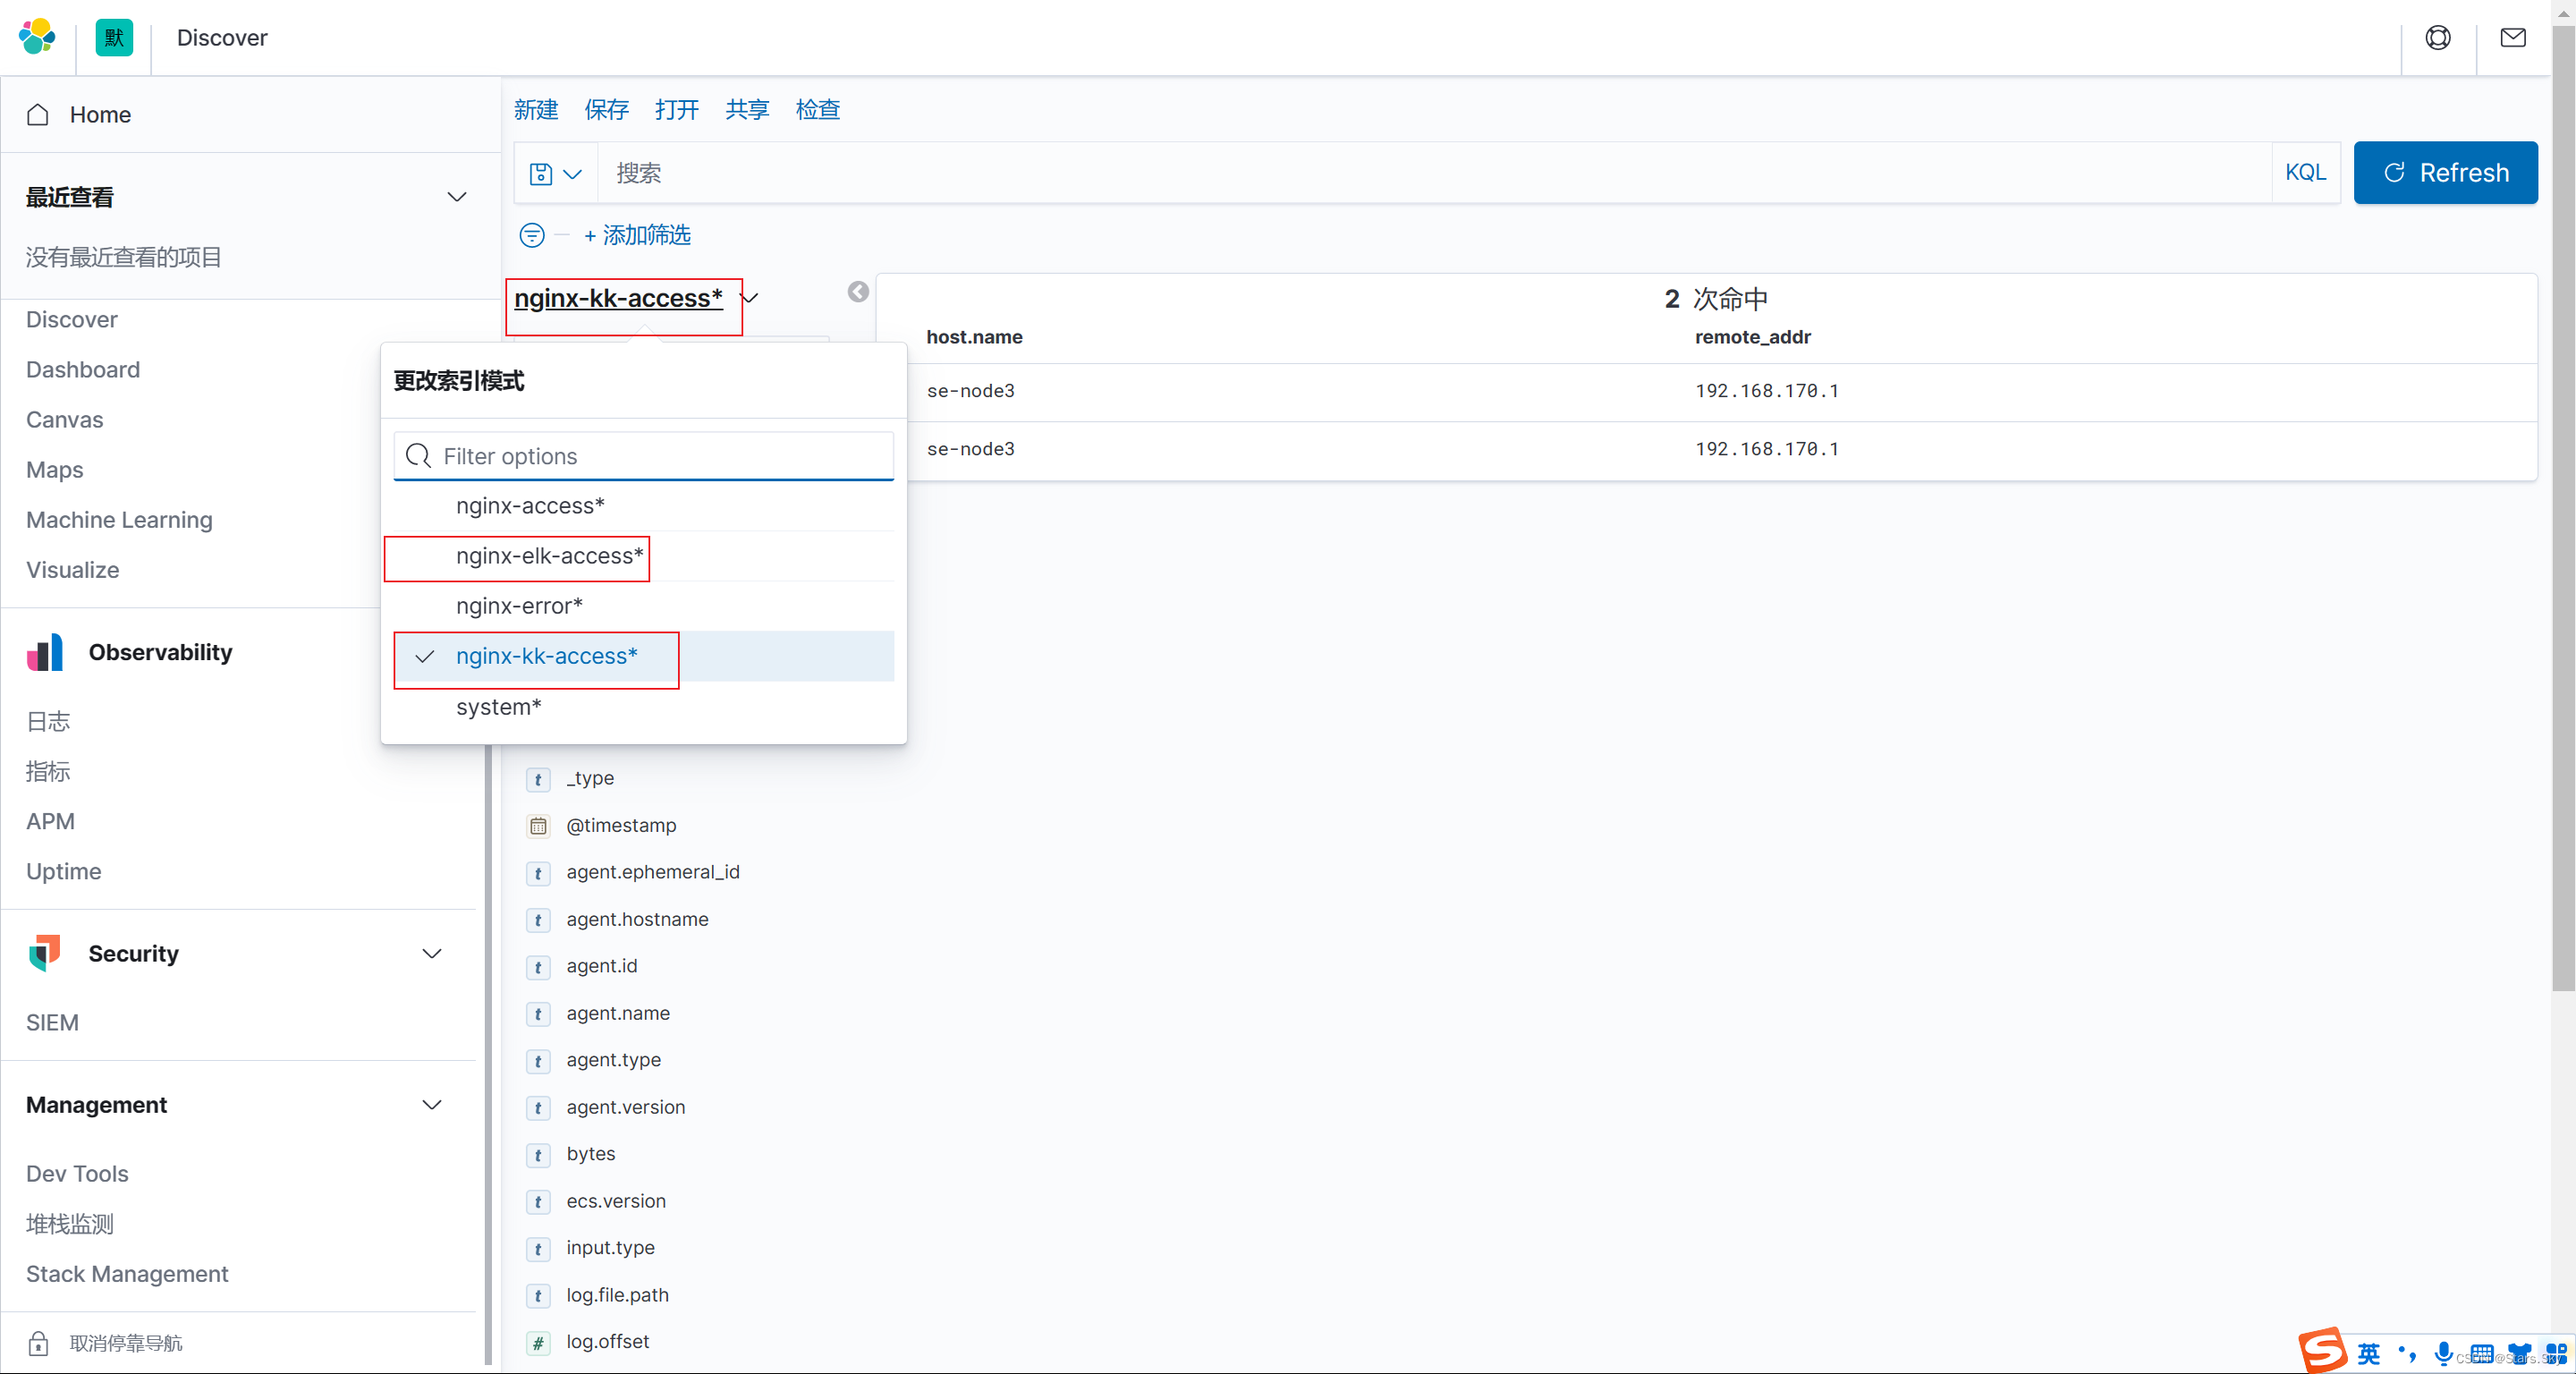
创建 Kibana 索引模式:
二、Filebeat 收集 Tomcat 日志
2.1 Tomcat 日志收集思路
前面已经收集过 Nginx 日志,所以下面收集 java 类型的 Tomcat 日志就比较简单了,我们只需要安装好 tomcat,然后将 tomcat 修改为 json 格式日志,在使用 filebeat 进行收集即可。
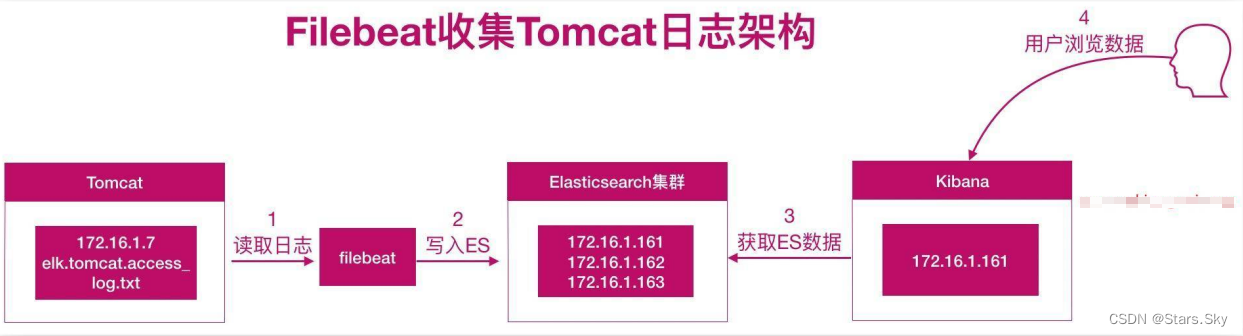
2.2 Tomcat 日志收集架构图
tomcat+filebeat --> elasticsearch --> kibana
2.3 Tomcat 访问日志收集实践
2.3.1 安装 Tomcat
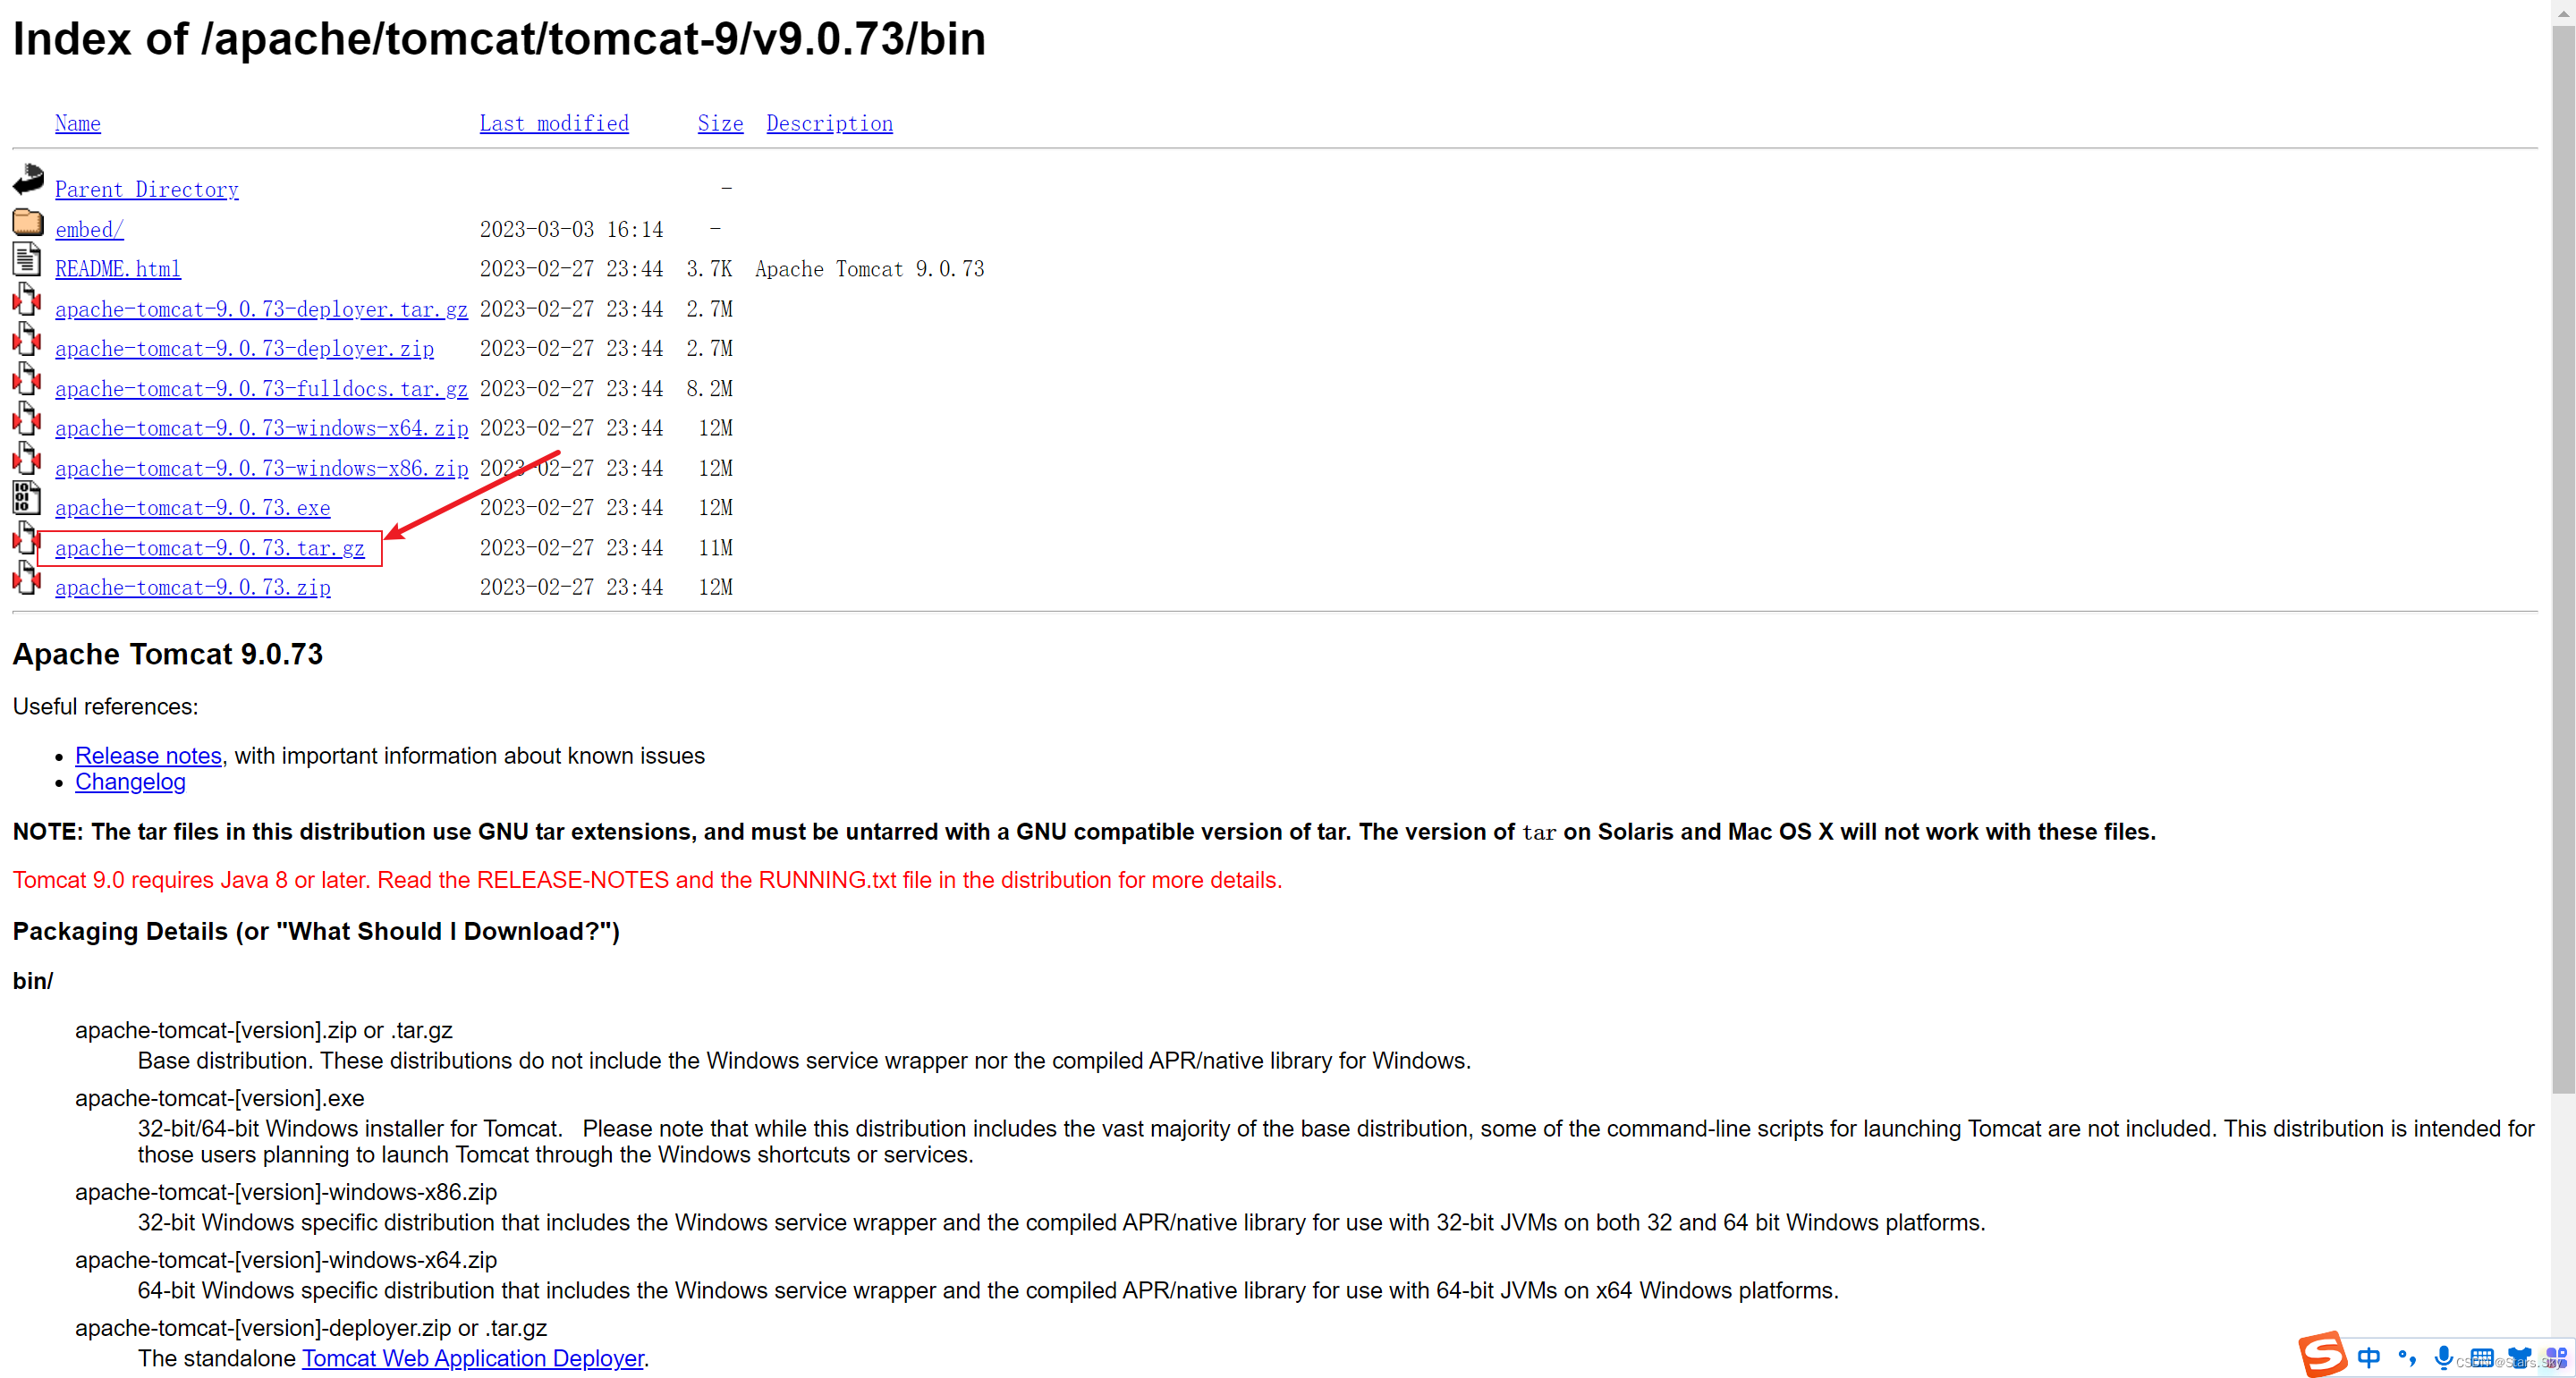
Tomcat 下载地址:Index of /apache/tomcat/tomcat-9/v9.0.73/bin
[root@se-node3 ~]# yum install -y java
[root@se-node3 ~]# tar -zxvf apache-tomcat-9.0.73.tar.gz
[root@se-node3 ~]# mv apache-tomcat-9.0.73 /usr/local/tomcat-9.0.73
2.3.2 修改日志为 json 格式
修改默认网站日志格式为 json:
[root@se-node3 ~]# vim /usr/local/tomcat-9.0.73/conf/server.xml
<Valve className="org.apache.catalina.valves.AccessLogValve" directory="logs"
prefix="localhost_access_log" suffix=".txt"
pattern="{"clientip":"%h","clientuser":"%1","authenticated":"%u","AccessTime":"%t","method":"%r","status":"%s","sendBytes":"%b","Query?string":"%q","partner":"%{Referer}i","Agentversion":"%{user-Agent}i"}" />
</Host>
[root@se-node3 ~]# /usr/local/tomcat-9.0.73/bin/startup.sh
2.3.3 配置 Filebeat
# 把前面的 nginx 配置备份一下
[root@se-node3 ~]# cp /etc/filebeat/filebeat.yml /etc/filebeat/filebeat.yml_nginx

[root@se-node3 ~]# vim /etc/filebeat/filebeat.yml
filebeat.inputs:
- type: log                    # 收集日志的类型
  enabled: true                # 启用日志收集
  paths:
    - /usr/local/tomcat-9.0.73/logs/localhost_access_log*.txt           # 日志所在路径
  #include_lines: ['^WARN', '^ERR', 'sshd', '^CROND', '^systemd']
  json.keys_under_root: true
  json.overwrite_keys: true
  tags: ["tomcat-access"]

output.elasticsearch:          # 输出日志至 es
  hosts: ["192.168.170.132:9200", "192.168.170.133:9200", "192.168.170.134:9200"]   # es 集群 ip 和端口
  enabled: true
  index: "tomcat-access-%{[agent.version]}-%{+yyyy.MM.dd}"     # 自定义索引名称

setup.ilm.enabled: false                                # 索引生命周期 ilm 功能默认开启,开启情况下索引名称只能为 filebeat-*
setup.template.name: "tomcat"                           # 定义模板名称
setup.template.pattern: "tomcat-*"                      # 定义模板的匹配索引名称

[root@se-node3 ~]# systemctl restart filebeat.service
2.3.4 配置 kibana
使用 kibana 添加索引,进行数据展示:

2.4 Tomcat 错误日志收集实践
2.4.1 错误日志特点
JAVA 错误日志的特点
-
报错信息比较多
-
报错信息分很多行
2.4.2 错误日志收集思路
例1:Tomcat 正常日志是以“日期”开头的。而报错日志中间的错误都不是以“日期”开头的。所以我们可以匹配以“日期”开头的一直到下一个日期出现则为一个事件日志。
例2:Elasticsearch 正常日志是以"[]"开头的。而报错日志中间的错误信息不是以"[]"开头,所以可以匹配以"["开头的行,一直到下一个"["开头的出现则为一个事件日志。
官方多行匹配方式:Manage multiline messages | Filebeat Reference [7.4] | Elastic
2.4.3 错误日志收集实践
配置 filebeat 收集 Tomcat 错误日志:
[root@se-node3 ~]# vim /etc/filebeat/filebeat.yml
filebeat.inputs:
- type: log                    # 收集日志的类型
  enabled: true                # 启用日志收集
  paths:
    - /usr/local/tomcat-9.0.73/logs/localhost_access_log*.txt           # 日志所在路径
  #include_lines: ['^WARN', '^ERR', 'sshd', '^CROND', '^systemd']
  json.keys_under_root: true
  json.overwrite_keys: true
  tags: ["tomcat-access"]

- type: log                    # 收集日志的类型
  enabled: true                # 启用日志收集
  paths:
    - /usr/local/tomcat-9.0.73/logs/catalina.out           # 日志所在路径
  tags: ["tomcat-error"]
  multiline.pattern: '^\d{2}'    # 匹配以两个数字开头的行
  multiline.negate: true
  multiline.match: after
  multiline.max_lines: 1000       # 默认最大合并行为 500,可根据实际情况调整

output.elasticsearch:          # 输出日志至 es
  hosts: ["192.168.170.132:9200", "192.168.170.133:9200", "192.168.170.134:9200"]   # es 集群 ip 和端口
  enabled: true
  indices:
    - index: "tomcat-access-%{[agent.version]}-%{+yyyy.MM.dd}"     # 自定义索引名称
      when.contains:
        tags: "tomcat-access"
    - index: "tomcat-error-%{[agent.version]}-%{+yyyy.MM.dd}"     # 自定义索引名称
      when.contains:
        tags: "tomcat-error"

setup.ilm.enabled: false                                # 索引生命周期 ilm 功能默认开启,开启情况下索引名称只能为 filebeat-*
setup.template.name: "tomcat"                           # 定义模板名称
setup.template.pattern: "tomcat-*"                      # 定义模板的匹配索引名称

[root@se-node3 ~]# systemctl restart filebeat.service
2.4.4 kibana 展示
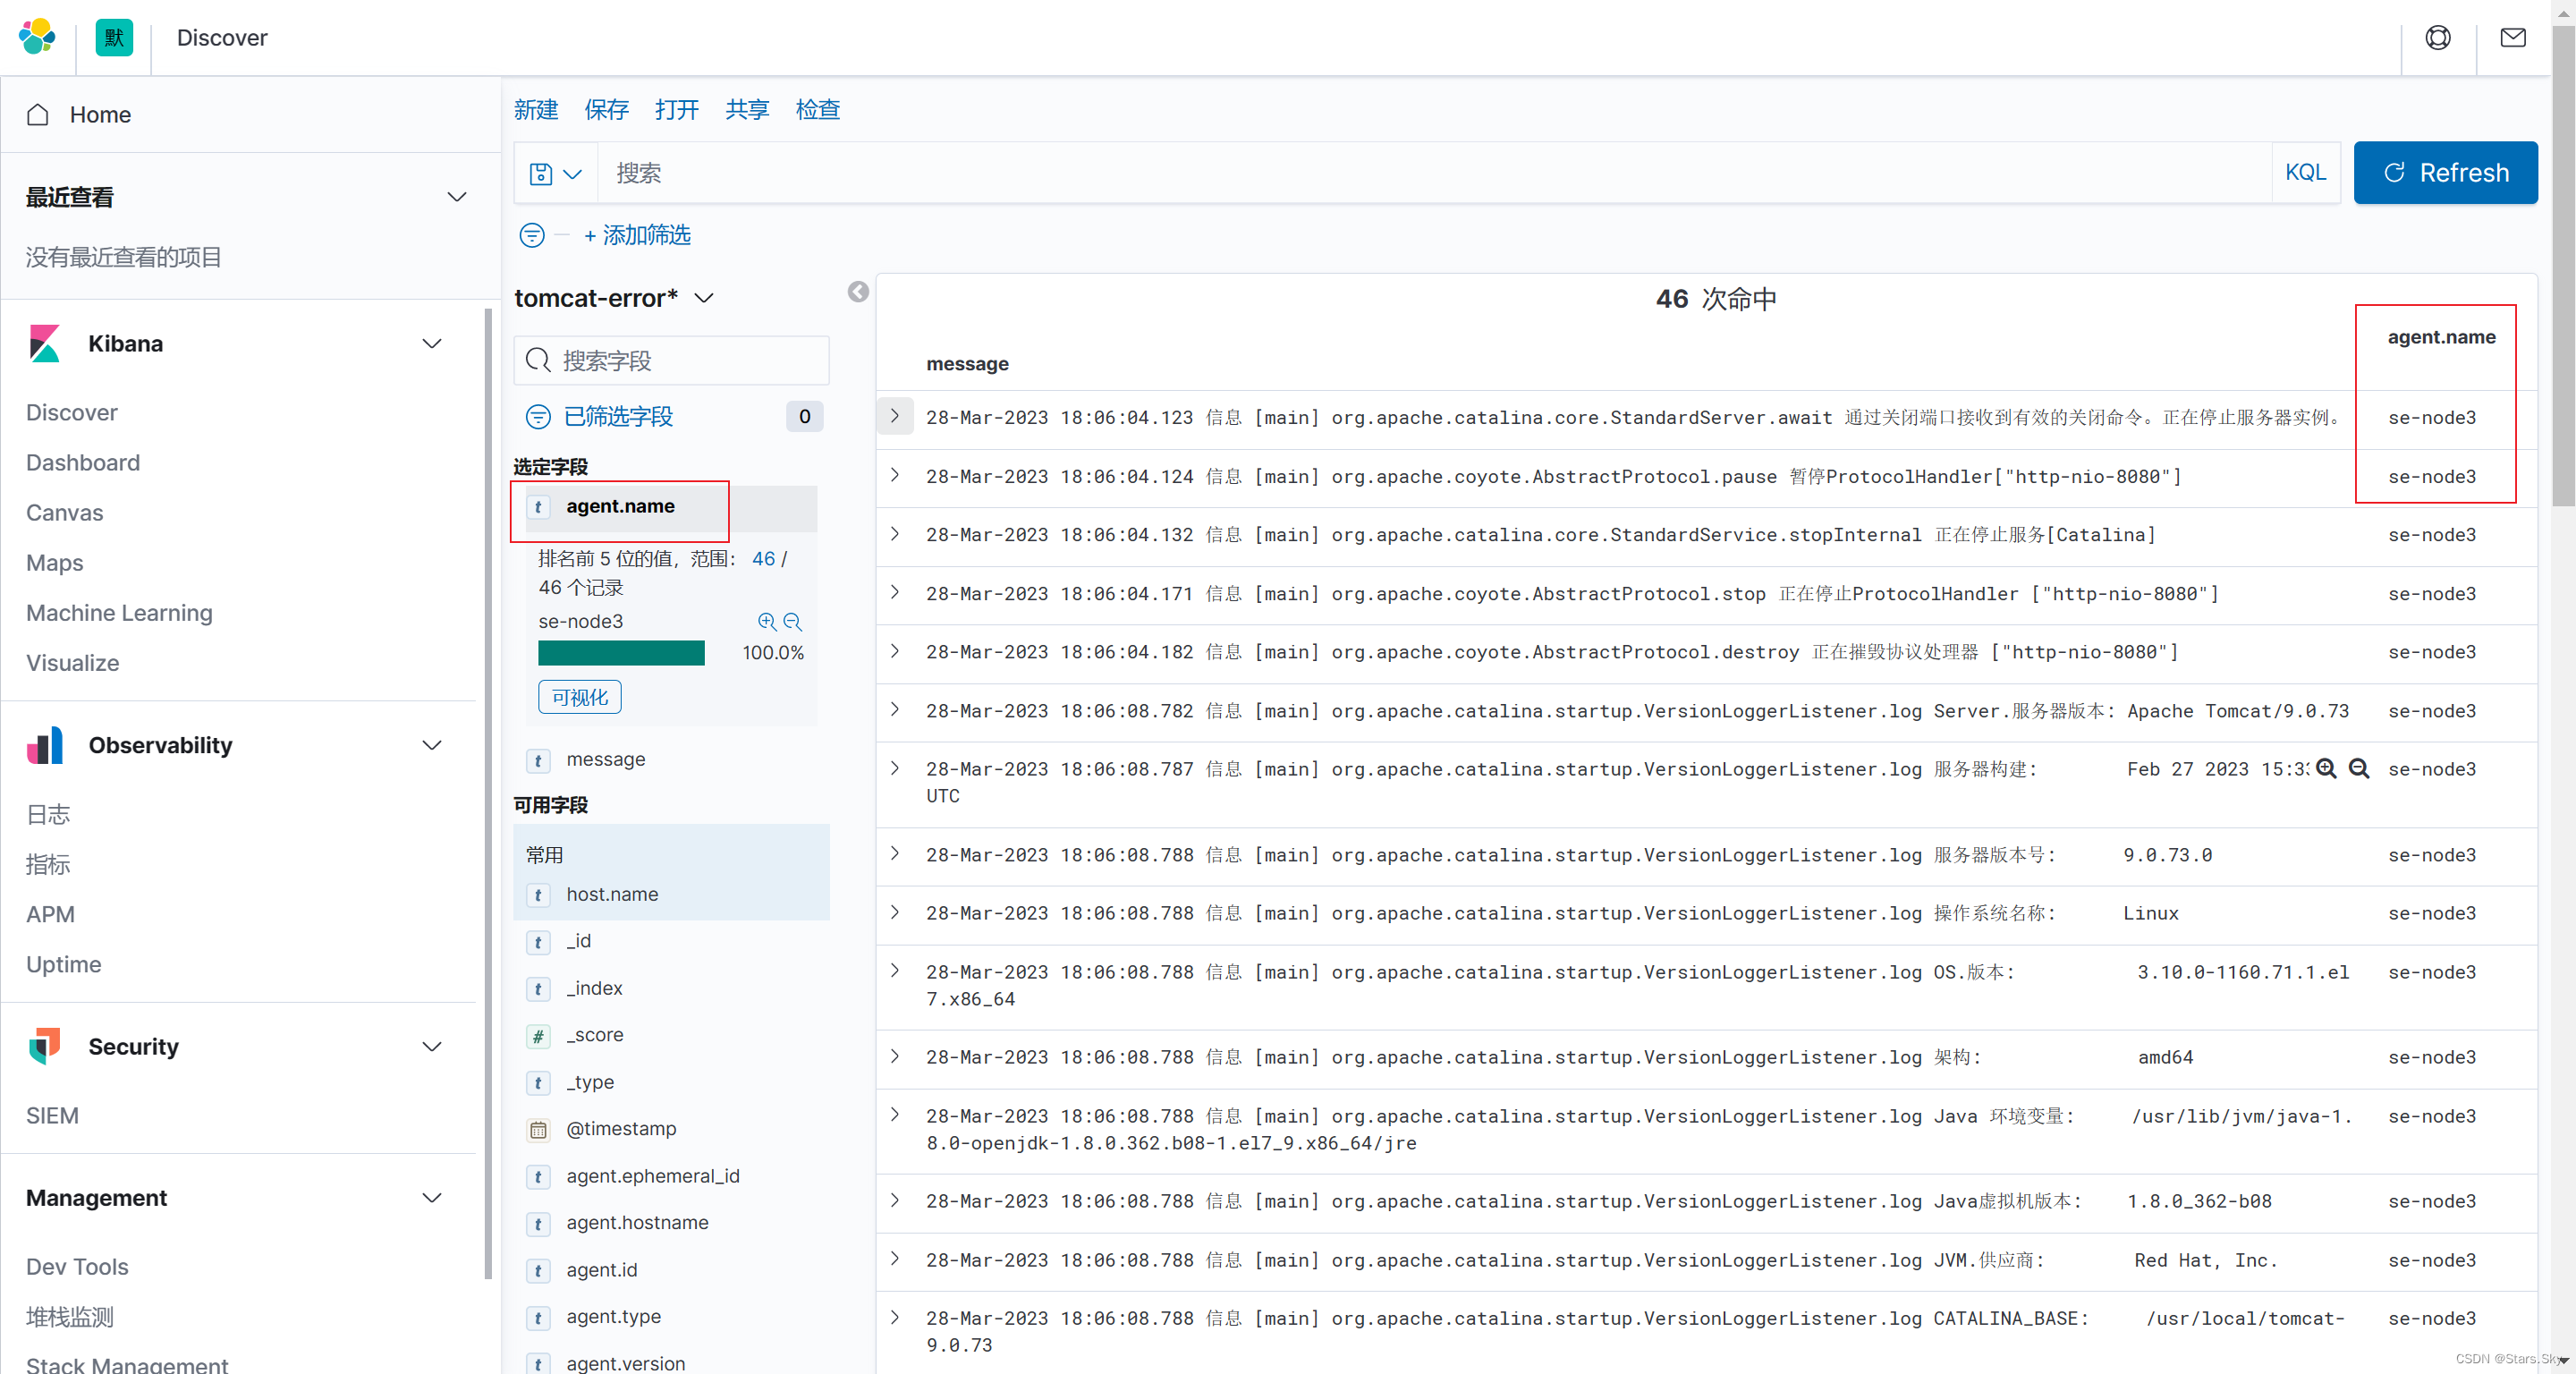
配置 kibana 添加索引,然后展示数据:

2.5 收集多台 Tomcat 节点日志
思路是再另一台 Tomcat 节点的机器上安装 Filebeat 组件,并重复 2.3 、2.4 的相同步骤,不需要做其他修改(如索引名称等),配置好 Filebeat 然后启动后, Kibana 会自动汇总聚合相同索引的数据,使用 agent.name 字段区分 Tomcat 节点即可:
三、ES 错误日志收集实践
配置 filebeat 收集 Elasticsearch 错误日志:
[root@se-node3 ~]# vim /etc/filebeat/filebeat.yml
filebeat.inputs:
- type: log                    # 收集日志的类型
  enabled: true                # 启用日志收集
  paths:
    - /var/log/elasticsearch/my-es.log          # 日志所在路径
  multiline.pattern: '^\['
  multiline.negate: true
  multiline.match: after
  multiline.max_lines: 1000

output.elasticsearch:          # 输出日志至 es
  hosts: ["192.168.170.132:9200", "192.168.170.133:9200", "192.168.170.134:9200"]   # es 集群 ip 和端口
  enabled: true
  index: "es-node3-%{[agent.version]}-%{+yyyy.MM.dd}"     # 自定义索引名称

setup.ilm.enabled: false                                # 索引生命周期 ilm 功能默认开启,开启情况下索引名称只能为 filebeat-*
setup.template.name: "es"                           # 定义模板名称
setup.template.pattern: "es-node*"                      # 定义模板的匹配索引名称

[root@se-node3 ~]# systemctl restart filebeat.service 上一篇文章:【Elastic (ELK) Stack 实战教程】05、Filebeat 日志收集实践(上)_Stars.Sky的博客-CSDN博客
下一篇文章:【Elastic (ELK) Stack 实战教程】07、Logstash 快速入门及 Input、Filter 插件讲解_Stars.Sky的博客-CSDN博客