一、什么是SpringBoot Admin
SpringBoot Admin是一个针对SpringBoot的Actuator接口进行UI美化封装的监控工具,它可以在列表中浏览所有被监控 SpringBoot项目的基本信息、详细的Health信息、内存信息、JVM信息、垃圾回收信息、各种配置信息(比如数据源、缓存列表和命中率)等,还可以直接修改logger的level
SpringBoot Admin分为服务端和客户端,服务端其实就是一个监控后台用来汇总展示所有的监控信息,客户端就是我们的应用,使用时需要先启动服务端,在启动客户端的时候打开Actuator的接口,并指向服务端的地址,这样服务端会定时读取相关信息以达到监控的目的
二、监控单体应用
1、Admin Server端
添加依赖:
        <dependency>
            <groupId>org.springframework.boot</groupId>
            <artifactId>spring-boot-starter-web</artifactId>
        </dependency>
        <dependency>
            <groupId>de.codecentric</groupId>
            <artifactId>spring-boot-admin-starter-server</artifactId>
        </dependency>
配置文件:
server.port=8000
启动类添加@EnableAdminServer注解:
@EnableAdminServer
@SpringBootApplication
public class AdminServerApplication {

    public static void main(String[] args) {
        SpringApplication.run(AdminServerApplication.class, args);
    }

}
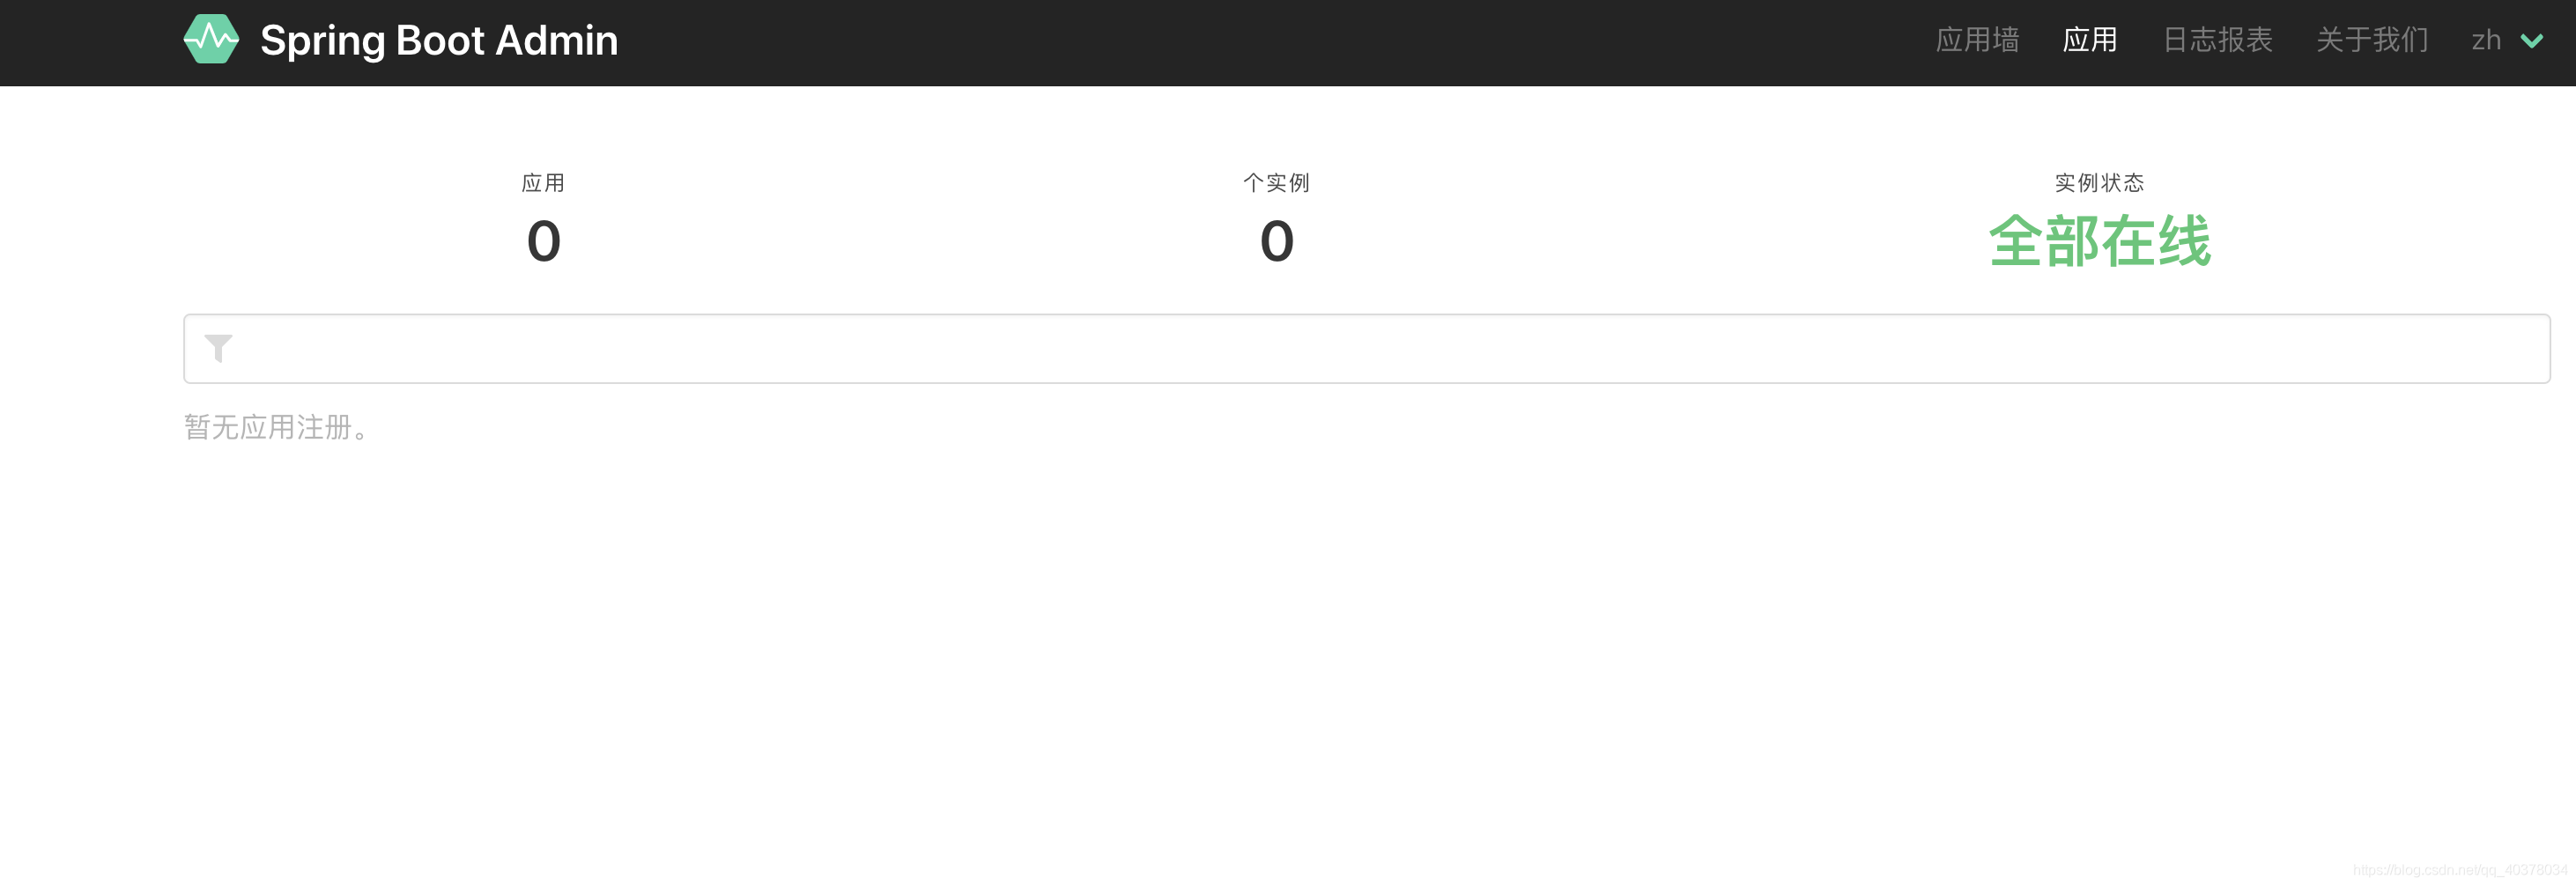
启动服务端,访问http://localhost:8000/就可以看到以下界面
2、Admin Client端
添加依赖:
        <dependency>
            <groupId>org.springframework.boot</groupId>
            <artifactId>spring-boot-starter-web</artifactId>
        </dependency>
        <dependency>
            <groupId>de.codecentric</groupId>
            <artifactId>spring-boot-admin-starter-client</artifactId>
        </dependency>
配置文件:
server.port=8001
spring.application.name=Admin Client
#配置admin server的地址
spring.boot.admin.client.url=http://localhost:8000
#打开客户端actuator的监控
management.endpoints.web.exposure.include=*
配置完成后,启动Client端,Admin服务端就自动检查到客户端的变化,并展示其应用:

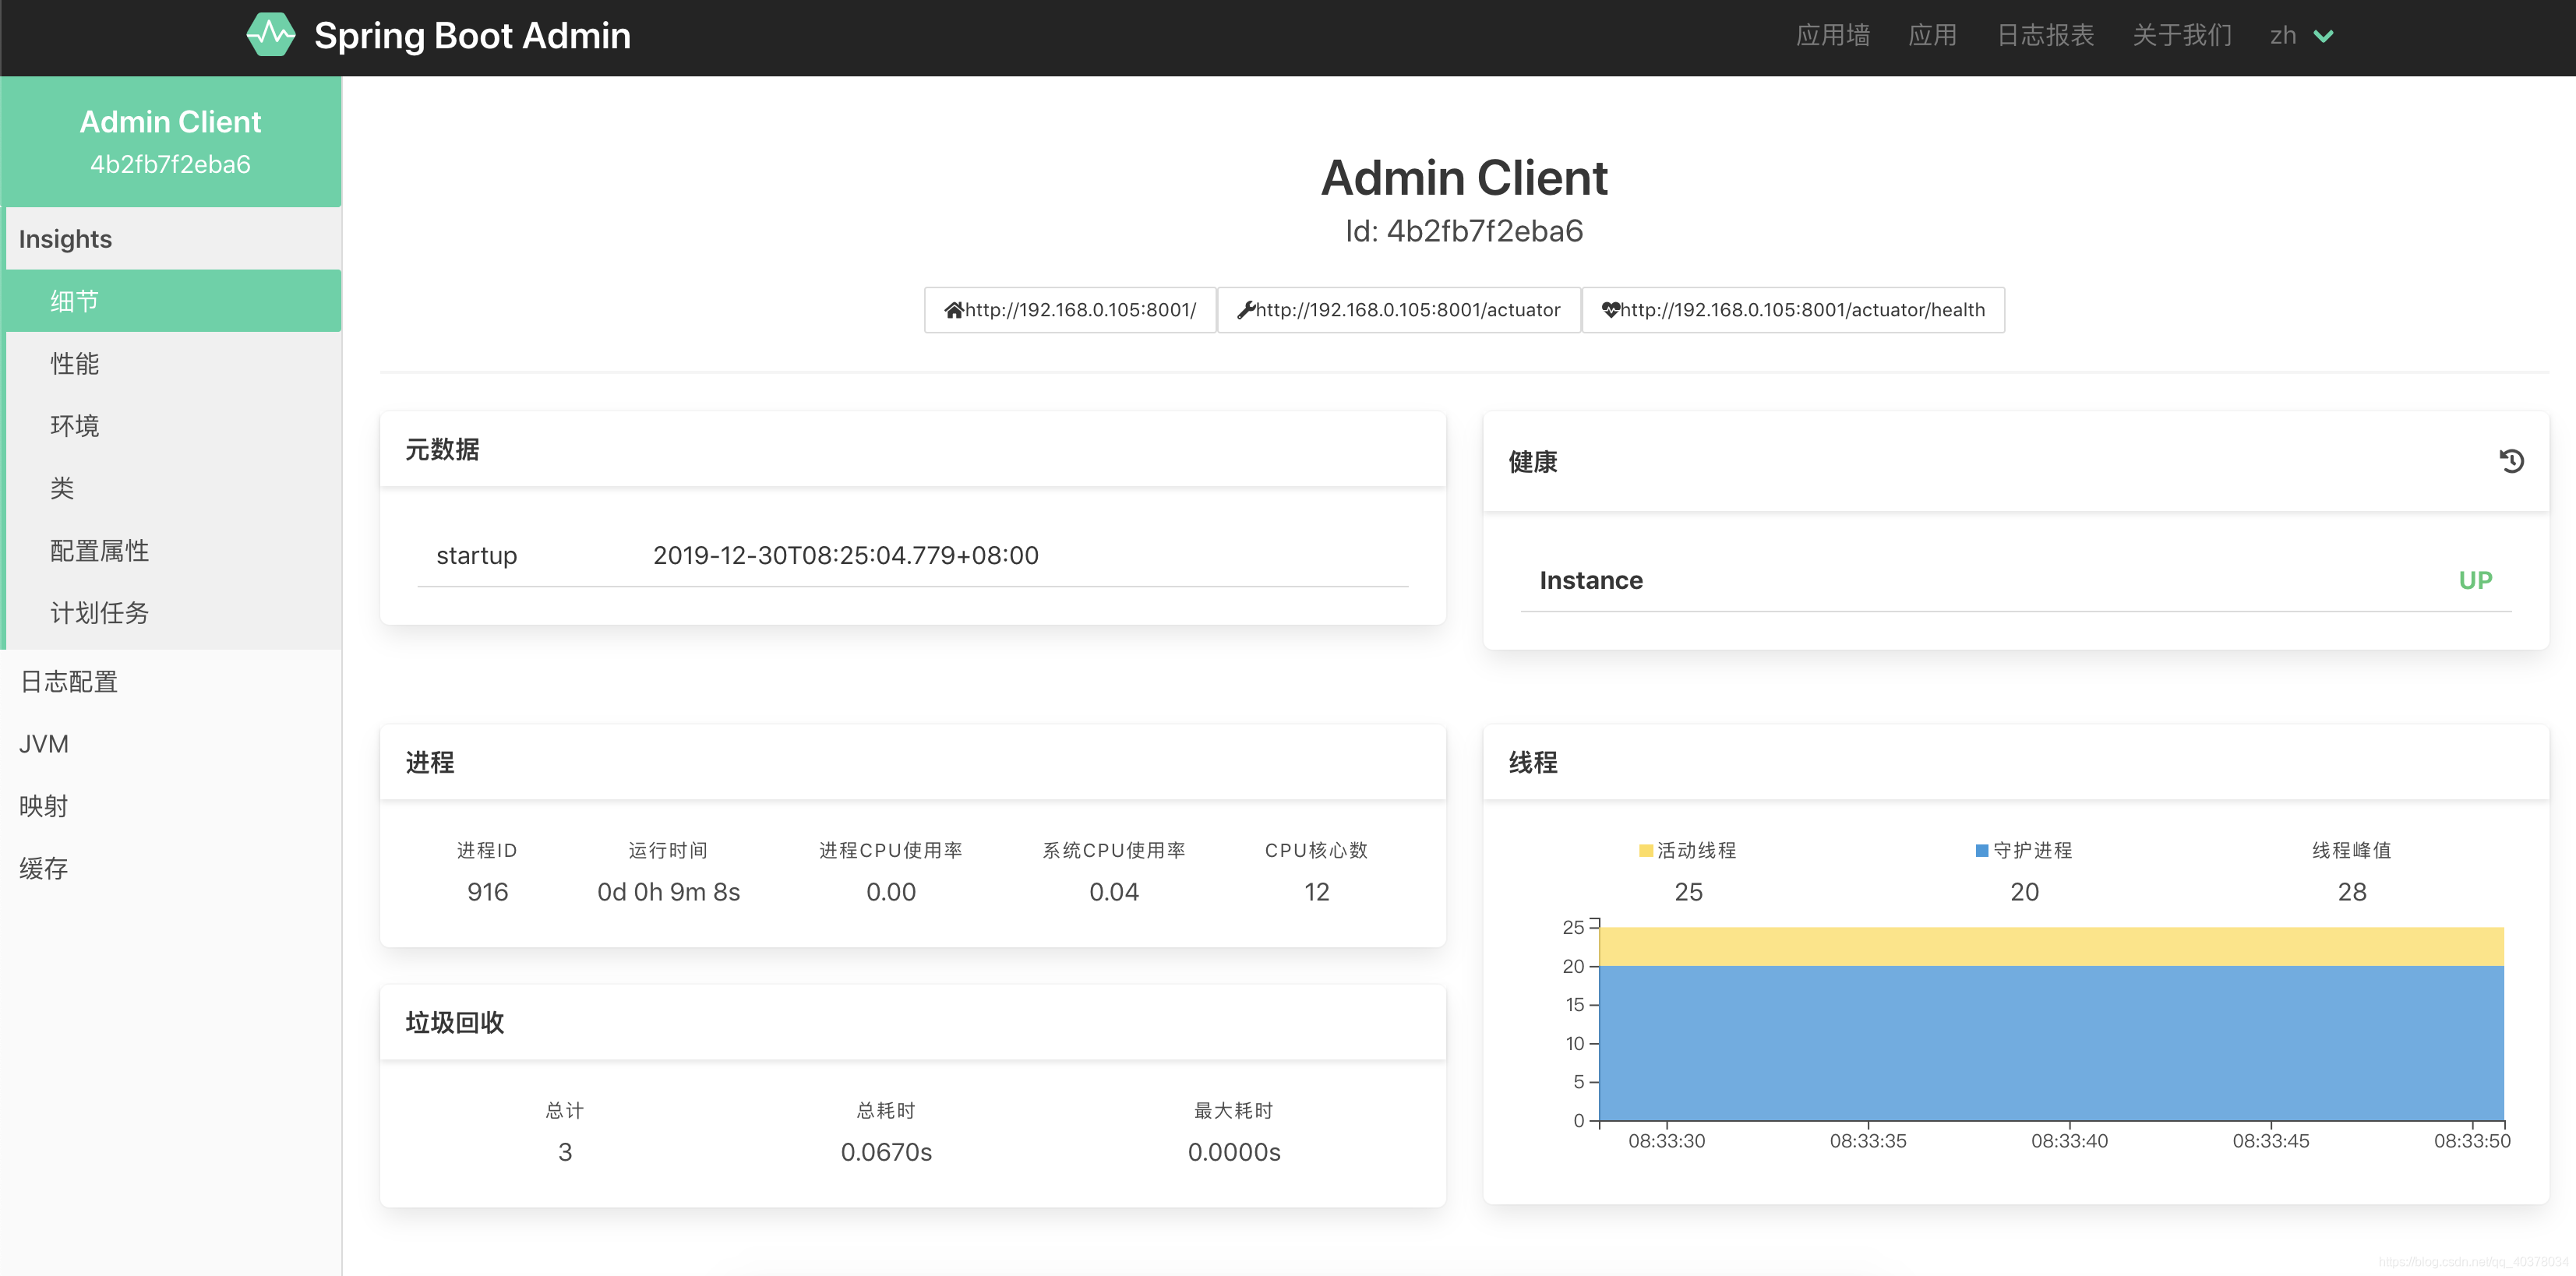
页面会展示被监控的服务列表,点击项目名称会进入此应用的详细监控信息:
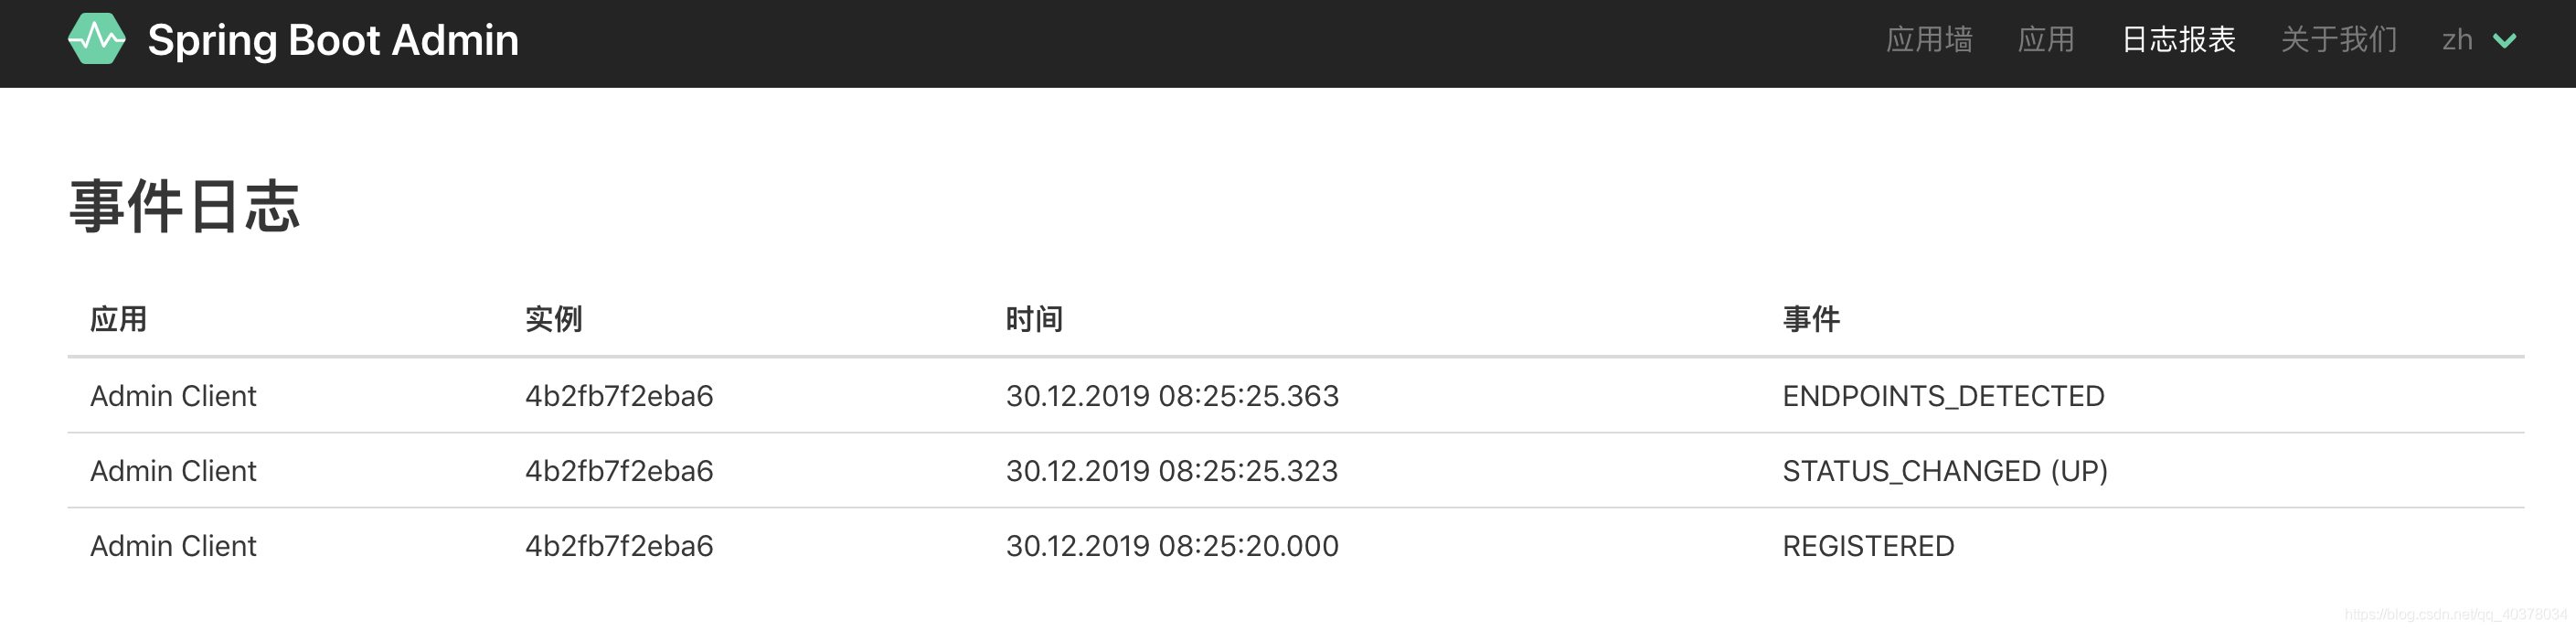
点击日志报表可以看到应用状态变化的历史过程:
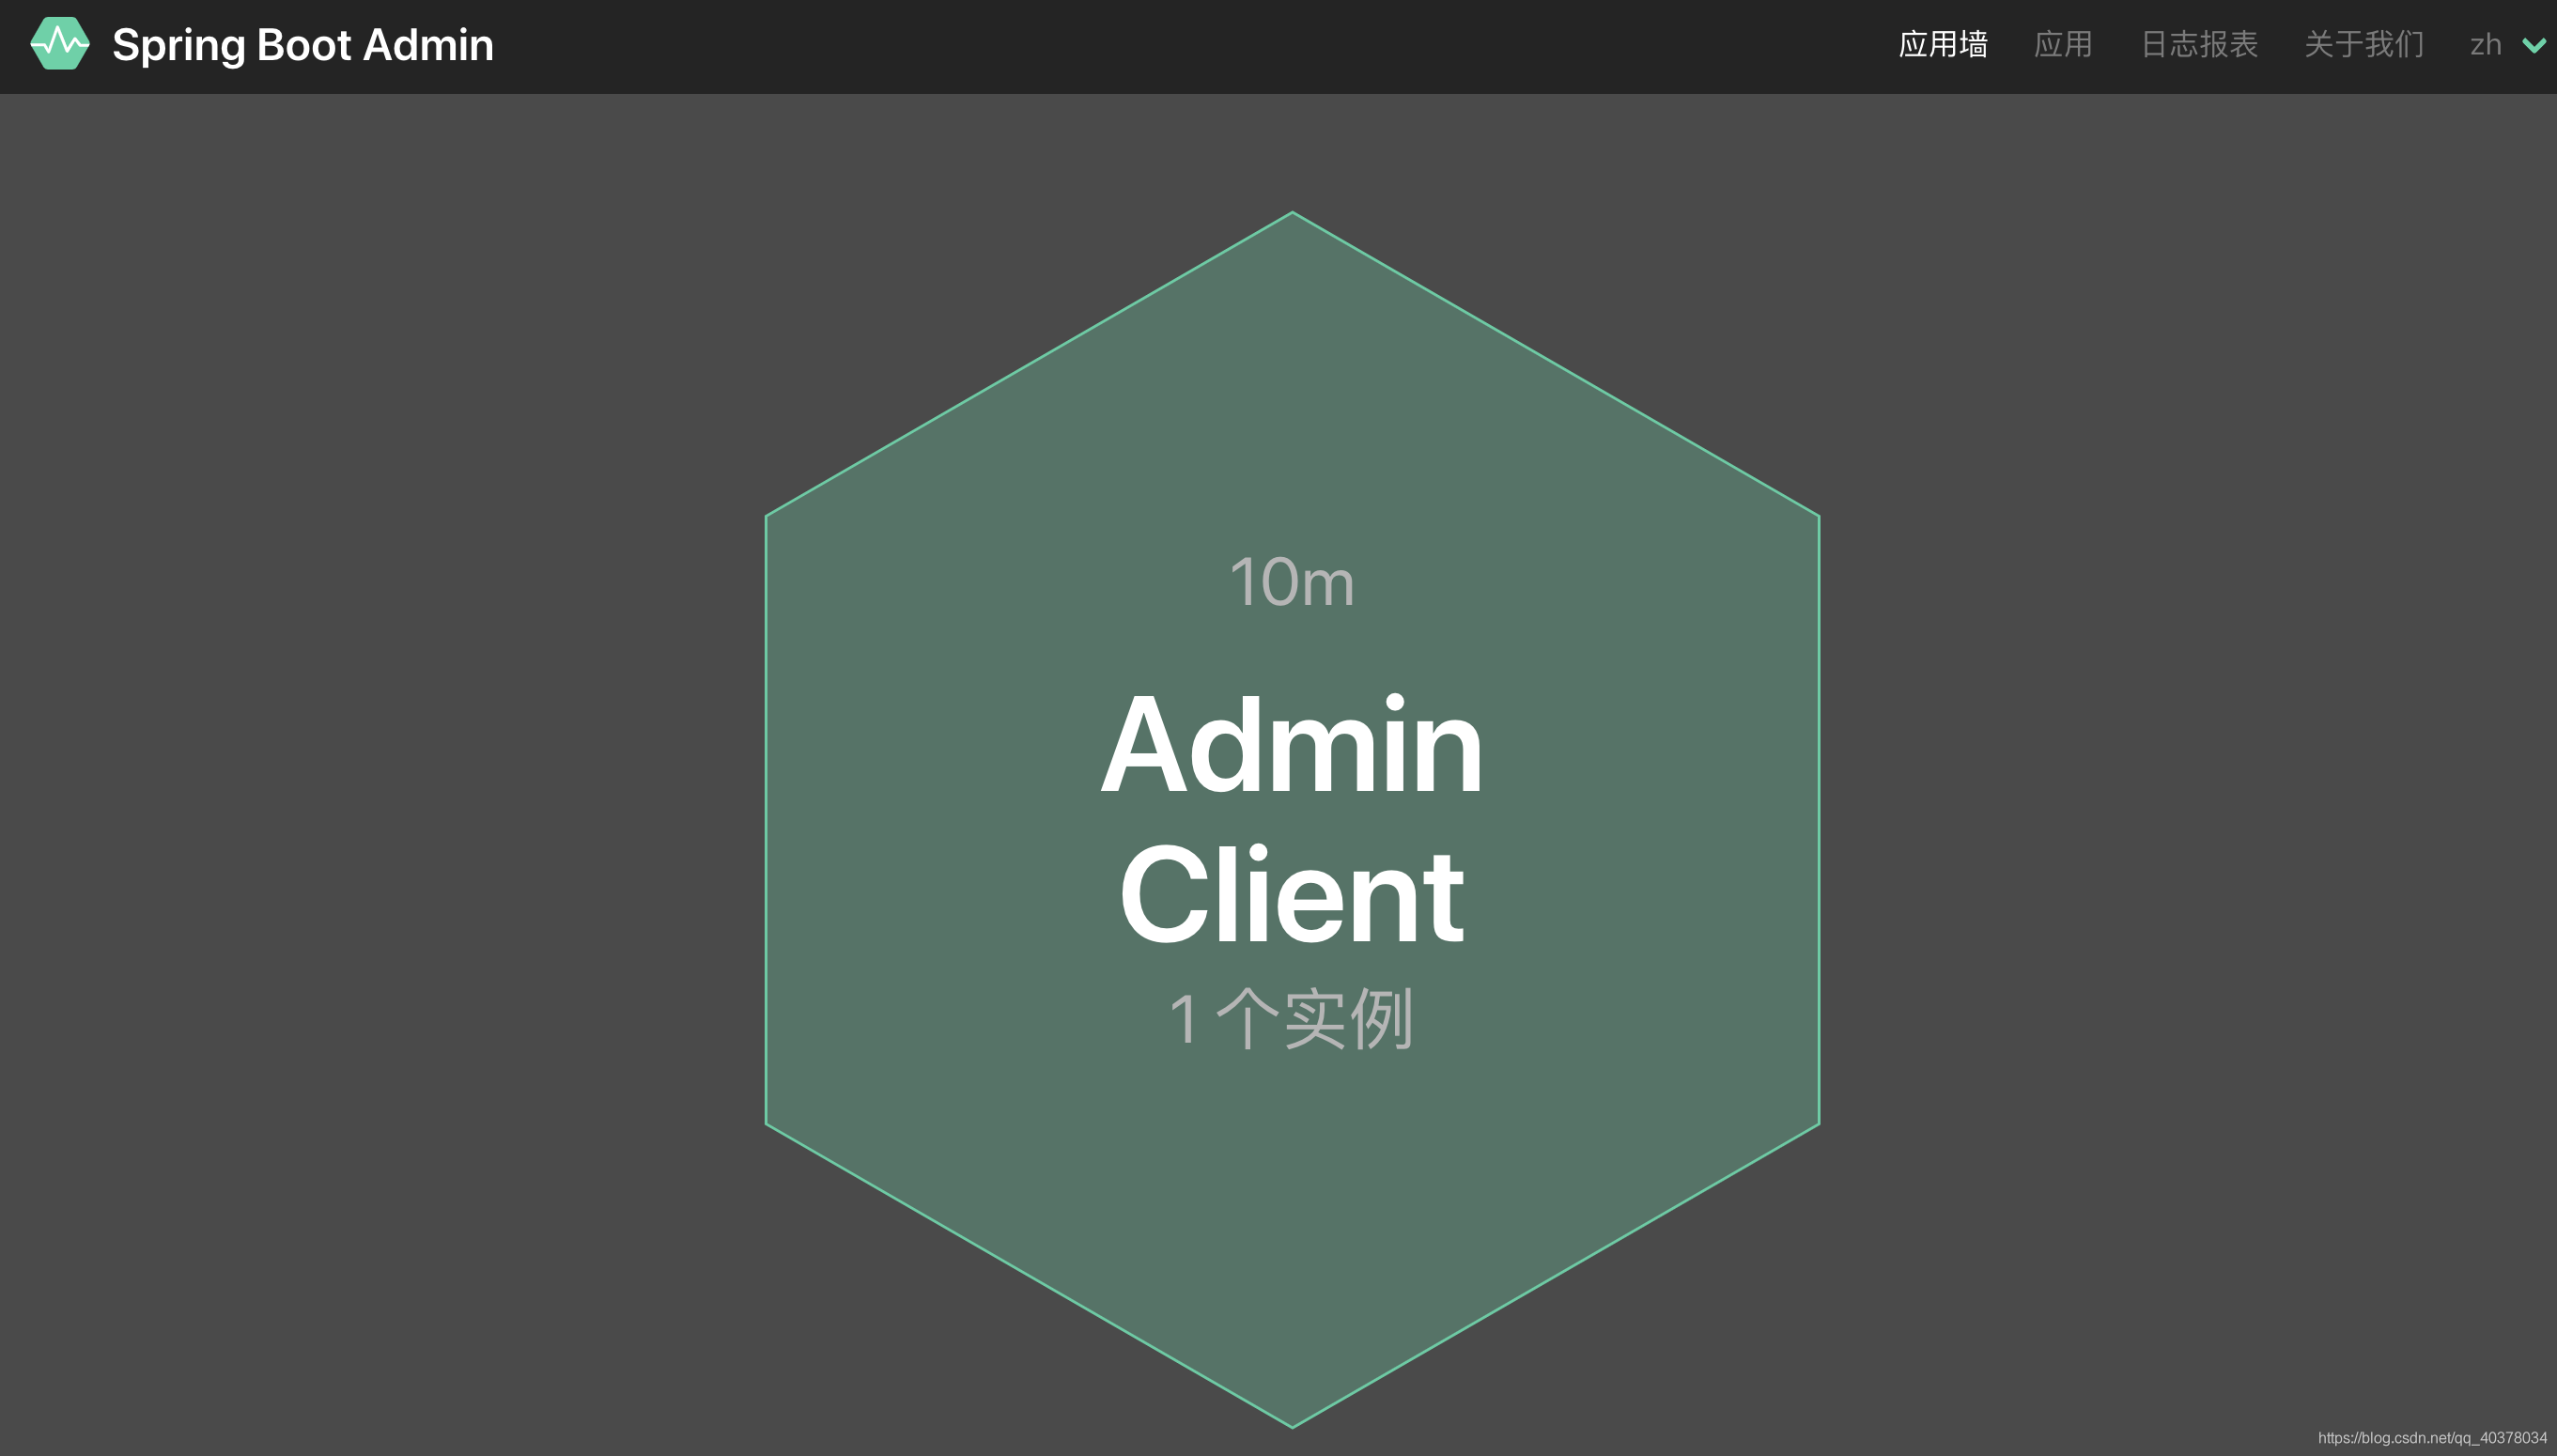
点击应用墙可以查看应用数量启动的时间等
三、监控微服务
如果我们使用的是单个SpringBoot应用,就需要在每一个被监控的应用中配置Admin Server的地址信息;如果应用都注册在Eureka中就不需要再对每个应用进行配置,SpringBoot Admin会自动从注册中心抓取应用的相关信息
服务端和客户端添加Eureka Client的依赖:
        <dependency>
            <groupId>org.springframework.cloud</groupId>
            <artifactId>spring-cloud-starter-netflix-eureka-client</artifactId>
        </dependency>
启动类添加注解:
@EnableAdminServer
@EnableDiscoveryClient
@SpringBootApplication
public class AdminServerApplication {

    public static void main(String[] args) {
        SpringApplication.run(AdminServerApplication.class, args);
    }
}
在客户端中配置服务发现的地址:
eureka.instance.leaseRenewalIntervalInSeconds=10
eureka.instance.health-check-url-path=/actuator/health
eureka.instance.status-page-url=/actuator/info
eureka.instance.metadata-map.startup=${random.int}
eureka.client.registryFetchIntervalSeconds=5
eureka.client.serviceUrl.defaultZone=http://127.0.0.1:7001/eureka/,http://127.0.0.1:7002/eureka/
management.endpoints.web.exposure.include=*
management.endpoint.health.show-details=always
重启启动服务端和客户端之后,访问服务端的相关地址就可以看到监控页面了
