import matplotlib.pyplot as plt
import numpy as np
if __name__ == '__main__':
a = np.linspace(start=0, stop=4, num=5, dtype=np.int32)
b = np.linspace(start=5, stop=9, num=5, dtype=np.int32)
print(a)
print(b)
x, y = np.meshgrid(a, b)
print(x)
print(y)
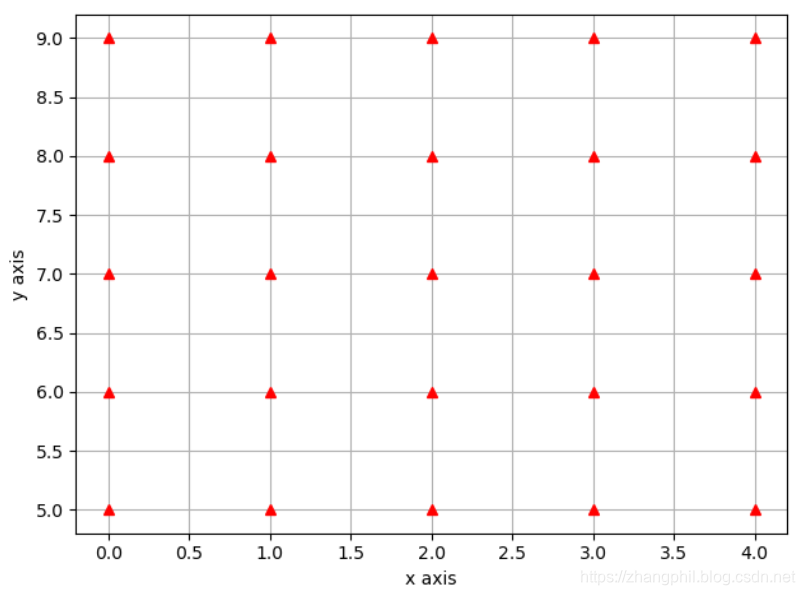
plt.xlabel('x axis')
plt.ylabel('y axis')
plt.plot(x, y, marker='^', color='red', linestyle='none')
plt.grid()
plt.show()
xy = [i for i in zip(x.flat, y.flat)]
print(xy)输出:
[0 1 2 3 4]
[5 6 7 8 9]
[[0 1 2 3 4]
 [0 1 2 3 4]
 [0 1 2 3 4]
 [0 1 2 3 4]
 [0 1 2 3 4]]
[[5 5 5 5 5]
 [6 6 6 6 6]
 [7 7 7 7 7]
 [8 8 8 8 8]
 [9 9 9 9 9]]
[(0, 5), (1, 5), (2, 5), (3, 5), (4, 5), (0, 6), (1, 6), (2, 6), (3, 6), (4, 6), (0, 7), (1, 7), (2, 7), (3, 7), (4, 7), (0, 8), (1, 8), (2, 8), (3, 8), (4, 8), (0, 9), (1, 9), (2, 9), (3, 9), (4, 9)]
二维平面的数据可视化后如图: