clc
clear
[X,Y,Z] = meshgrid(linspace(-3,3,101));
F = -X.^2.*Z.^3-(9/80).*Y.^2.*Z.^3+(X.^2+(9/4).*Y.^2+Z.^2-1).^3;
hFigure = figure;
sz = get(hFigure, 'Position');
set(hFigure, 'Position', [sz(1)-0.15*sz(3) sz(2) 1.3*sz(3) sz(4)]);
set(hFigure,'color','w', 'menu','none')
hAxes = axes('Parent',hFigure,'NextPlot','add',...
    'DataAspectRatio',[1 1 1],...
    'XLim',[30 120],'YLim',[35 65],'ZLim',[30 75]);
view([-39 30]);
axis off
hidden on
p = patch(isosurface(F,-0.001));
set(p,'FaceColor','w','EdgeColor','none');

for iX = [35 38 41 45 48 51 54 57 61 64 67]
    plane = reshape(F(:,iX,:),101,101);
    cData = contourc(plane,[0 0]);
    xData = iX.*ones(1,cData(2,1));
    plot3(hAxes,xData,cData(2,2:end),cData(1,2:end),'k');
    pause(.1), drawnow
end

for iY = [41 44 47 51 55 58 61]
    plane = reshape(F(iY,:,:),101,101);
    cData = contourc(plane,[0 0]);
    yData = iY.*ones(1,cData(2,1));
    plot3(hAxes,cData(2,2:end),yData,cData(1,2:end),'k');
    pause(.1), drawnow
end
for iZ = [36 38 40 42 44 46 48 50 52 54 56 58 60 62 64 66 69 71]
    plane = F(:,:,iZ);
    cData = contourc(plane,[0 0]);
    startIndex = 1;
    if size(cData,2) > (cData(2,1)+1)
        startIndex = cData(2,1)+2;
        zData = iZ.*ones(1,cData(2,1));

        plot3(hAxes,cData(1,2:(startIndex-1)),...
            cData(2,2:(startIndex-1)),zData,'k');
    end
    zData = iZ.*ones(1,cData(2,startIndex));
    plot3(hAxes,cData(1,(startIndex+1):end),...
        cData(2,(startIndex+1):end),zData,'k');
    pause(.1), drawnow
end
set(p,'faceColor','r','EdgeColor','w');
pause(.2)
set(p,'faceColor','w','EdgeColor','r')
pause(.2)
text(7,50,70,'I', 'fontWeight','bold','FontAngle','italic','fontsize',100)
pause(.5)
text(80,50,43,'YOU', 'fontWeight','bold','FontAngle','italic','fontsize',100)
pause(.2)
%设置签名
line([20 80],[50 50],[52.5 52.5], 'color','k')
line([50 50],[20 80],[52.5 52.5], 'color','k')
line([50 50],[50 50],[30 80], 'color','k')
text(20,50,50,'x')
text(48,20,50,'y')
text(45,50,80,'z')
text(30,60,30,'(x^2+9/4y^2+z^2-1)^3 - x^2z^3-9/80y^2z^3=0', 'fontsize',12)
text(35,45,30,'-3<x,y,z<3', 'fontsize',12)
text(50,65,90,'超帅的猪猪侠', 'fontsize',38)

2.
clc
clear
warning  off
 for b=-10:1:40
     clf;
    x=[-1.6:0.01:1.6];
    y=(sqrt(cos(x)).*cos(b.*200.*x)+sqrt(abs(x))-0.7).*(4-x.^2).^0.01;
    plot(x,y,'r','LineWidth',2);
    axis off
    pause(0.3)
    hold off
  end
3.
clc
clear
for b=0:0.08:40
    clf;
    x=[0:0.01:1.8];
    y=x.^(2/3)+0.9*sqrt(3.3-x.^2).*sin(b.*pi.*x);
    plot(x,y,'r','LineWidth',2);
    axis off
    hold on
    plot(-x,y,'g','LineWidth',2)
    plot(x*2/3,y*2/3,'g')
    plot(-x*2/3,y*2/3,'r')
    axis equal
    pause(0.0005)
    hold off
end

4.
clc
clear
[x,t] = meshgrid(0:0.1:1,-1:.03:30);
p = (pi/2)*exp(-t/8);
u = 1-(1-mod(3.6*t,2)).^4/2;
y = 2*(x.^2-x).^2.*sin(p);
r = u.*(x.*sin(p)+y.*cos(p));
figure('color','w'),view(70,70),axis image off
surface(r.*cos(t*pi),r.*sin(t*pi),...
    u.*(x.*cos(p)-y.*sin(p)),'EdgeColor','none','FaceColor','r')
light('style','local','pos',[1 -1 3]),lighting gouraud

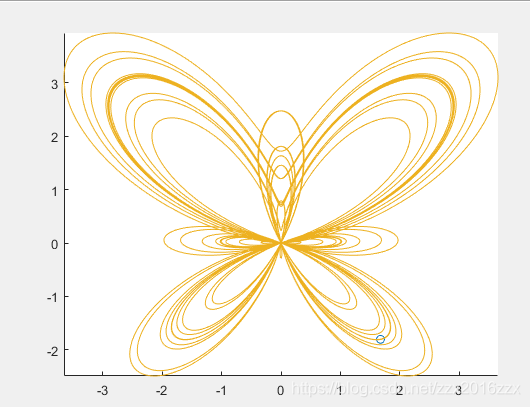
5.
clear
clc
t=0:0.01:72*pi
x = sin(t).*(exp(cos(t)) - 2*cos(4*t)-sin(t/12).^5);
y = cos(t).*(exp(cos(t)) - 2*cos(4*t)-sin(t/12).^5);
comet(x,y);
axis off
6
clear
clc
axis off;
set(gcf, 'menubar', 'none', 'toolbar', 'none'); % 不显示菜单栏和工具栏
for k = 1 : 60%循环次数
    h = text(rand, rand, ['\fontsize{',num2str(unifrnd(20, 50)),'}\fontname{Times New Roman}Who???'],'color', rand(1, 3), 'Rotation', 360 * rand);
    pause(0.1);%动态观察变化过程延迟0.1秒执行下一条
end
clc,clear
%author:[email protected]
%date:2019-9-18
syms x
for i=0:0.1:10
    y=abs(x).^(2/3)+0.9*sqrt(3.3-x.^2).*sin(i.*pi.*x);
    fplot(y,[-2,2],'-*r');
    title(['$|x|^{2/3}+0.9\sqrt{3.3-x^2}sin(i\pi x)$','   i=',num2str(i)],'interpreter','latex')
    pause(0.001)
end
clc;clear
%author:[email protected]
%date:2019-10-2
%% 爱心的参数方程
t=0:0.025:4*pi;
x=16*sin(t).^3;
y=13*cos(t)-5*cos(2*t)-2*cos(3*t)-cos(4*t);
%% 动图画图并保存为GIF
h = plot(x(1),y(1),'-.r','LineWidth',1.5);%h为Line对象
axis([-20,20,-20,20]);
% axis off
[A,map] = rgb2ind(frame2im(getframe),256);%getframe获取当前画面
imwrite(A,map,'1.gif','LoopCount',inf,'DelayTime',1);
for idx = 2:2:length(t)
    h.XData(idx) = x(idx);
    h.YData(idx) = y(idx);
    drawnow
    [A,map] = rgb2ind(frame2im(getframe),256);
    imwrite(A,map,'1.gif','WriteMode','append','DelayTime',0.1);
end
for idx = 2:length(t)
    h.XData(idx) = x(idx);
    h.YData(idx) = y(idx);
    drawnow
    [A,map] = rgb2ind(frame2im(getframe),256);
    imwrite(A,map,'1.gif','WriteMode','append','DelayTime',0.1);
end
text(0,0,'我爱你祖国','HorizontalAlignment','center','FontSize',37,'color','r')
A星算法
function astardemo
%ASTARDEMO Demonstration of ASTAR algorithm
%
%   Copyright Bob L. Sturm, Ph. D., Assistant Professor
%   Department of Architecture, Design and Media Technology
%     formerly Medialogy
%   Aalborg University i Ballerup
%     formerly Aalborg University Copenhagen
%   $Revision: 0.1 $  $Date: 2011 Jan. 15 18h24:24$

n = 20;   % field size n x n tiles
wallpercent = 0.45;  % this percent of field is walls

% create the n x n FIELD with wallpercent walls containing movement costs,
% a starting position STARTPOSIND, a goal position GOALPOSIND, the costs
% A star will compute movement cost for each tile COSTCHART,
% and a matrix in which to store the pointers FIELDPOINTERS
[field, startposind, goalposind, costchart, fieldpointers] = ...
  initializeField(n,wallpercent);

% initialize the OPEN and CLOSED sets and their costs
setOpen = [startposind]; setOpenCosts = [0]; setOpenHeuristics = [Inf];
setClosed = []; setClosedCosts = [];
movementdirections = {'R','L','D','U'};

% keep track of the number of iterations to exit gracefully if no solution
counterIterations = 1;

% create figure so we can witness the magic
axishandle = createFigure(field,costchart,startposind,goalposind);

% as long as we have not found the goal or run out of spaces to explore
while ~max(ismember(setOpen,goalposind)) && ~isempty(setOpen)
  % for the element in OPEN with the smallest cost
  [temp, ii] = min(setOpenCosts + setOpenHeuristics);
  % find costs and heuristic of moving to neighbor spaces to goal
  % in order 'R','L','D','U'
  [costs,heuristics,posinds] = findFValue(setOpen(ii),setOpenCosts(ii), ...
    field,goalposind,'euclidean');
  % put node in CLOSED and record its cost
  setClosed = [setClosed; setOpen(ii)];
  setClosedCosts = [setClosedCosts; setOpenCosts(ii)];
  % update OPEN and their associated costs
  if (ii > 1 && ii < length(setOpen))
    setOpen = [setOpen(1:ii-1); setOpen(ii+1:end)];
    setOpenCosts = [setOpenCosts(1:ii-1); setOpenCosts(ii+1:end)];
    setOpenHeuristics = [setOpenHeuristics(1:ii-1); setOpenHeuristics(ii+1:end)];
  elseif (ii == 1)
    setOpen = setOpen(2:end);
    setOpenCosts = setOpenCosts(2:end);
    setOpenHeuristics = setOpenHeuristics(2:end);
  else
    setOpen = setOpen(1:end-1);
    setOpenCosts = setOpenCosts(1:end-1);
    setOpenHeuristics = setOpenHeuristics(1:end-1);
  end
  % for each of these neighbor spaces, assign costs and pointers;
  % and if some are in the CLOSED set and their costs are smaller,
  % update their costs and pointers
  for jj=1:length(posinds)
    % if cost infinite, then it's a wall, so ignore
    if ~isinf(costs(jj))
      % if node is not in OPEN or CLOSED then insert into costchart and
      % movement pointers, and put node in OPEN
      if ~max([setClosed; setOpen] == posinds(jj))
        fieldpointers(posinds(jj)) = movementdirections(jj);
        costchart(posinds(jj)) = costs(jj);
        setOpen = [setOpen; posinds(jj)];
        setOpenCosts = [setOpenCosts; costs(jj)];
        setOpenHeuristics = [setOpenHeuristics; heuristics(jj)];
      % else node has already been seen, so check to see if we have
      % found a better route to it.
      elseif max(setOpen == posinds(jj))
        I = find(setOpen == posinds(jj));
        % update if we have a better route
        if setOpenCosts(I) > costs(jj)
          costchart(setOpen(I)) = costs(jj);
          setOpenCosts(I) = costs(jj);
          setOpenHeuristics(I) = heuristics(jj);
          fieldpointers(setOpen(I)) = movementdirections(jj);
        end
      % else node has already been CLOSED, so check to see if we have
      % found a better route to it.
      else
        % find relevant node in CLOSED
        I = find(setClosed == posinds(jj));
        % update if we have a better route
        if setClosedCosts(I) > costs(jj)
          costchart(setClosed(I)) = costs(jj);
          setClosedCosts(I) = costs(jj);
          fieldpointers(setClosed(I)) = movementdirections(jj);
        end
      end
    end
  end
  if isempty(setOpen) break; end
  set(axishandle,'CData',[costchart costchart(:,end); costchart(end,:) costchart(end,end)]);
  % hack to make image look right
  set(gca,'CLim',[0 1.1*max(costchart(find(costchart < Inf)))]);
  axis off;
  drawnow;
end

if max(ismember(setOpen,goalposind))
  disp('Solution found!');
  % now find the way back using FIELDPOINTERS, starting from goal position
  p = findWayBack(goalposind,fieldpointers);
  % plot final path
  plot(p(:,2)+0.5,p(:,1)+0.5,'Color',0.2*ones(3,1),'LineWidth',4);
  axis off;
  drawnow;

  % celebrate
  [y,Fs] = audioread('wee.wav'); sound(y,Fs);
elseif isempty(setOpen)
  axis off;
  disp('No Solution!');
  [y,Fs] = audioread('pewee-ahh.wav');
  sound(y,Fs);
end
% end of the main function

%%%%%%%%%%%%%%%%%%%%%%%%%%%%
function p = findWayBack(goalposind,fieldpointers)
% This function will follow the pointers from the goal position to the
% starting position
    n = length(fieldpointers);  % length of the field
    posind = goalposind;
    % convert linear index into [row column]
    [py,px] = ind2sub([n,n],posind);
    % store initial position
    p = [py px];
    % until we are at the starting position
    while ~strcmp(fieldpointers{posind},'S')
      switch fieldpointers{posind}
        case 'L' % move left
          px = px - 1;
        case 'R' % move right
          px = px + 1;
        case 'U' % move up
          py = py - 1;
        case 'D' % move down
          py = py + 1;
      end
      p = [p; py px];
      % convert [row column] to linear index
      posind = sub2ind([n n],py,px);
    end
% end of this function

%%%%%%%%%%%%%%%%%%%%%%%%%%%%
function [cost,heuristic,posinds] = findFValue(posind,costsofar,field, ...
  goalind,heuristicmethod)
% This function finds the movement COST for each tile surrounding POSIND in
% FIELD, returns their position indices POSINDS. They are ordered: right,
% left, down, up.
    n = length(field);  % length of the field
    % convert linear index into [row column]
    [currentpos(1) currentpos(2)] = ind2sub([n n],posind);
    [goalpos(1) goalpos(2)] = ind2sub([n n],goalind);
    % places to store movement cost value and position
    cost = Inf*ones(4,1); heuristic = Inf*ones(4,1); pos = ones(4,2);

    % if we can look left, we move from the right
    newx = currentpos(2) - 1; newy = currentpos(1);
    if newx > 0
      pos(1,:) = [newy newx];
      switch lower(heuristicmethod)
        case 'euclidean'
          heuristic(1) = abs(goalpos(2)-newx) + abs(goalpos(1)-newy);
        case 'taxicab'
          heuristic(1) = abs(goalpos(2)-newx) + abs(goalpos(1)-newy);
      end
      cost(1) = costsofar + field(newy,newx);
    end

    % if we can look right, we move from the left
    newx = currentpos(2) + 1; newy = currentpos(1);
    if newx <= n
      pos(2,:) = [newy newx];
      switch lower(heuristicmethod)
        case 'euclidean'
          heuristic(2) = abs(goalpos(2)-newx) + abs(goalpos(1)-newy);
        case 'taxicab'
          heuristic(2) = abs(goalpos(2)-newx) + abs(goalpos(1)-newy);
      end
      cost(2) = costsofar + field(newy,newx);
    end

    % if we can look up, we move from down
    newx = currentpos(2); newy = currentpos(1)-1;
    if newy > 0
      pos(3,:) = [newy newx];
      switch lower(heuristicmethod)
        case 'euclidean'
          heuristic(3) = abs(goalpos(2)-newx) + abs(goalpos(1)-newy);
        case 'taxicab'
          heuristic(3) = abs(goalpos(2)-newx) + abs(goalpos(1)-newy);
      end
      cost(3) = costsofar + field(newy,newx);
    end

    % if we can look down, we move from up
    newx = currentpos(2); newy = currentpos(1)+1;
    if newy <= n
      pos(4,:) = [newy newx];
      switch lower(heuristicmethod)
        case 'euclidean'
          heuristic(4) = abs(goalpos(2)-newx) + abs(goalpos(1)-newy);
        case 'taxicab'
          heuristic(4) = abs(goalpos(2)-newx) + abs(goalpos(1)-newy);
      end
      cost(4) = costsofar + field(newy,newx);
    end

    % return [row column] to linear index
    posinds = sub2ind([n n],pos(:,1),pos(:,2));
% end of this function

%%%%%%%%%%%%%%%%%%%%%%%%%%%%
function [field, startposind, goalposind, costchart, fieldpointers] = ...
  initializeField(n,wallpercent)
% This function will create a field with movement costs and walls, a start
% and goal position at random, a matrix in which the algorithm will store
% f values, and a cell matrix in which it will store pointers
    % create the field and place walls with infinite cost
    field = ones(n,n) + 10*rand(n,n);
    field(ind2sub([n n],ceil(n^2.*rand(floor(n*n*wallpercent),1)))) = Inf;
    % create random start position and goal position
    startposind = sub2ind([n,n],ceil(n.*rand),ceil(n.*rand));
    goalposind = sub2ind([n,n],ceil(n.*rand),ceil(n.*rand));
    % force movement cost at start and goal positions to not be walls
    field(startposind) = 0; field(goalposind) = 0;
    % put not a numbers (NaN) in cost chart so A* knows where to look
    costchart = NaN*ones(n,n);
    % set the cost at the starting position to be 0
    costchart(startposind) = 0;
    % make fieldpointers as a cell array
    fieldpointers = cell(n,n);
    % set the start pointer to be "S" for start, "G" for goal
    fieldpointers{startposind} = 'S'; fieldpointers{goalposind} = 'G';
    % everywhere there is a wall, put a 0 so it is not considered
    fieldpointers(field == Inf) = {0};
% end of this function

%%%%%%%%%%%%%%%%%%%%
function axishandle = createFigure(field,costchart,startposind,goalposind)
% This function creates a pretty figure
    % If there is no figure open, then create one
    if isempty(gcbf)
        figure('Position',[395 86 894  700],'Units','Normalized','Name','A星算法路径搜寻演示 —— matlab爱好者出品','NumberTitle','off','Color','w','Menubar','none');
        axes('position', [0.01 0.01 0.98 0.98],'FontSize',12, ...
        'FontName','Helvetica');
    axis off;
    else
      % get the current figure, and clear it
      gcf; cla;
    end
    n = length(field);
    % plot field where walls are black, and everything else is white
    field(field < Inf) = 0;
    pcolor([1:n+1],[1:n+1],[field field(:,end); field(end,:) field(end,end)]);
    % set the colormap for the ploting the cost and looking really nice
    cmap = flipud(colormap('jet'));
    % make first entry be white, and last be black
    cmap(1,:) = zeros(3,1); cmap(end,:) = ones(3,1);
    % apply the colormap, but make red be closer to goal
    colormap(flipud(cmap));
    % keep the plot so we can plot over it
    hold on;
    % now plot the f values for all tiles evaluated
    axishandle = pcolor([1:n+1],[1:n+1],[costchart costchart(:,end); costchart(end,:) costchart(end,end)]);
    % plot goal as a yellow square, and start as a green circle
    [goalposy,goalposx] = ind2sub([n,n],goalposind);
    [startposy,startposx] = ind2sub([n,n],startposind);
    plot(goalposx+0.5,goalposy+0.5,'ys','MarkerSize',10,'LineWidth',6);
    plot(startposx+0.5,startposy+0.5,'go','MarkerSize',10,'LineWidth',6);
    % add a button so that can re-do the demonstration
    uicontrol('Style','pushbutton','String','更新', 'FontSize',12, ...
      'Position', [1 1 60 40], 'Callback','astardemo');
 % end of this function
时钟
function clockplot()

% Best in fullscreen mode
% VERSION 1.1
% Features:
% 1. ANALOG + DIGITAL displays
% 2. Black dot in the centre indicates 'P.M' and White dot in the centre indicates 'A.M'
% 3. Indicates the year month date and the week numbers also.
% 4. The digital display of the time is shown on the corresponding hand
% 5. Duration of one tick of the second hand can be set
% 6. uses opengl rendering and the hands run more smoothly than in version 1.0
% 7. Display a complete digital display in the form H:M:S:mS... & H --> 0 to 24
% NOTE: CLOCK STARTS AND IS MAITAINED ACCORDING
% TO TIME INDICATED BY THE INBUILT COMMAND "clock"
% By Sunil Anandatheertha
% !x!x!x!x!x!x!x!x!x!x!x!x!x!x!x!x!x!x!x!
% !x!x!x!x!x!x!x!x!x!x!x!x!x!x!x!x!x!x!x!
% IMPORTANT NOTE: USE CTRL+C IN COMMAND LINE or FIGURE WINDOW TO END THE PROGRAM
% !x!x!x!x!x!x!x!x!x!x!x!x!x!x!x!x!x!x!x!
% !x!x!x!x!x!x!x!x!x!x!x!x!x!x!x!x!x!x!x!
% \.//////////////\.//////////////\.//////////////
% \.//////////////\.//////////////\.//////////////
rs=10; % radius of second hand
n = 1;  hs=[];  hm=[];  hh=[];  digsec=[];  digmin=[];  dighr=[];
digdate1=[]; digdate2=[]; digdate3=[]; digdate4=[]; digdate5=[]; ampm=[];
digtime1=[];digtime2=[];digtime3=[];digtime4=[];
setfigureproperties;
setaxisproperties;
onetick=0.0025;% (set the duration of one tick. NOTE: an approx.)
while n<n+1
    time = clock;
    % \.//////////////\.//////////////\.//////////////
    % analog display
    thsec = 90+(time(6)*6);
    thmin = 90+(time(5)*6) + (time(6)/10);
    thhour = 90+(time(4)*30) + (time(5)/2); %thsec-thetasec
    delete(hh);
    hh  = plot([0 -0.75*rs*cosd(thhour)],[0 0.75*rs*sind(thhour)],'b','LineWidth',1.75);%hh - figure handle for hour hand
    delete(hm);
    hm = plot([0 -0.9*rs*cosd(thmin)],[0 0.9*rs*sind(thmin)],'k','LineWidth',1.5);
    delete(hs);
    hs  = plot([0 -rs*cosd(thsec)],[0 rs*sind(thsec)],'Color',[1 0 0],'LineWidth',1);
    % \.//////////////\.//////////////\.//////////////
    % digital display
    delete(digsec);
    digsec = text(-7.5*cosd(5+thsec),7.5*sind(5+thsec),...
        num2str(time(6)),'FontSize',10);%digsec-digital sec
    delete(digmin);
    digmin = text(-6*cosd(4+thmin),6*sind(4+thmin),...
        num2str(floor(time(5))+time(6)/60),'FontSize',10);
    delete(dighr);
    dighr = text(-2.5*cosd(1+thhour),2.5*sind(1+thhour),...
        num2str(floor(time(4))+time(5)/60),'FontSize',10);
    % \.//////////////\.//////////////\.//////////////
    month = findmonth(time(2));
    week = findweek(time(3));
    [~,day]=weekday(datenum(time(1),time(2),time(3)),'local');
    % \.//////////////\.//////////////\.//////////////
    delete(digdate1);
    digdate1 = text(13*cosd(112.5),13*sind(112.5),strcat(num2str(time(1))),...
        'FontSize',12,'VerticalAlignment','middle','HorizontalAlignment','right');
    delete(digdate2);
    digdate2 = text(13*cosd(67.5),  13*sind(67.5),month,...
        'FontSize',14,'VerticalAlignment','middle','HorizontalAlignment','left');
    delete(digdate3);
    digdate3 = text(13*cosd(337.5),13*sind(337.5),strcat(num2str(floor(time(3))),'^{th}'),...
        'FontSize',14,'VerticalAlignment','middle','HorizontalAlignment','left');
    delete(digdate4);
    digdate4 = text(13*cosd(292.5),13*sind(292.5),day,...
        'FontSize',14,'VerticalAlignment','middle','HorizontalAlignment','left');
    delete(digdate5);
    digdate5 = text(13*cosd(22.5),  13*sind(22.5),strcat('Wk.-',num2str(week)),...
        'FontSize',12,'VerticalAlignment','middle','HorizontalAlignment','left');
    % \.//////////////\.//////////////\.//////////////
    % \.//////////////\.//////////////\.//////////////
    % determine am or pm
    time = clock;
    x = time(4)+time(6)/3600;
    if x>0&&x<12;
        coloris='w';AM='A.M';
    else
        coloris='k';AM='P.M';
    end % Black (k) is for P.M and White (w) is for A.
    delete(ampm);
    ampm = fill(.5*cosd(0:20:360),.5*sind(0:20:360),coloris);
    % \.//////////////\.//////////////\.//////////////
    delete(digtime1);
    delete(digtime2);
    delete(digtime3);
    delete(digtime4);
    digtime1 = text(10,11,strcat(num2str(time(4)),':',...
        num2str(time(5)),':',num2str(floor(time(6))),':',...
        num2str((1E3*(time(6)-floor(time(6)))))),...
        'FontSize',16,'color',[1 .3 0],...
        'VerticalAlignment','middle',...
        'HorizontalAlignment','left');
    digtime2 = text(-16,11,strcat(num2str(time(1)),' 年 ',...
        num2str(time(2)),' 月 ',num2str(time(3)),' 日    ',...
        day),...
        'FontSize',14,'color',[1 .3 0],...
        'VerticalAlignment','middle',...
        'HorizontalAlignment','left');
    digtime3 = text(-16,12,'今天是:',...
        'FontSize',15,'color',[0 0 1],...
        'VerticalAlignment','middle',...
        'HorizontalAlignment','left');
    digtime4 = text(10,12,'现在是北京时间:',...
        'FontSize',15,'color',[0 0 1],...
        'VerticalAlignment','middle',...
        'HorizontalAlignment','left');
    % \.//////////////\.//////////////\.//////////////
    axis equal
    drawnow
    pause(onetick)
end
end
% \.//////////////\.//////////////\.//////////////
% \.//////////////\.//////////////\.//////////////
function setfigureproperties

clear,close,clc
% set(0,'DefaultFigureWindowStyle','docked')
% ssize = get(0,'ScreenSize');
% fig=figure('units','pixels',...
%     'menubar','none',...
%     'name','clockplot',...
%     'Position', [0 0 ssize(3) ssize(4)],...
%     'numbertitle','off',...
%     'renderer','opengl',...
%     'visible','on',...
%     'color',[1 1 1]);
figure('Position',[395 86 894  700],'Units','pixels',...
        'Name','MATLAB牌手表 —— matlab爱好者出品',...
        'renderer','opengl',...
        'NumberTitle','off','Color','w','Menubar','none');
        axes('position', [0.01 0.01 0.98 0.98],'FontSize',12, ...
        'FontName','Helvetica');
axis off,hold on
drawcircle(1,12)
for n=1:12
    text(-8.5*cosd(90+(n)*360/12),8.5*sind(90+(n)*360/12),num2str(n))
    plot([0.95*10*cosd(90+(n)*360/12) 1.1*10*cosd(90+(n)*360/12)],...
        [0.95*10*sind(90+(n)*360/12) 1.1*10*sind(90+(n)*360/12)],...
        'k','LineWidth',2)
    for ns=1:5
        plot([1.0*10*cosd(90+(n)*360/12+6*ns) 1.1*10*cosd(90+(n)*360/12+6*ns)],...
            [1.0*10*sind(90+(n)*360/12+6*ns) 1.1*10*sind(90+(n)*360/12+6*ns)],...
            'k','LineWidth',1)
    end
end
% plot(0.95*10*cosd(3:6:363),0.95*10*sind(3:6:363),'k.','MarkerSize',1)
ar=3:6:363; cosar=cosd(ar); sinar=sind(ar);
x1=0.95*10*cosar; x2=0.98*10*cosar; y1=0.95*10*sinar; y2=0.97*10*sinar;
for n=1:numel(x1)
    plot([x1(n) x2(n)],[y1(n) y2(n)],'k')
end
end
% \.//////////////\.//////////////\.//////////////
% \.//////////////\.//////////////\.//////////////
function setaxisproperties
% Set the axis properties (value of the variable ax is greater than (rs+somesmallvalue))
axis([-14 20 -14 14]);
end
% \.//////////////\.//////////////\.//////////////
% \.//////////////\.//////////////\.//////////////
function drawcircle(varargin)

th=0:12:360;
for n=1:nargin
    if varargin{n}==max(varargin{:});plot(varargin{n}*cosd(th),varargin{n}*sind(th),'LineWidth',6)
    elseif varargin{n}==min(varargin{:});fill(varargin{n}*cosd(th),varargin{n}*sind(th),'b')
    else plot(varargin{n}*cosd(th),varargin{n}*sind(th),'k')
    end
end
incr=45; plot(1.1*max(varargin{:})*cosd(0:incr:360),1.1*max(varargin{:})*sind(0:incr:360),'LineWidth',6)
end
% \.//////////////\.//////////////\.//////////////
% \.//////////////\.//////////////\.//////////////
function [month]=findmonth(number)
switch number
    case 1;m='Jan';case 2;m='Feb';case 3;m='March';case 4;m='Apr';case 5;m='May';case 6;m='June';
    case 7;m='July';case 8;m='Aug';case 9;m='Sept';case 10;m='Oct';case 11;m='Nov';case 12;m='Dec';
end;month = m;
end
% \.//////////////\.//////////////\.//////////////
% \.//////////////\.//////////////\.//////////////
function [week]=findweek(number)
if number>1 && number<=7;
    week=1;
elseif number>=8 && number<=14
    week=2;
elseif number>=15 && number<=21
    week=3;
elseif number>-22 && number<=31
    week=4;
end
end
% \.//////////////\.//////////////\.//////////////
% \.//////////////\.//////////////\.//////////////
function firework
% 烟花烟花满天飞
OldHandle = findobj( 'Type', 'figure', 'Tag', 'FireWork' );
if ishandle(OldHandle)
    close(OldHandle);
end
% 图形窗口初始化
figure('units','normalized','position',[0.1 0.1 0.8 0.8],...
    'menubar','none','name','烟花满天飞',...
    'numbertitle','off','color',[0 0 0],'tag','FireWork');
% 烟花炸开前的初始位置
h0 = line(0,0,0,'marker','.',...
    'markersize',18,...
    'MarkerEdgeColor',[1 1 1],...
    'MarkerFaceColor',[1 1 1],...
    'color',[0 0 0]);
hold on;
h = scatter3(0,0,0,60,'k','filled','Marker','h','Visible','off');
% 设置坐标系显示属性
axis equal;
axis([-50 50 -50 50 0 120]);
axis off;
view(-42,22);

% 设置参数
v0 = 45;  % 烟花头初始速度
g = -9.8;   % 重力加速度
usedtime = -v0/g - 0.8;  % 烟花头爆炸前所经历时间
zs = v0*usedtime+0.5*g*usedtime^2;  %烟花头爆炸前达到的最高高度
rng(1);
theta = rand(500,1)*2*pi;  % 各粒子速度的方位角
phi =  rand(500,1)*2*pi-pi;  % 各粒子速度的仰角
v1 = 20;  % 粒子的初始速度
xi = v1*cos(phi).*cos(theta); % 各粒子x方向的速度
yi = v1*cos(phi).*sin(theta); % 各粒子y方向的速度
age = 20;  % 粒子生存期
% 常用颜色矩阵
colormat = [1.0  0.5  0.5
    1.0  0.75  0.5
    1.0  1.0  0.5
    0.75  1.0  0.5
    0.5  1.0  0.5
    0.5  1.0  0.75
    0.5  1.0  1.0
    0.5  0.75  1.0
    0.5  0.5  1.0
    0.75  0.5  1.0
    1.0  0.5  1.0
    1.0  0.5  0.75];
% 随机产生各粒子对应的颜色序号
colorid = randsample(12,500,true);
% 粒子对应的颜色矩阵
colormat0 = colormat(colorid,:);
% 粒子颜色与背景色(夜色)的距离
colordist = sqrt(mean(sum(colormat0.^2,2)));
rate = 0.25;  % 颜色随时间的衰减率

timerA = timer('TimerFcn',@TimerFcnA,...
    'executionmode','fixedspacing','Period',0.1);
start(timerA);
timerB = timer('TimerFcn',{@TimerFcnB},...
    'executionmode','fixedspacing','period',0.1);

%--------------------------------------------------------------------------
%  定时器回调函数(烟花头)
%--------------------------------------------------------------------------
function TimerFcnA(timerA,~)
ta = get(timerA,'TasksExecuted')*0.1;
if ta <= usedtime
    z = v0*ta+0.5*g*ta^2;
    set(h0,'zdata',z,...
        'MarkerEdgeColor',[1 1 1],...
        'MarkerFaceColor',[1 1 1]);
    drawnow;
    %pause(0.01)
else
    delete(h0);
    stop(timerA);
    set(h,'Visible','on');
    start(timerB);
end
end
%--------------------------------------------------------------------------
%  定时器回调函数(粒子)
%--------------------------------------------------------------------------
function TimerFcnB(timerB,~)
tb = get(timerB,'TasksExecuted')*0.1;
if age>0 && colordist>=0.02
    colormat = colormat0*(1-rate*tb);
    colordist = sqrt(mean(sum(colormat.^2,2)));
    zi = zs+v1*sin(phi)*tb+0.5*g*tb^2;
    set(h,'XData',xi*tb,'YData',yi*tb,'ZData',zi,'CData',colormat);
    drawnow;
    age = age-0.1;
else
    stop(timerB);
    delete(h);
end
end
%-------------------
end
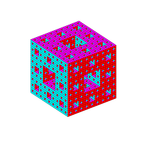
function Sponge(n)
if (n==0)
   vertices=[0 0 0;1 0 0;1 1 0;0 1 0;0 0 1;1 0 1;1 1 1;0 1 1];
   faces=[1 2 6 5;2 3 7 6;3 4 8 7;4 1 5 8;1 2 3 4;5 6 7 8];
   patch('Vertices',vertices,'Faces',faces,'FaceVertexCData',hsv(6),'FaceColor','flat')
   good_axis
else
   levelcontrol=10^n;
   L=(levelcontrol/(3^n));
   l=ceil(L);
   carp(0,0,0,levelcontrol,0,0,levelcontrol,levelcontrol,0,0,levelcontrol,0,0,0,levelcontrol,levelcontrol,0,levelcontrol,levelcontrol,levelcontrol,levelcontrol,0,levelcontrol,levelcontrol,l)
   good_axis;
end
%--------------------------------------------------------------------------
function carp(x1,y1,z1,x4,y4,z4,x52,y52,z52,x49,y49,z49,x13,y13,z13,x16,y16,z16,x64,y64,z64,x61,y61,z61,limit)
if(abs(x1-x4)>limit|abs(x16-x4)>limit|abs(x16-x13)>limit|abs(x13-x1)>limit|abs(x1-x49)>limit|abs(x61-x49)>limit|abs(x61-x13)>limit|abs(x64-x16)>limit|abs(x64-x52)>limit|abs(x52-x4)>limit|abs(x64-x61)>limit|abs(x52-x49)>limit|...
      abs(y1-y4)>limit|abs(y16-y4)>limit|abs(y16-y13)>limit|abs(y13-y1)>limit|abs(y1-y49)>limit|abs(y61-y49)>limit|abs(y61-y13)>limit|abs(y64-y16)>limit|abs(y64-y52)>limit|abs(y52-y4)>limit|abs(y64-y61)>limit|abs(y52-y49)>limit|...
      abs(z1-z4)>limit|abs(z16-z4)>limit|abs(z16-z13)>limit|abs(z13-z1)>limit|abs(z1-z49)>limit|abs(z61-z49)>limit|abs(z61-z13)>limit|abs(z64-z16)>limit|abs(z64-z52)>limit|abs(z52-z4)>limit|abs(z64-z61)>limit|abs(z52-z49)>limit)

   a=abs((x4-x1)/3);
   b=abs((y49-y1)/3);
   c=abs((z13-z1)/3);

   x2=x1+a;    y2=y1;      z2=z1;
   x3=x1+2*a;  y3=y1;      z3=z1;
   x5=x1;      y5=y1;      z5=z1+c;
   x6=x1+a;    y6=y1;      z6=z1+c;
   x7=x1+2*a;  y7=y1;      z7=z1+c;
   x8=x4;      y8=y1;      z8=z1+c;
   x9=x1;      y9=y1;      z9=z1+2*c;
   x10=x1+a;   y10=y1;     z10=z1+2*c;
   x11=x1+2*a; y11=y1;     z11=z1+2*c;
   x12=x4;     y12=y1;     z12=z1+2*c;
   x14=x1+a;   y14=y1;     z14=z13;
   x15=x1+2*a; y15=y1;     z15=z13;
   x17=x1;     y17=y1+b;   z17=z1;
   x18=x1+a;   y18=y1+b;   z18=z1;
   x19=x1+2*a; y19=y1+b;   z19=z1;
   x20=x4;     y20=y1+b;   z20=z1;
   x21=x1;     y21=y1+b;   z21=z1+c;
   x22=x1+a;   y22=y1+b;   z22=z1+c;
   x23=x1+2*a; y23=y1+b;   z23=z1+c;
   x24=x4;     y24=y1+b;   z24=z1+c;
   x25=x1;     y25=y1+b;   z25=z1+2*c;
   x26=x1+a;   y26=y1+b;   z26=z1+2*c;
   x27=x1+2*a; y27=y1+b;   z27=z1+2*c;
   x28=x4;     y28=y1+b;   z28=z1+2*c;
   x29=x1;     y29=y1+b;   z29=z13;
   x30=x1+a;   y30=y1+b;   z30=z13;
   x31=x1+2*a; y31=y1+b;   z31=z13;
   x32=x4;     y32=y1+b;   z32=z13;
   x33=x1;     y33=y1+2*b; z33=z1;
   x34=x1+a;   y34=y1+2*b; z34=z1;
   x35=x1+2*a; y35=y1+2*b; z35=z1;
   x36=x4;     y36=y1+2*b; z36=z1;
   x37=x1;     y37=y1+2*b; z37=z1+c;
   x38=x1+a;   y38=y1+2*b; z38=z1+c;
   x39=x1+2*a; y39=y1+2*b; z39=z1+c;
   x40=x4;     y40=y1+2*b; z40=z1+c;
   x41=x1;     y41=y1+2*b; z41=z1+2*c;
   x42=x1+a;   y42=y1+2*b; z42=z1+2*c;
   x43=x1+2*a; y43=y1+2*b; z43=z1+2*c;
   x44=x4;     y44=y1+2*b; z44=z1+2*c;
   x45=x1;     y45=y1+2*b; z45=z13;
   x46=x1+a;   y46=y1+2*b; z46=z13;
   x47=x1+2*a; y47=y1+2*b; z47=z13;
   x48=x4;     y48=y1+2*b; z48=z13;
   x50=x1+a;   y50=y49;    z50=z1;
   x51=x1+2*a; y51=y49;    z51=z1;
   x53=x1;     y53=y49;    z53=z1+c;
   x54=x1+a;   y54=y49;    z54=z1+c;
   x55=x1+2*a; y55=y49;    z55=z1+c;
   x56=x4;     y56=y49;    z56=z1+c;
   x57=x1;     y57=y49;    z57=z1+2*c;
   x58=x1+a;   y58=y49;    z58=z1+2*c;
   x59=x1+2*a; y59=y49;    z59=z1+2*c;
   x60=x4;     y60=y49;    z60=z1+2*c;
   x62=x1+a;   y62=y49;    z62=z13;
   x63=x1+2*a; y63=y49;    z63=z13;

   carp(x1,y1,z1,x2,y2,z2,x18,y18,z18,x17,y17,z17,x5,y5,z5,x6,y6,z6,x22,y22,z22,x21,y21,z21,limit);
   carp(x2,y2,z2,x3,y3,z3,x19,y19,z19,x18,y18,z18,x6,y6,z6,x7,y7,z7,x23,y23,z23,x22,y22,z22,limit);
   carp(x3,y3,z3,x4,y4,z4,x20,y20,z20,x19,y19,z19,x7,y7,z7,x8,y8,z8,x24,y24,z24,x23,y23,z23,limit);
   carp(x17,y17,z17,x18,y18,z18,x34,y34,z34,x33,y33,z33,x21,y21,z21,x22,y22,z22,x38,y38,z38,x37,y37,z37,limit);
   carp(x19,y19,z19,x20,y20,z20,x36,y36,z36,x35,y35,z35,x23,y23,z23,x24,y24,z24,x40,y40,z40,x39,y39,z39,limit);
   carp(x33,y33,z33,x34,y34,z34,x50,y50,z50,x49,y49,z49,x37,y37,z37,x38,y38,z38,x54,y54,z54,x53,y53,z53,limit);
   carp(x34,y34,z34,x35,y35,z35,x51,y51,z51,x50,y50,z50,x38,y38,z38,x39,y39,z39,x55,y55,z55,x54,y54,z54,limit);
   carp(x35,y35,z35,x36,y36,z36,x52,y52,z52,x51,y51,z51,x39,y39,z39,x40,y40,z40,x56,y56,z56,x55,y55,z55,limit);
   carp(x5,y5,z5,x6,y6,z6,x22,y22,z22,x21,y21,z21,x9,y9,z9,x10,y10,z10,x26,y26,z26,x25,y25,z25,limit);
   carp(x7,y7,z7,x8,y8,z8,x24,y24,z24,x23,y23,z23,x11,y11,z11,x12,y12,z12,x28,y28,z28,x27,y27,z27,limit);
   carp(x37,y37,z37,x38,y38,z38,x54,y54,z54,x53,y53,z53,x41,y41,z41,x42,y42,z42,x58,y58,z58,x57,y57,z57,limit);
   carp(x39,y39,z39,x40,y40,z40,x56,y56,z56,x55,y55,z55,x43,y43,z43,x44,y44,z44,x60,y60,z60,x59,y59,z59,limit);
   carp(x9,y9,z9,x10,y10,z10,x26,y26,z26,x25,y25,z25,x13,y13,z13,x14,y14,z14,x30,y30,z30,x29,y29,z29,limit);
   carp(x10,y10,z10,x11,y11,z11,x27,y27,z27,x26,y26,z26,x14,y14,z14,x15,y15,z15,x31,y31,z31,x30,y30,z30,limit);
   carp(x11,y11,z11,x12,y12,z12,x28,y28,z28,x27,y27,z27,x15,y15,z15,x16,y16,z16,x32,y32,z32,x31,y31,z31,limit);
   carp(x25,y25,z25,x26,y26,z26,x42,y42,z42,x41,y41,z41,x29,y29,z29,x30,y30,z30,x46,y46,z46,x45,y45,z45,limit);
   carp(x27,y27,z27,x28,y28,z28,x44,y44,z44,x43,y43,z43,x31,y31,z31,x32,y32,z32,x48,y48,z48,x47,y47,z47,limit);
   carp(x41,y41,z41,x42,y42,z42,x58,y58,z58,x57,y57,z57,x45,y45,z45,x46,y46,z46,x62,y62,z62,x61,y61,z61,limit);
   carp(x42,y42,z42,x43,y43,z43,x59,y59,z59,x58,y58,z58,x46,y46,z46,x47,y47,z47,x63,y63,z63,x62,y62,z62,limit);
   carp(x43,y43,z43,x44,y44,z44,x60,y60,z60,x59,y59,z59,x47,y47,z47,x48,y48,z48,x64,y64,z64,x63,y63,z63,limit);
else
   fillcub(x1,y1,z1,x4,y4,z4,x52,y52,z52,x49,y49,z49,x13,y13,z13,x16,y16,z16,x64,y64,z64,x61,y61,z61);
end
%--------------------------------------------------------------------------
function fillcub(a1,b1,c1,a2,b2,c2,a3,b3,c3,a4,b4,c4,a5,b5,c5,a6,b6,c6,a7,b7,c7,a8,b8,c8)
verticesA=[a1,b1,c1;a2,b2,c2;a3,b3,c3;a4,b4,c4;a5,b5,c5;a6,b6,c6;a7,b7,c7;a8,b8,c8];
faces=[1 2 6 5;2 3 7 6;3 4 8 7;4 1 5 8;1 2 3 4;5 6 7 8];
patch('Vertices',verticesA,'Faces',faces,'FaceVertexCData',hsv(6),'FaceColor','flat');
hold on;
%--------------------------------------------------------------------------
function good_axis
axis equal
view(3)
set(gca,'Visible','off')