代码:
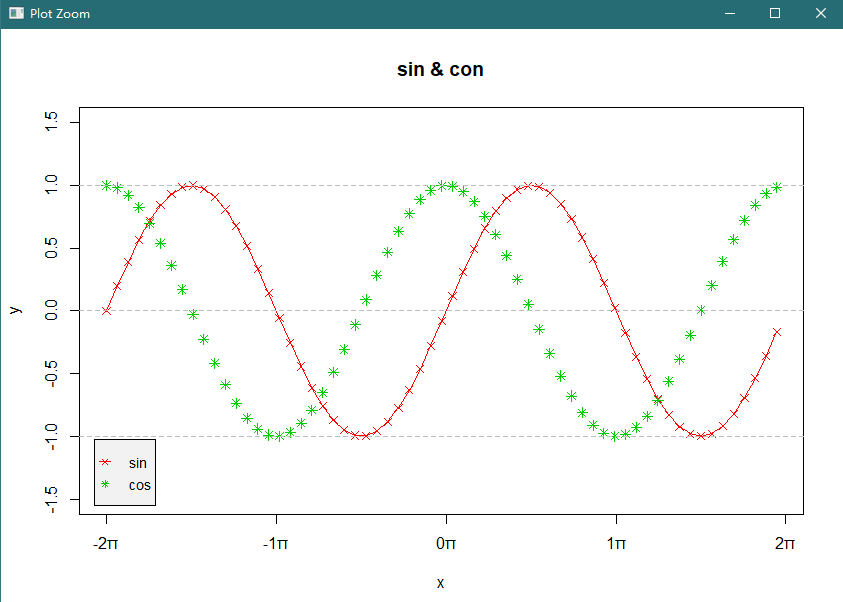
x <- seq(-2*pi, 2*pi, 0.2)

z <- pi*(-2:2)
labels <- paste(-2:2,"π", sep="") # 绘制正弦曲线 plot(x, sin(x), type="o", pch=4, col=2, ylim=c(-1.5, 1.5), xaxt="n", ann=F) # 添加余弦点图 points(x, cos(x), pch=8, col=3) # 添加参考线 abline(h=c(-1, 0,1), lty=2, col=8) # 设置图形标题和坐标轴标题 title("sin & con", xlab="x", ylab="y",) axis(1, at=z, labels=labels) # 添加图例 legend("bottomleft", inset=0.02, c("sin", "cos"), col=c(2, 3), lty=c(1, -1), pch=c(4, 8), bg="gray95", cex=0.9,pt.cex=0.7, seg.len=0.6, text.width=0.3)
图形: