library(igraph)
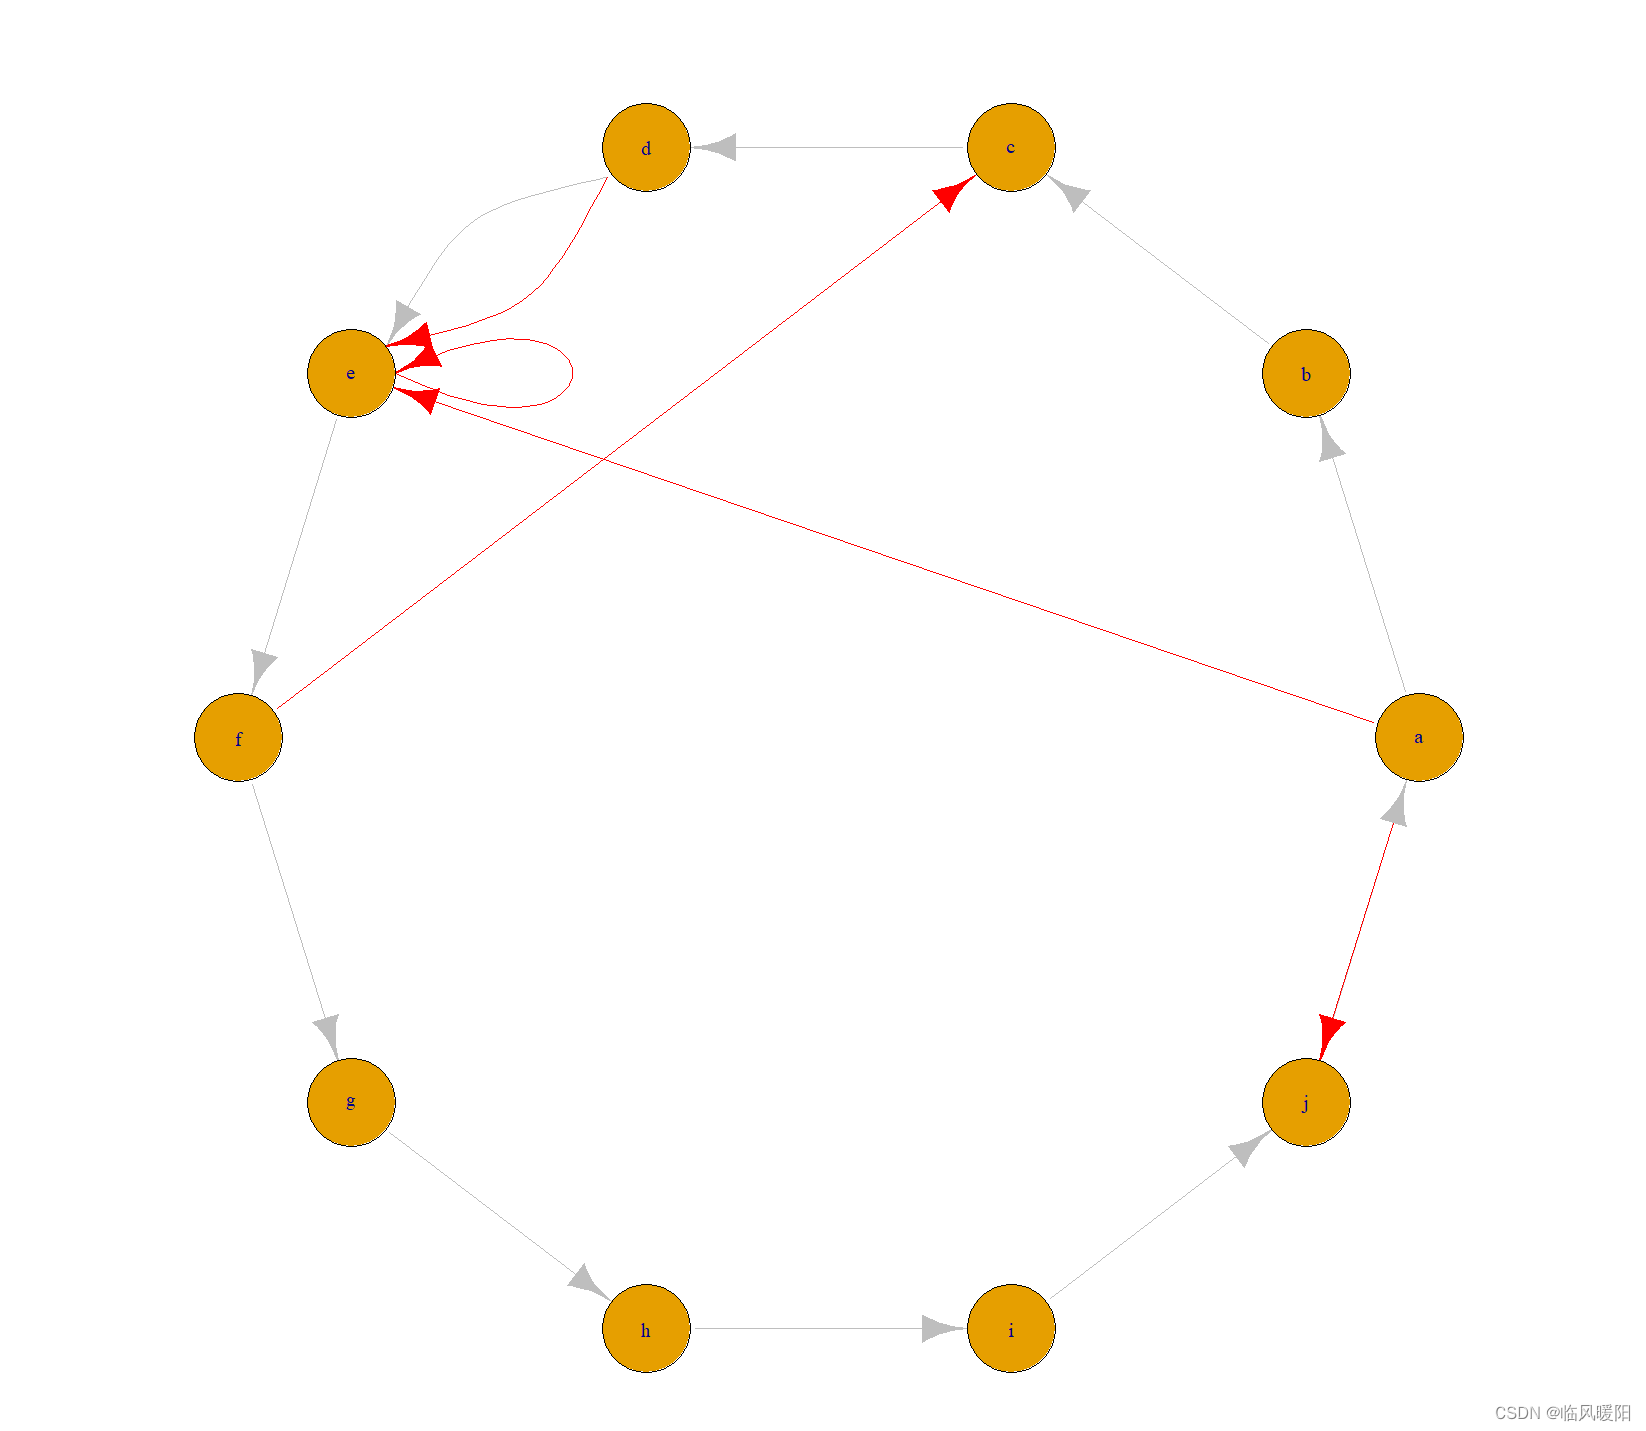
# 10 vertices named a,b,c,... and no edges
g <- make_empty_graph() + vertices(letters[1:10])
# Add edges to make it a ring
g <- g + path(letters[1:10], letters[1], color = "grey")
# Add some extra random edges
g <- g + edges(sample(V(g), 10, replace = TRUE), color = "red")
g$layout <- layout_in_circle
plot(g)
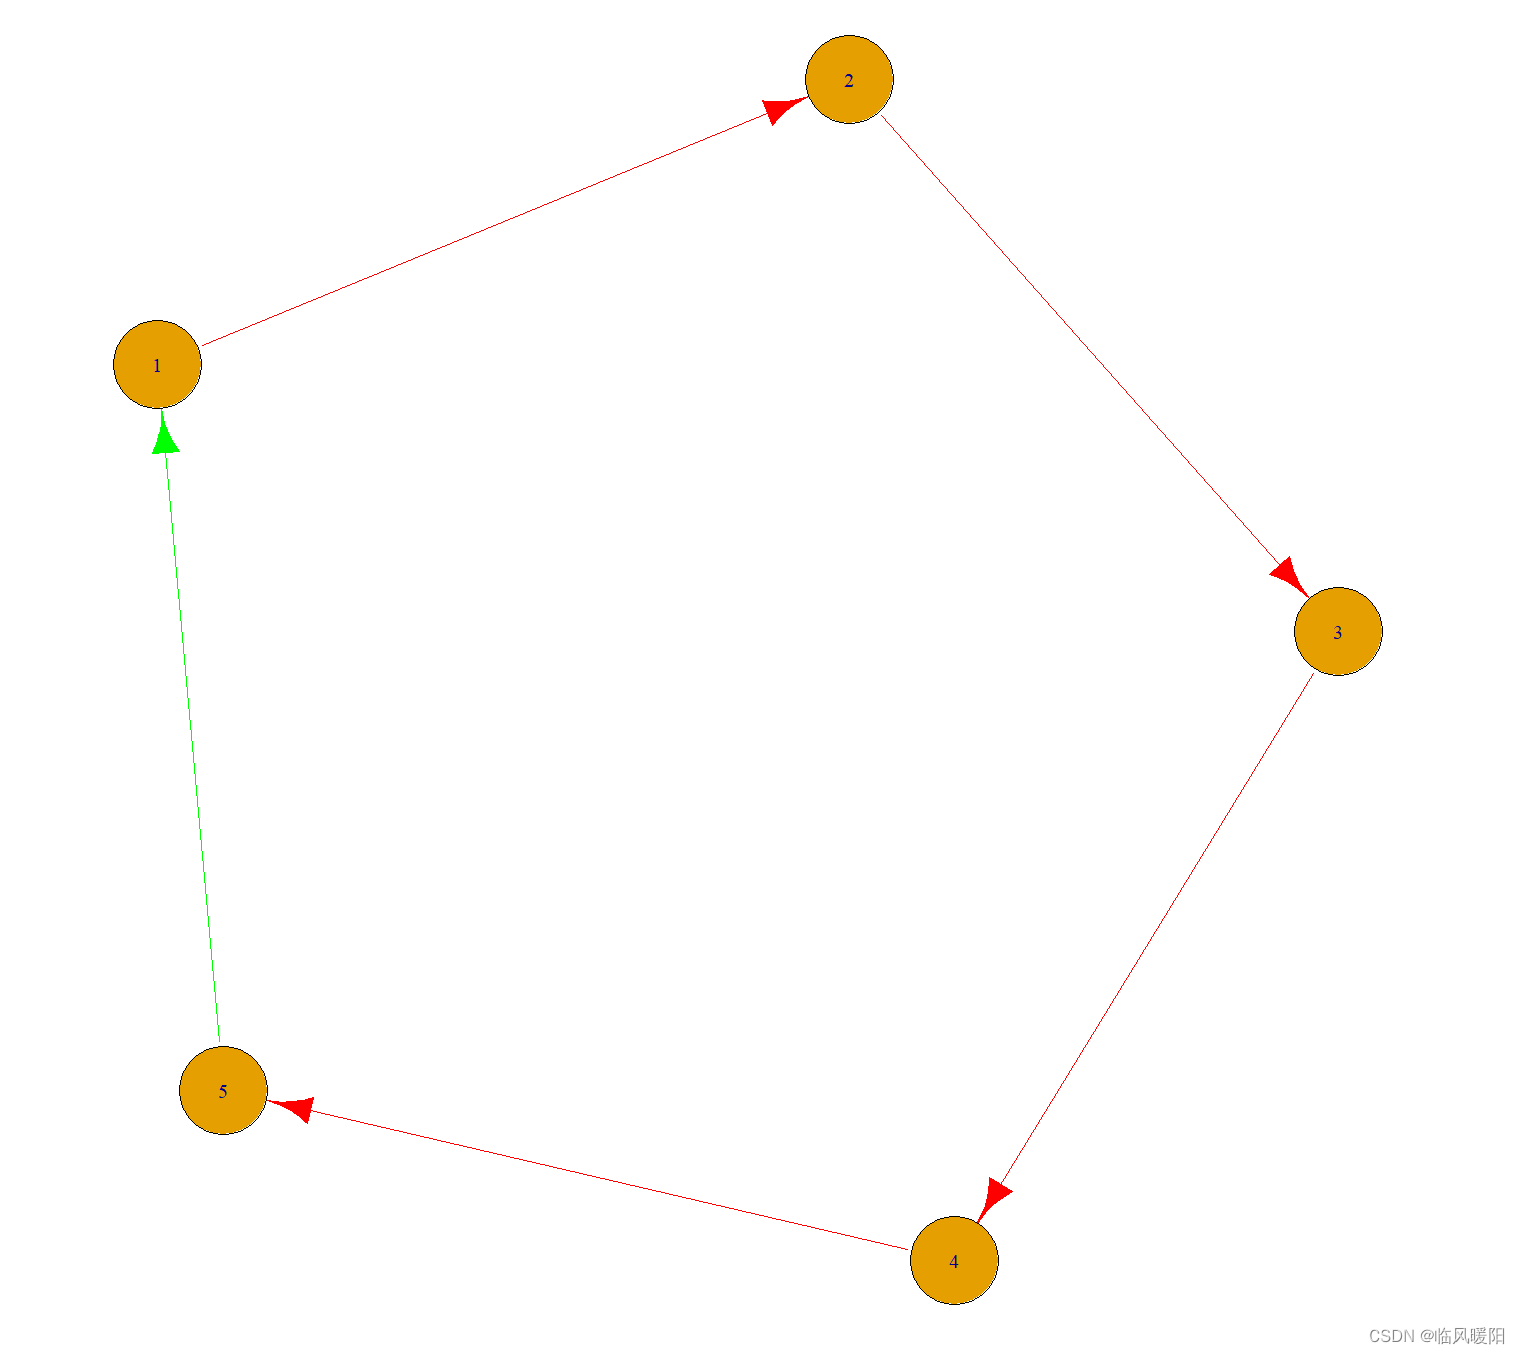
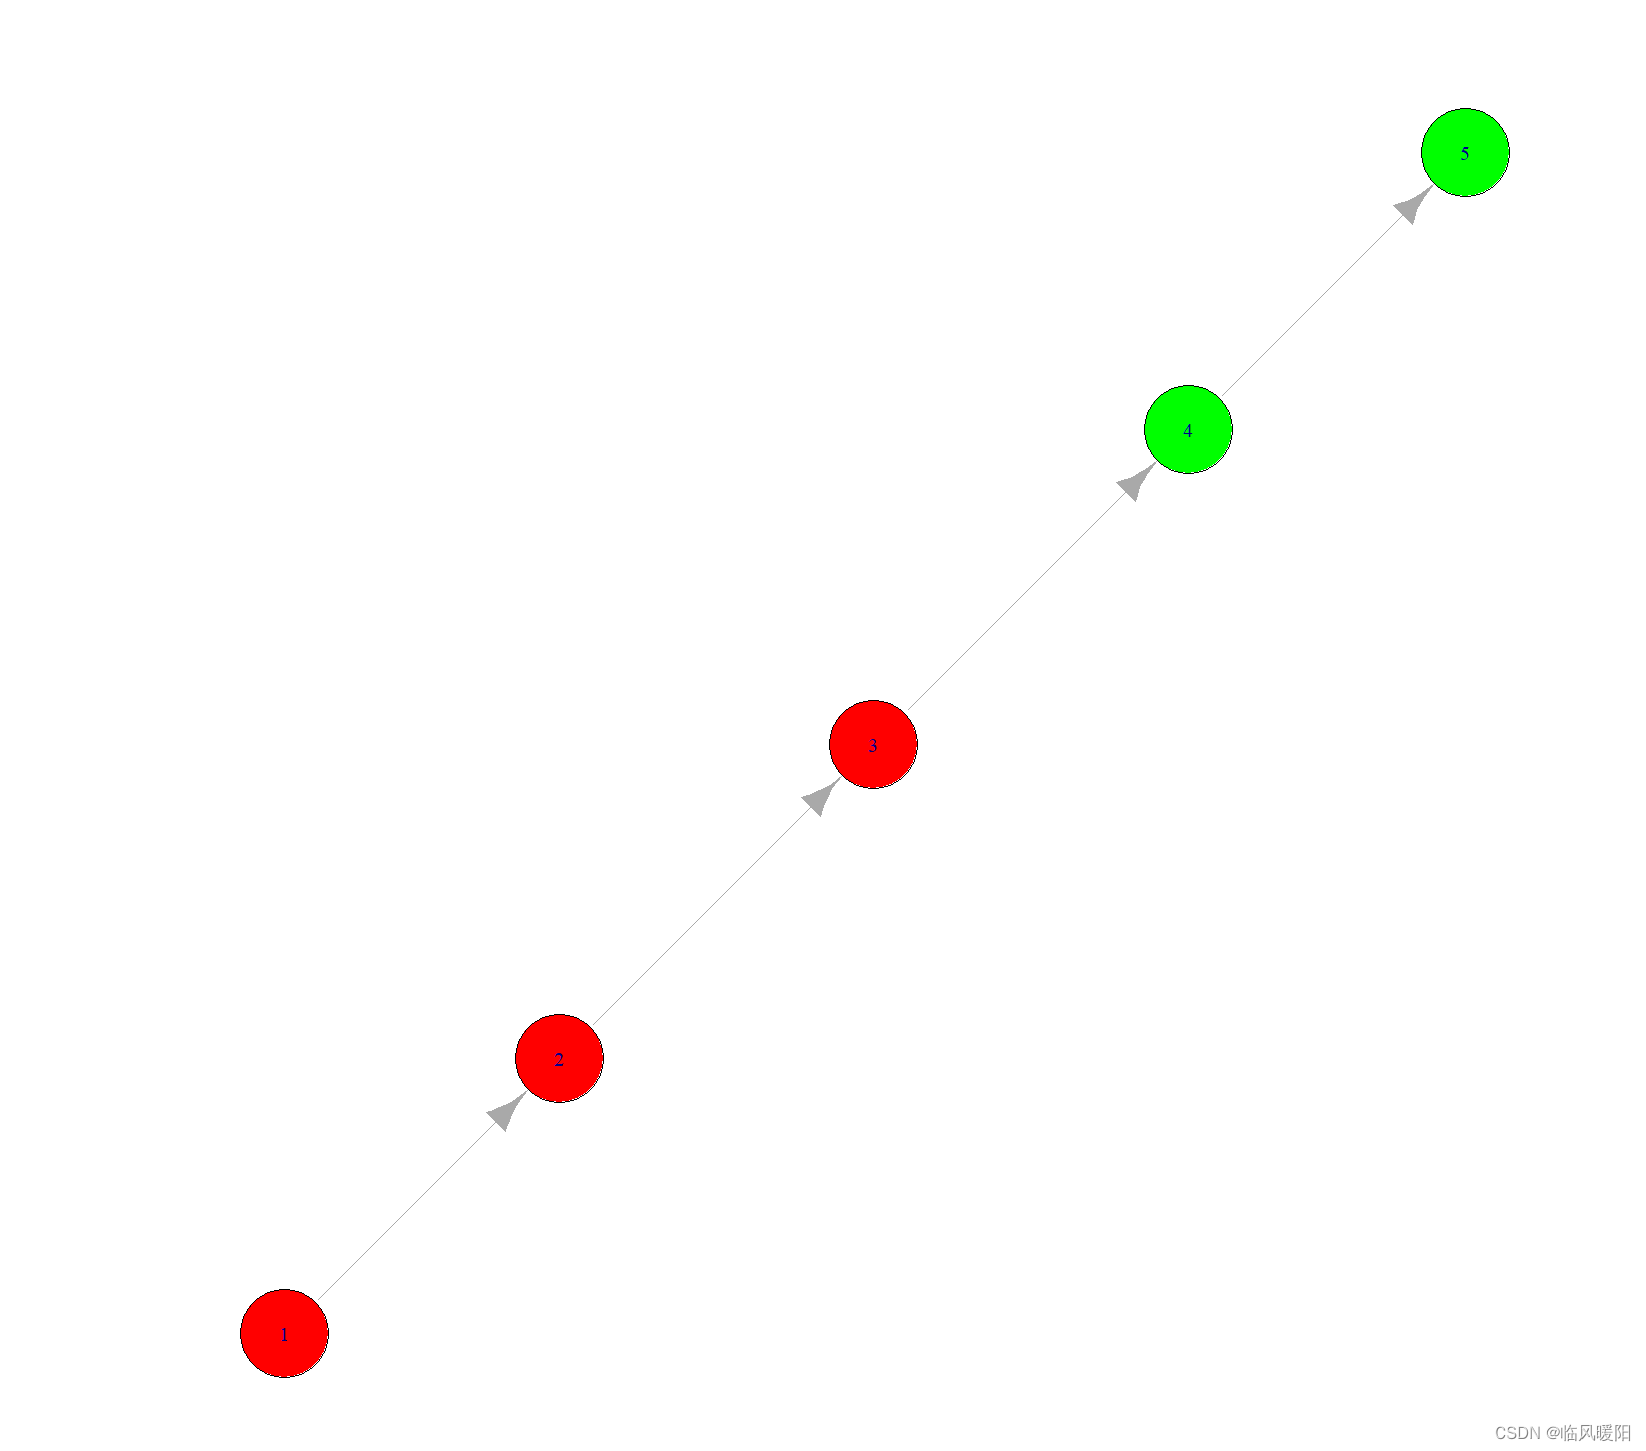
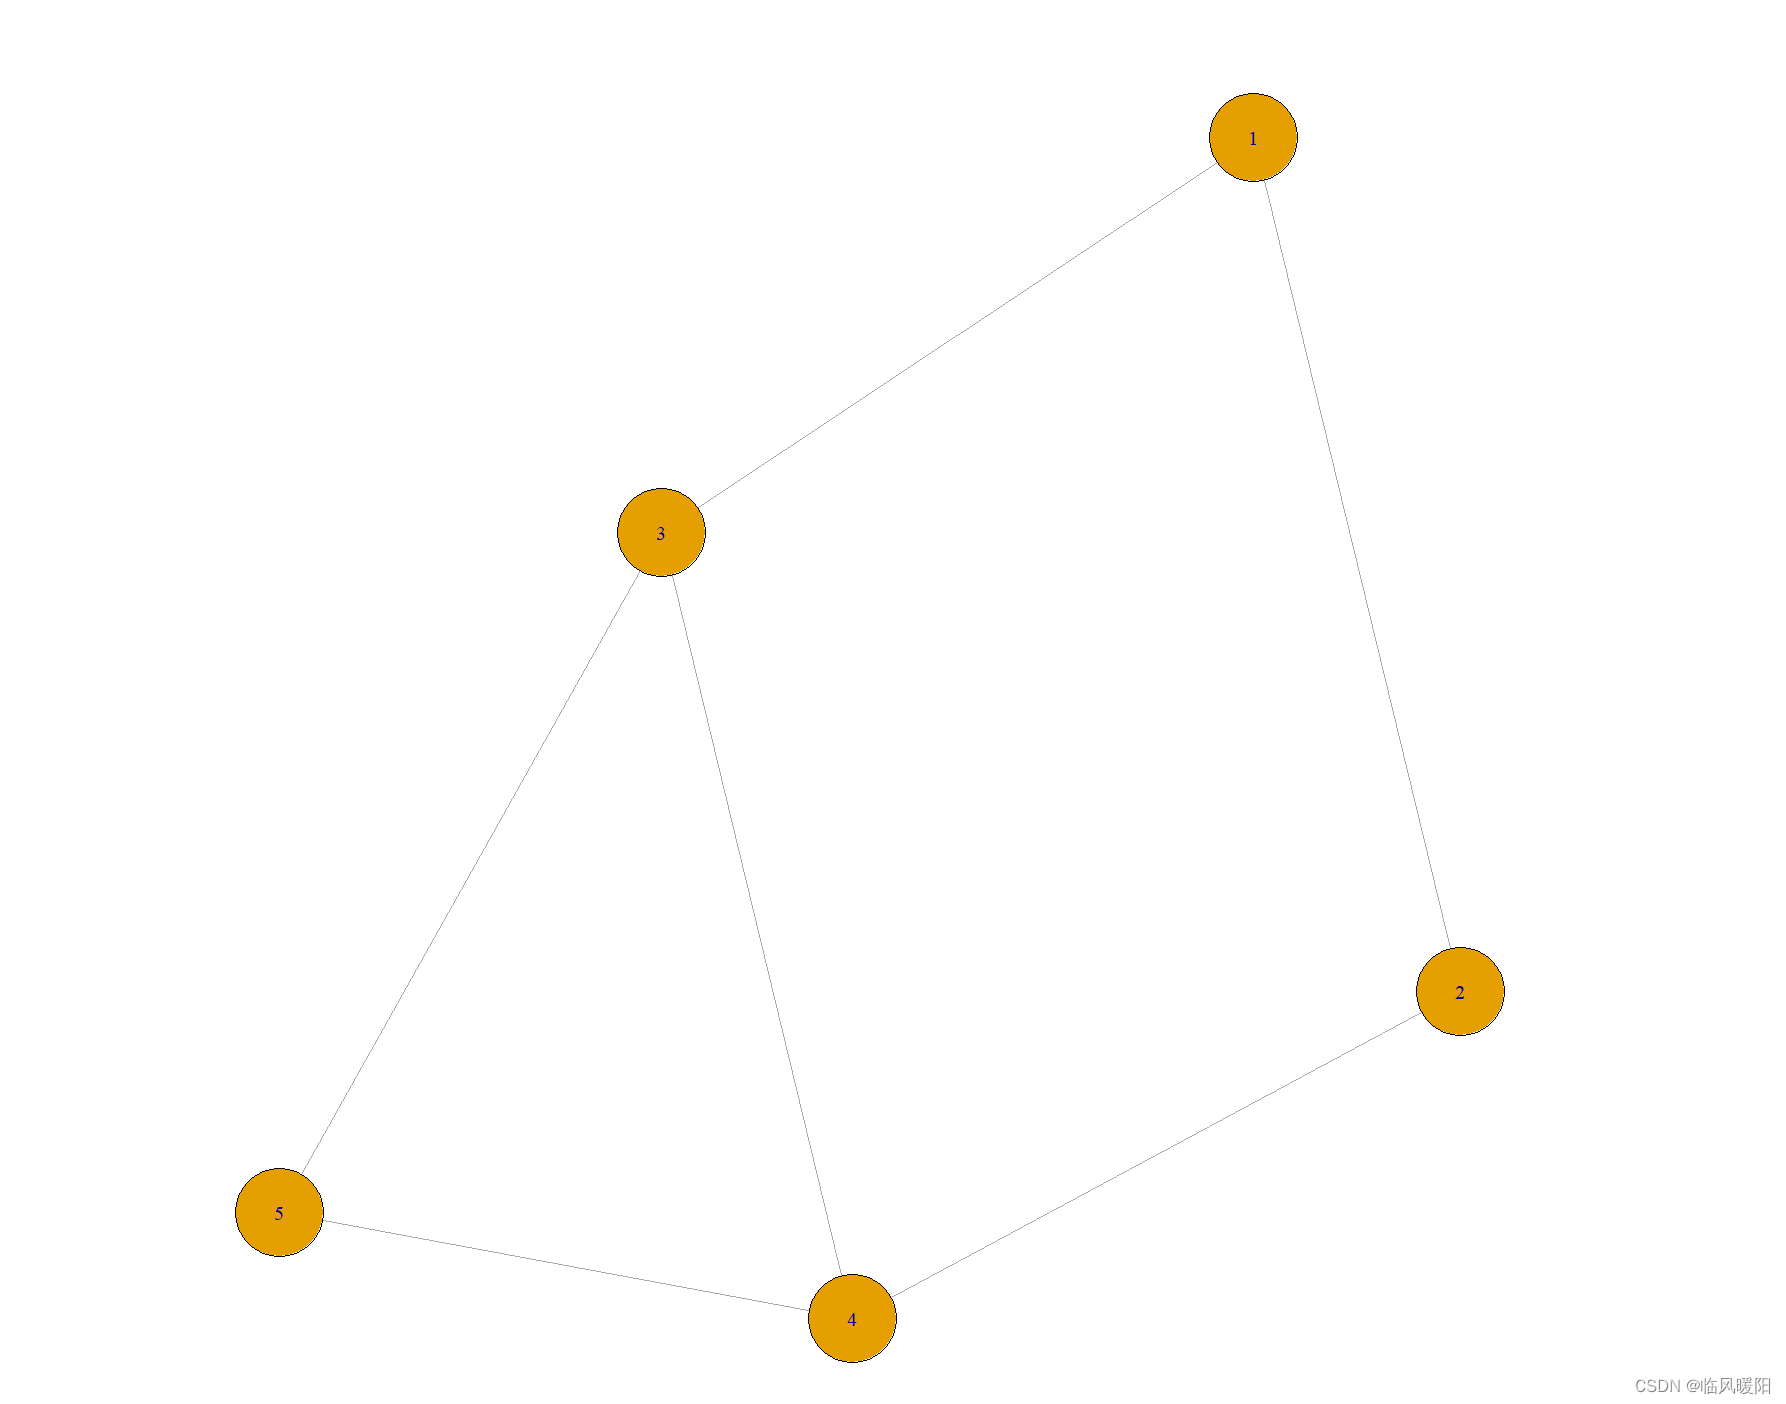
g <- make_empty_graph(n = 5) %>%
  add_edges(c(
    1, 2,
    2, 3,
    3, 4,
    4, 5
  )) %>%
  set_edge_attr("color", value = "red") %>%
  add_edges(c(5, 1), color = "green")
E(g)[[]]
plot(g)
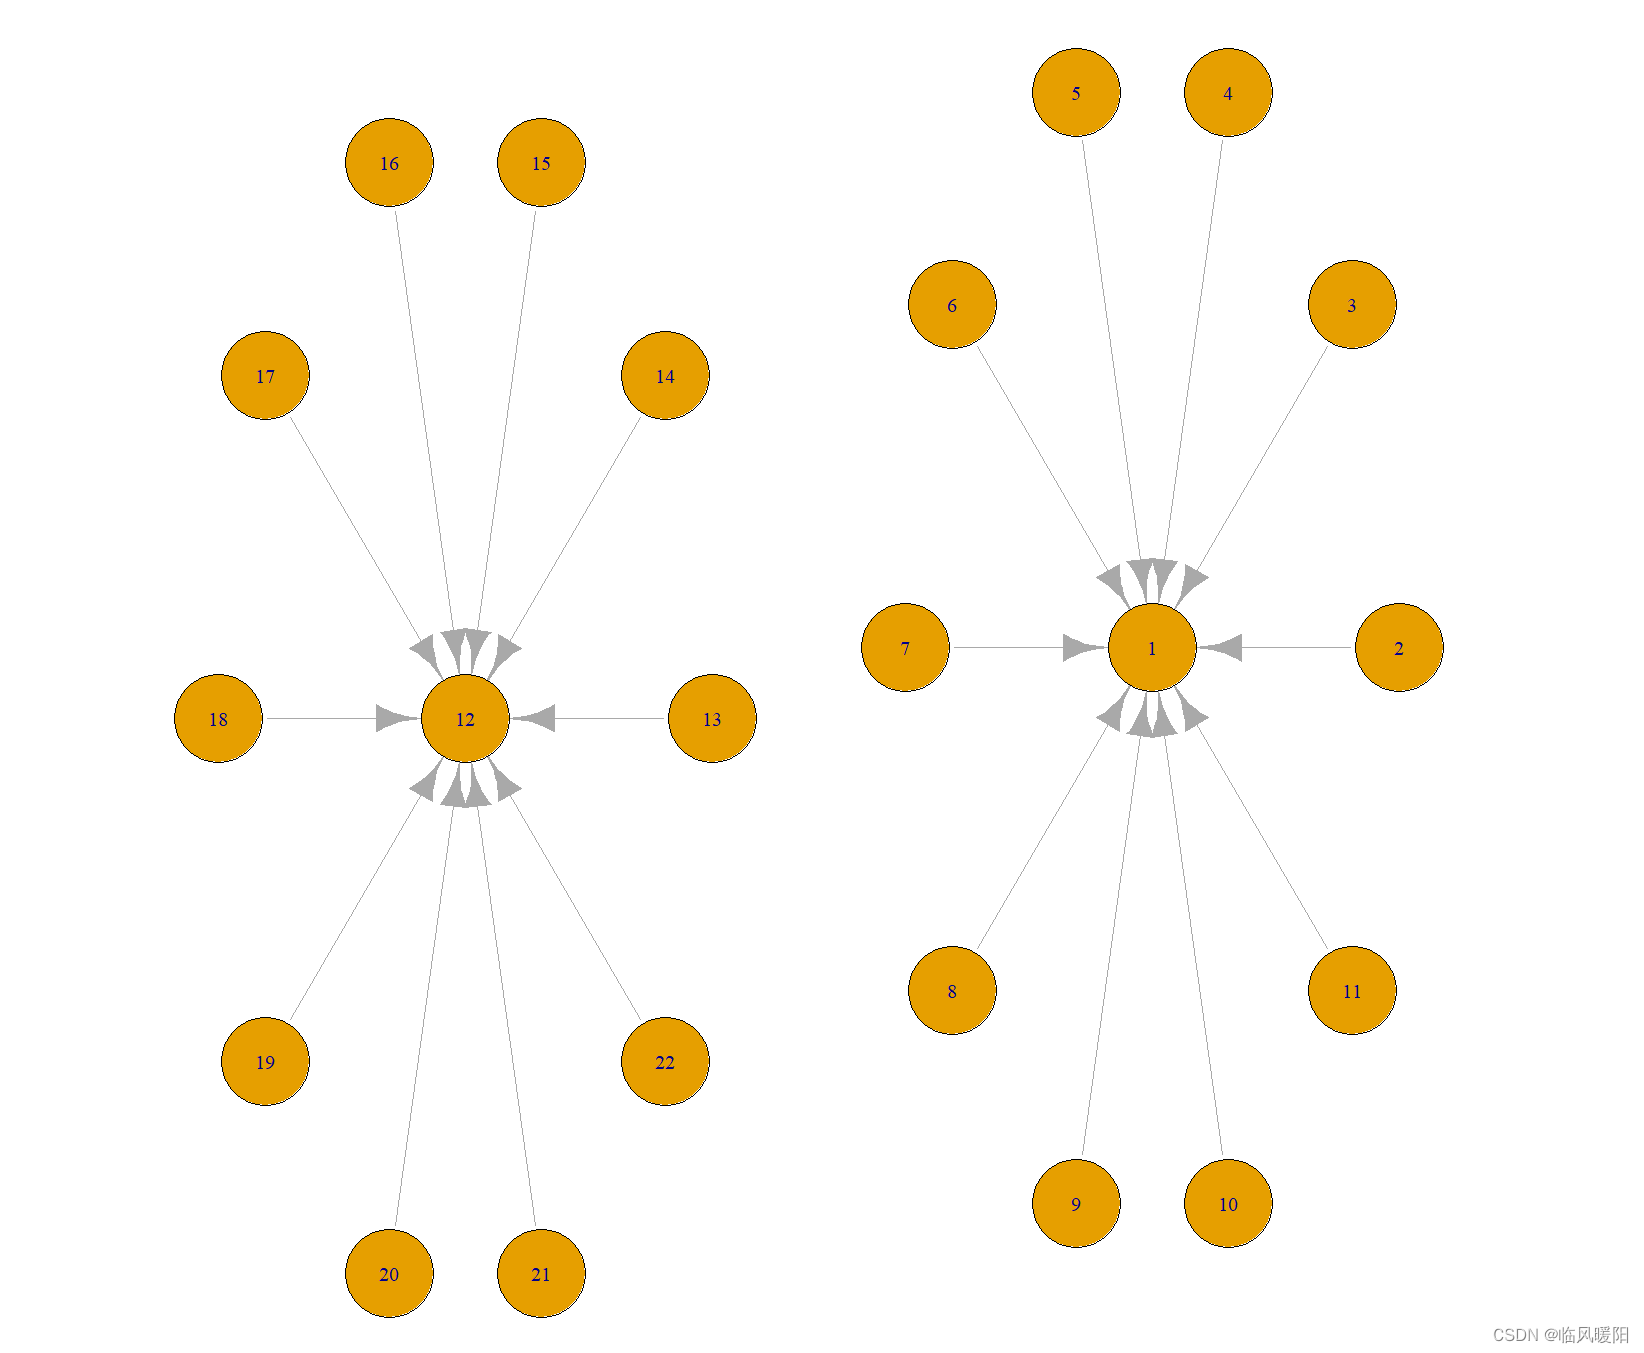
(make_star(11) + make_star(11)) %>%
  add_layout_(as_star(), component_wise()) %>%
  plot()
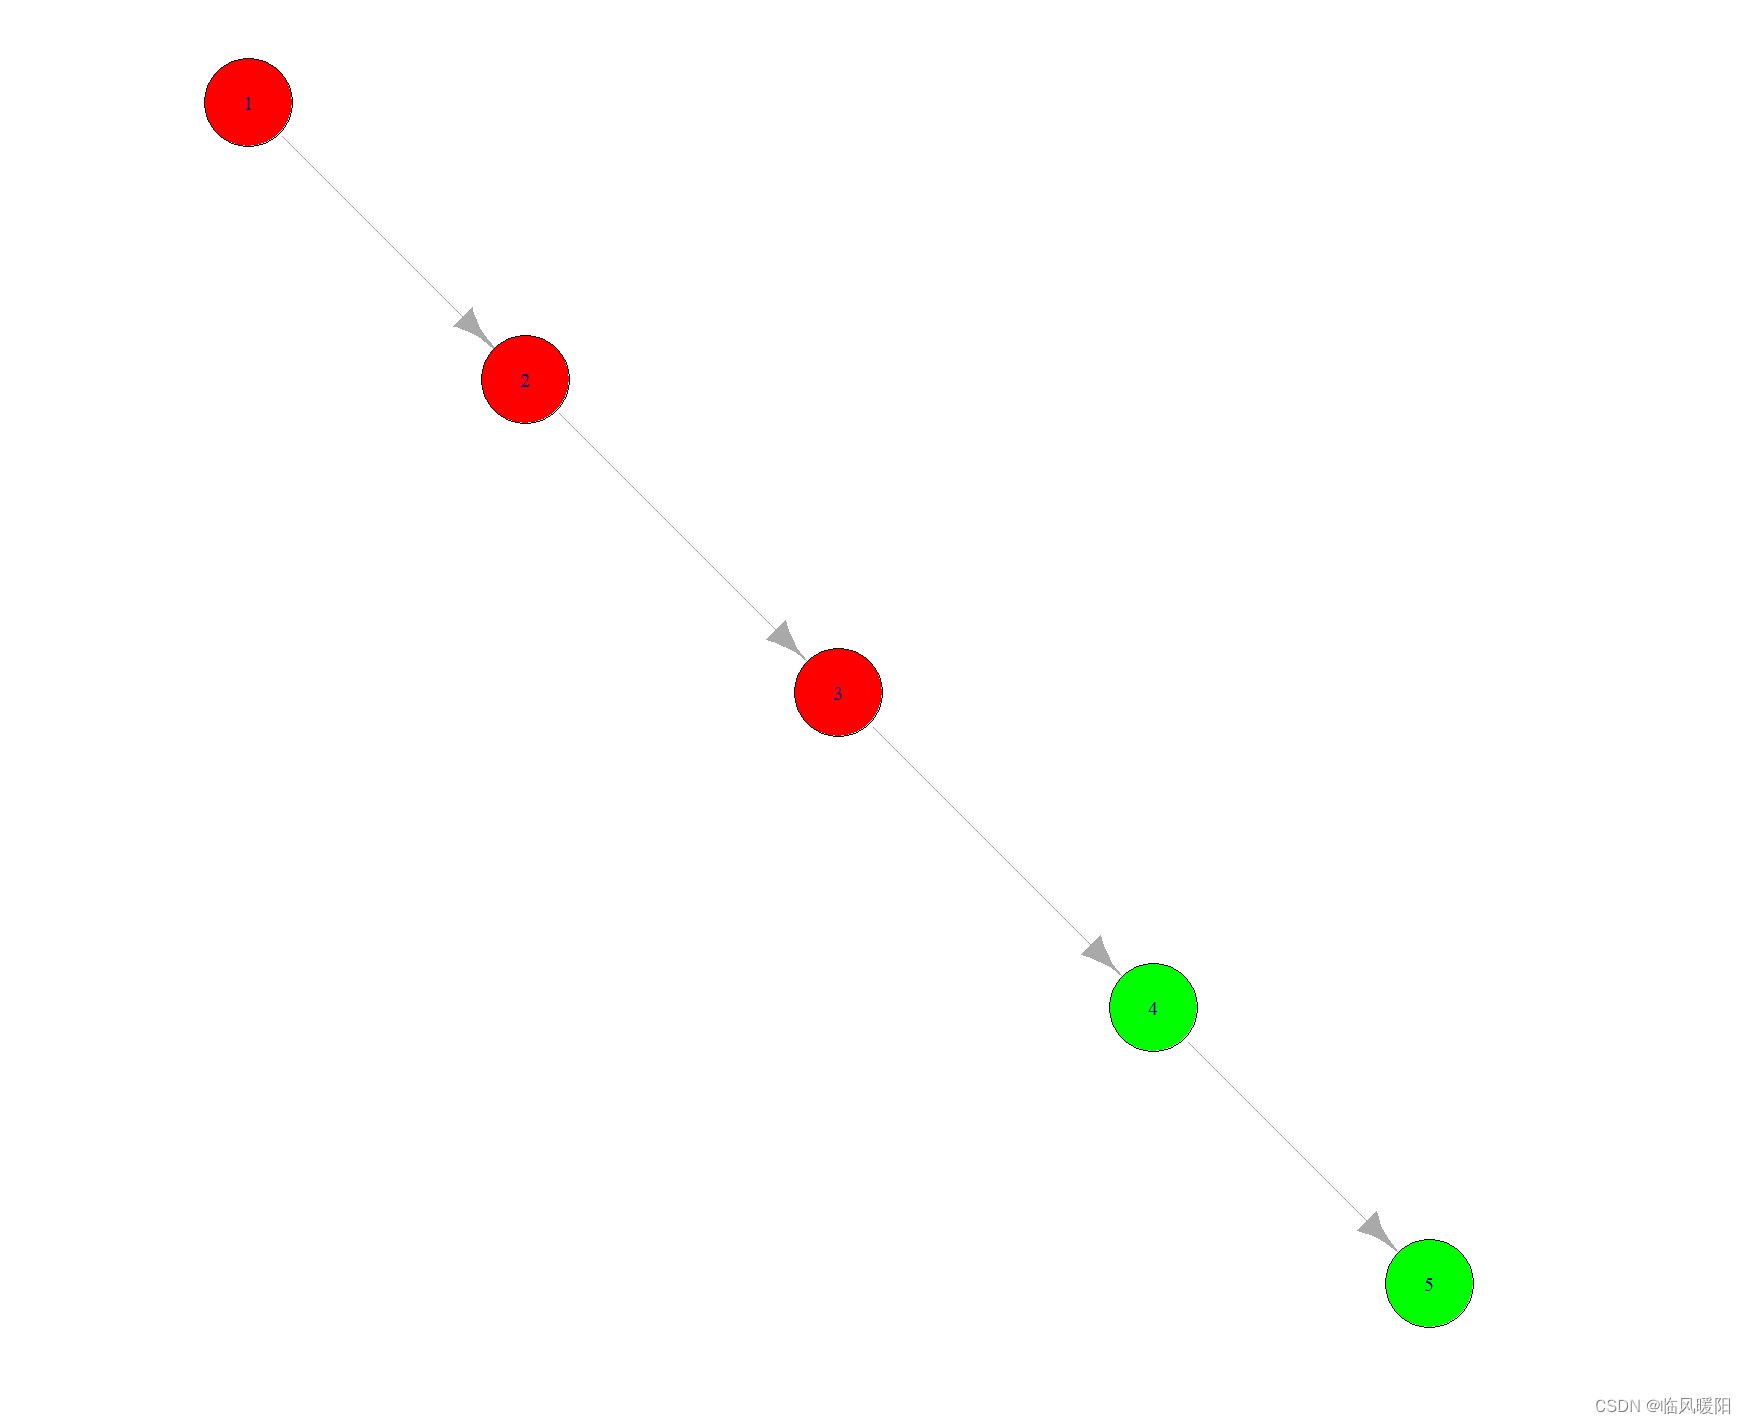
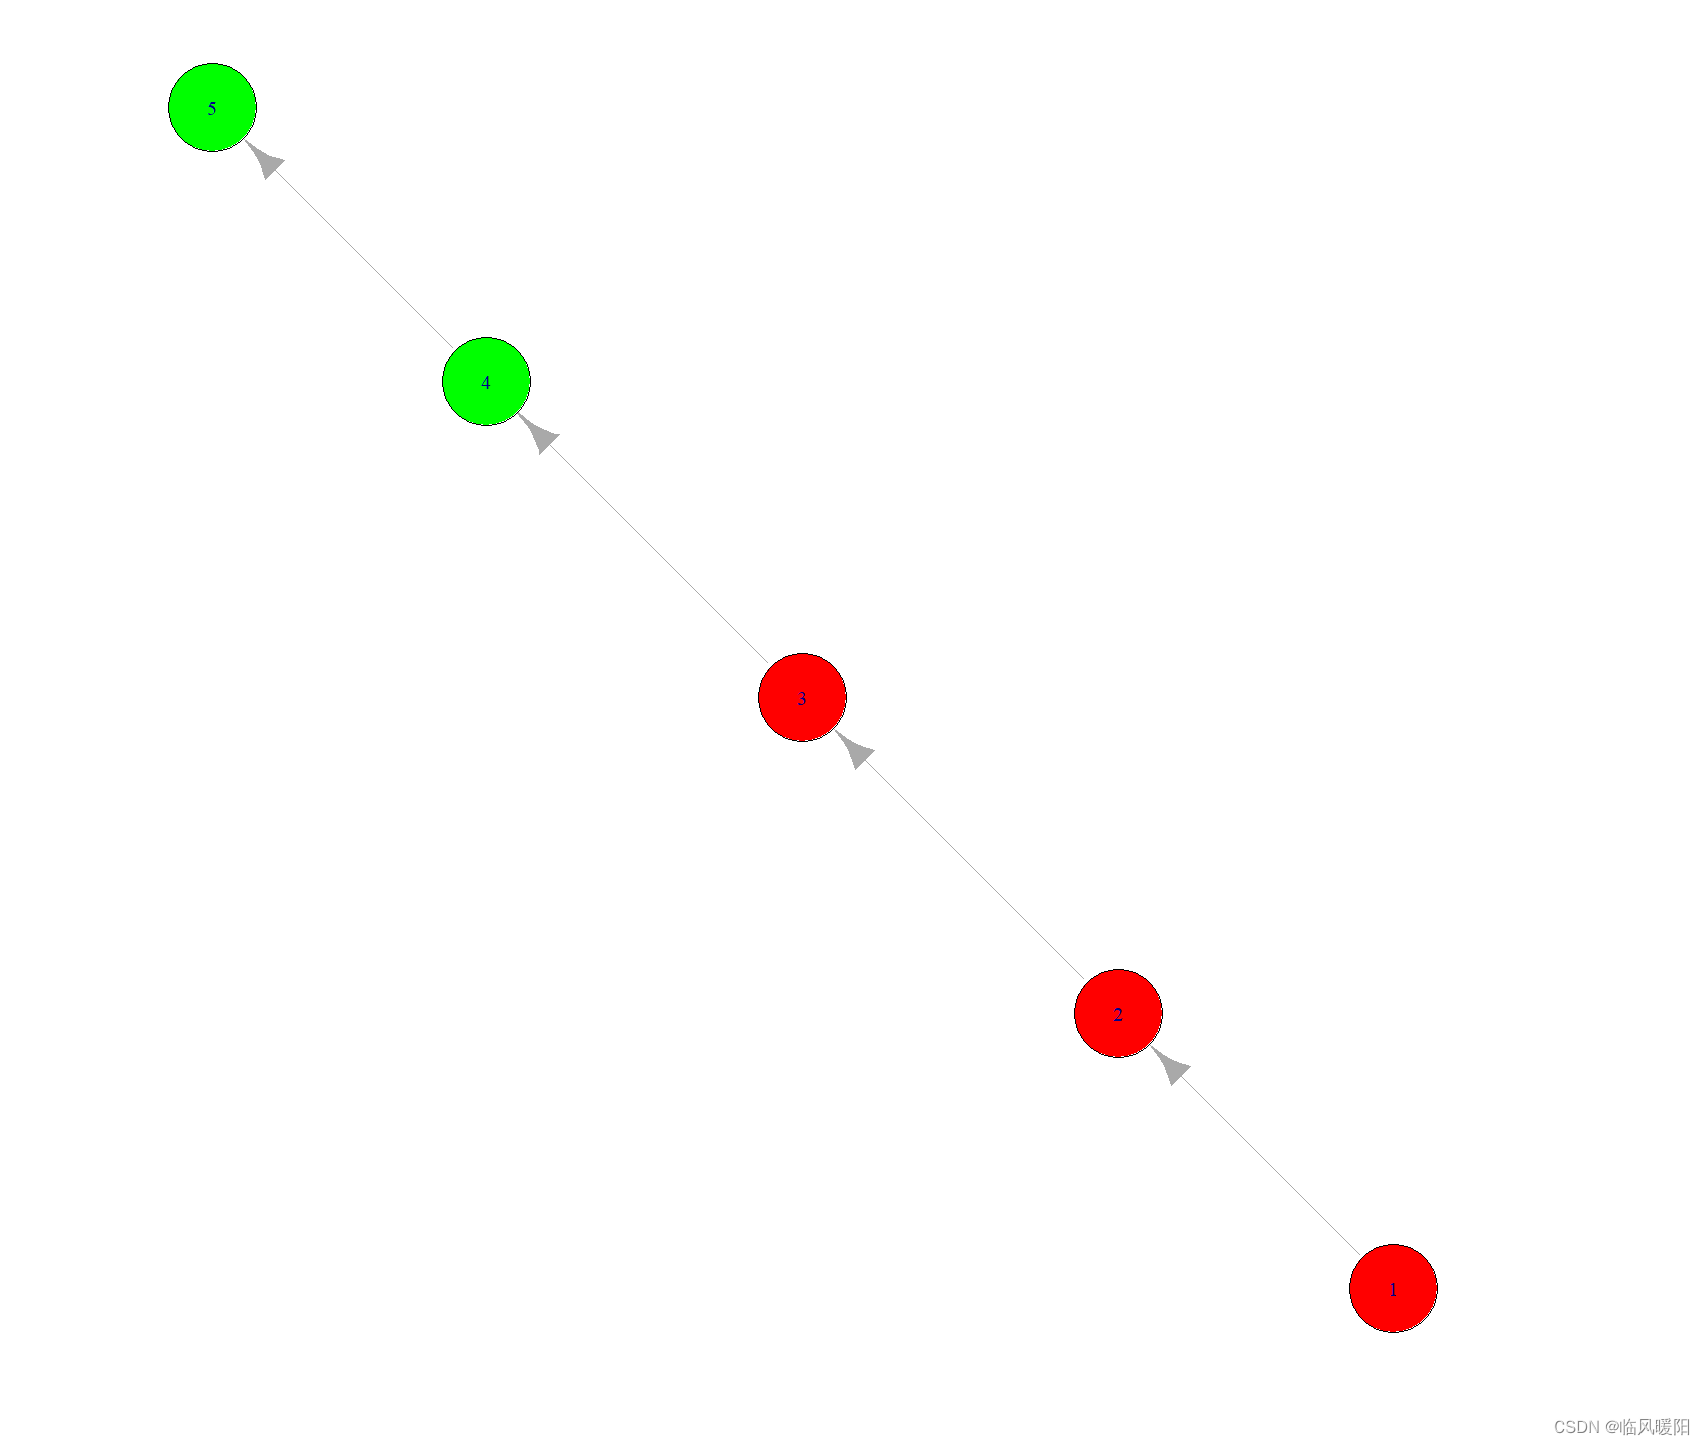
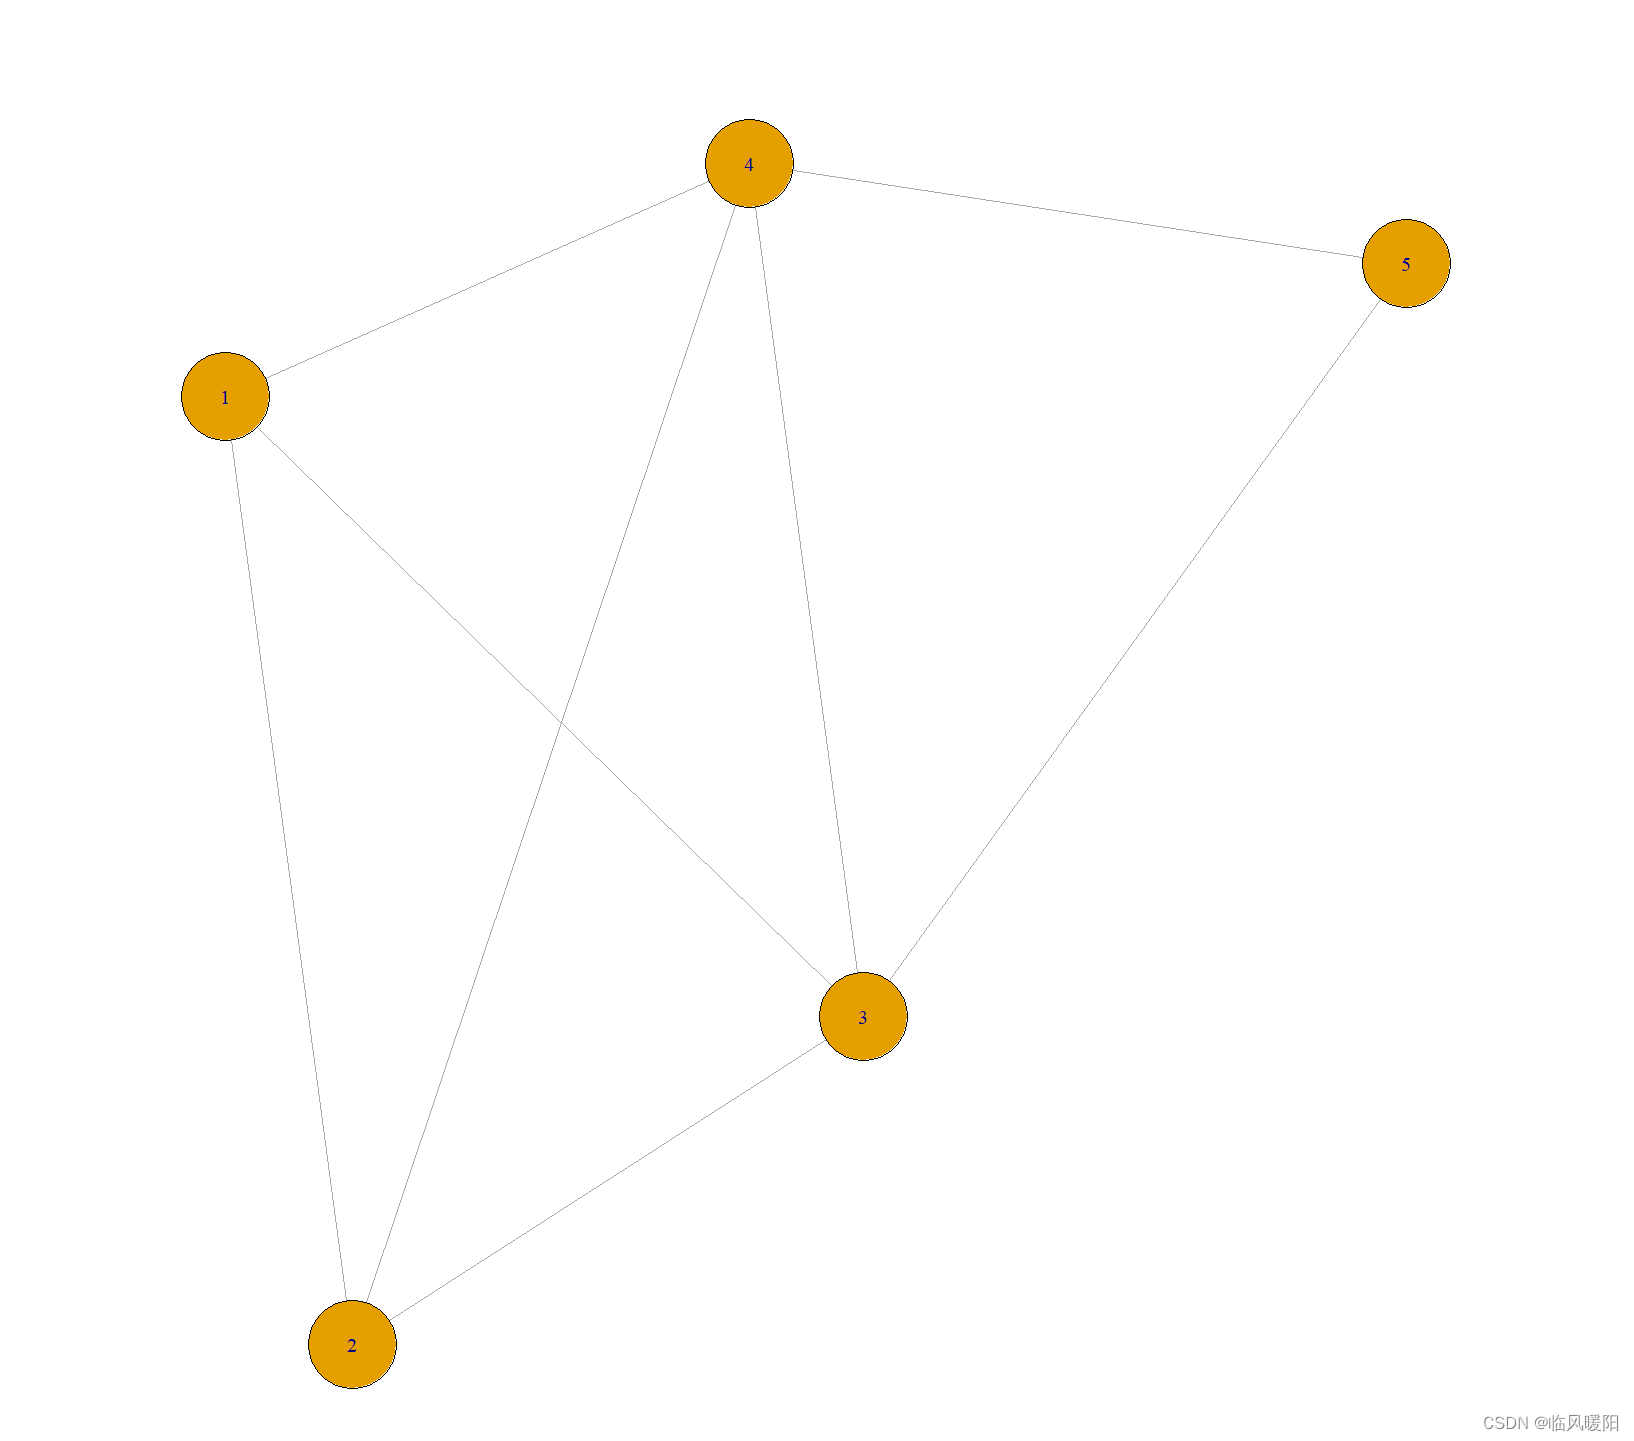
g <- make_empty_graph() %>%
  add_vertices(3, color = "red") %>%
  add_vertices(2, color = "green") %>%
  add_edges(c(
    1, 2,
    2, 3,
    3, 4,
    4, 5
  ))
g
V(g)[[]]
plot(g)
library(igraph)
g <- make_graph("Zachary")
adjacent_vertices(g, c(1, 34))
plot(g)

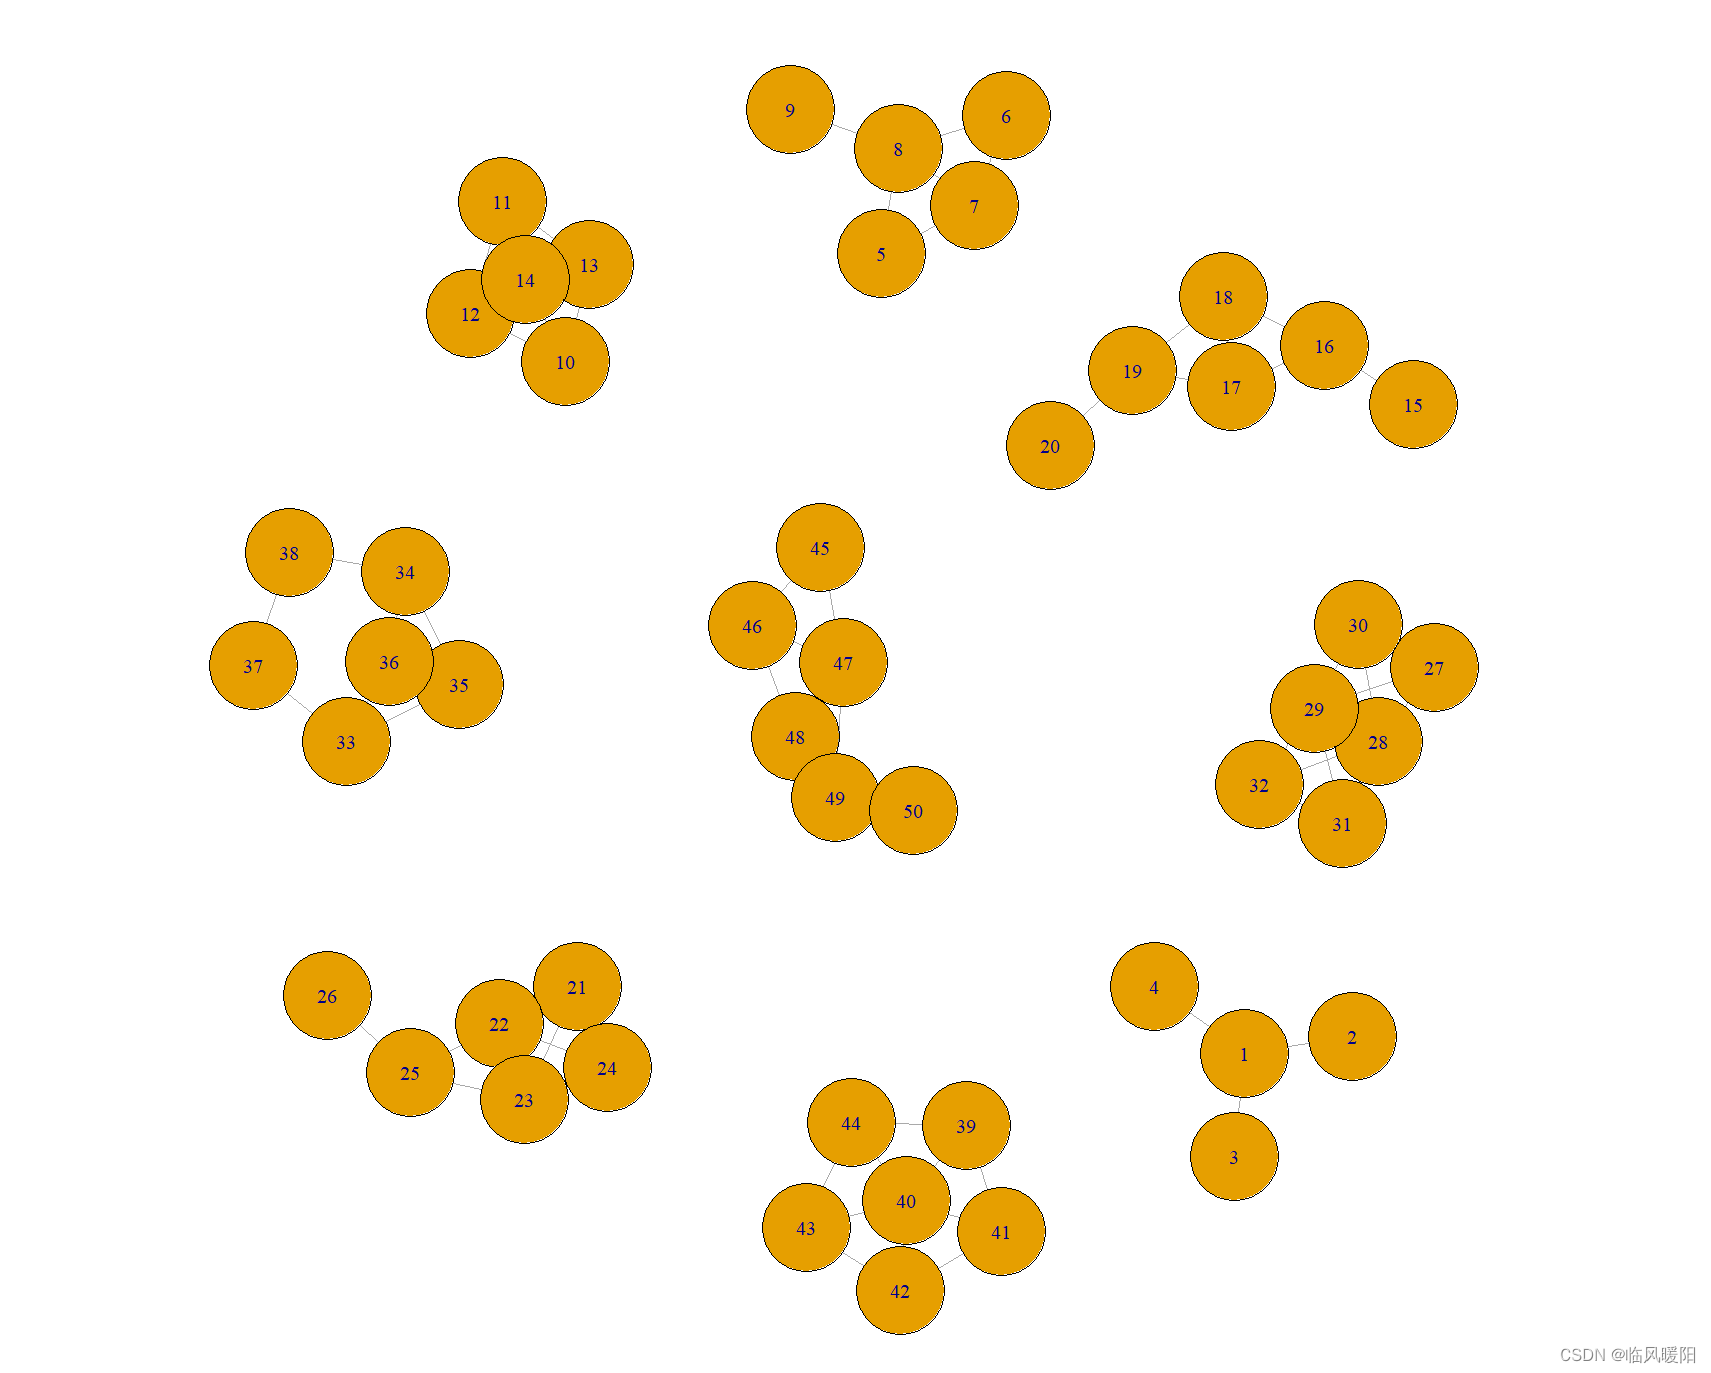
library(igraph)
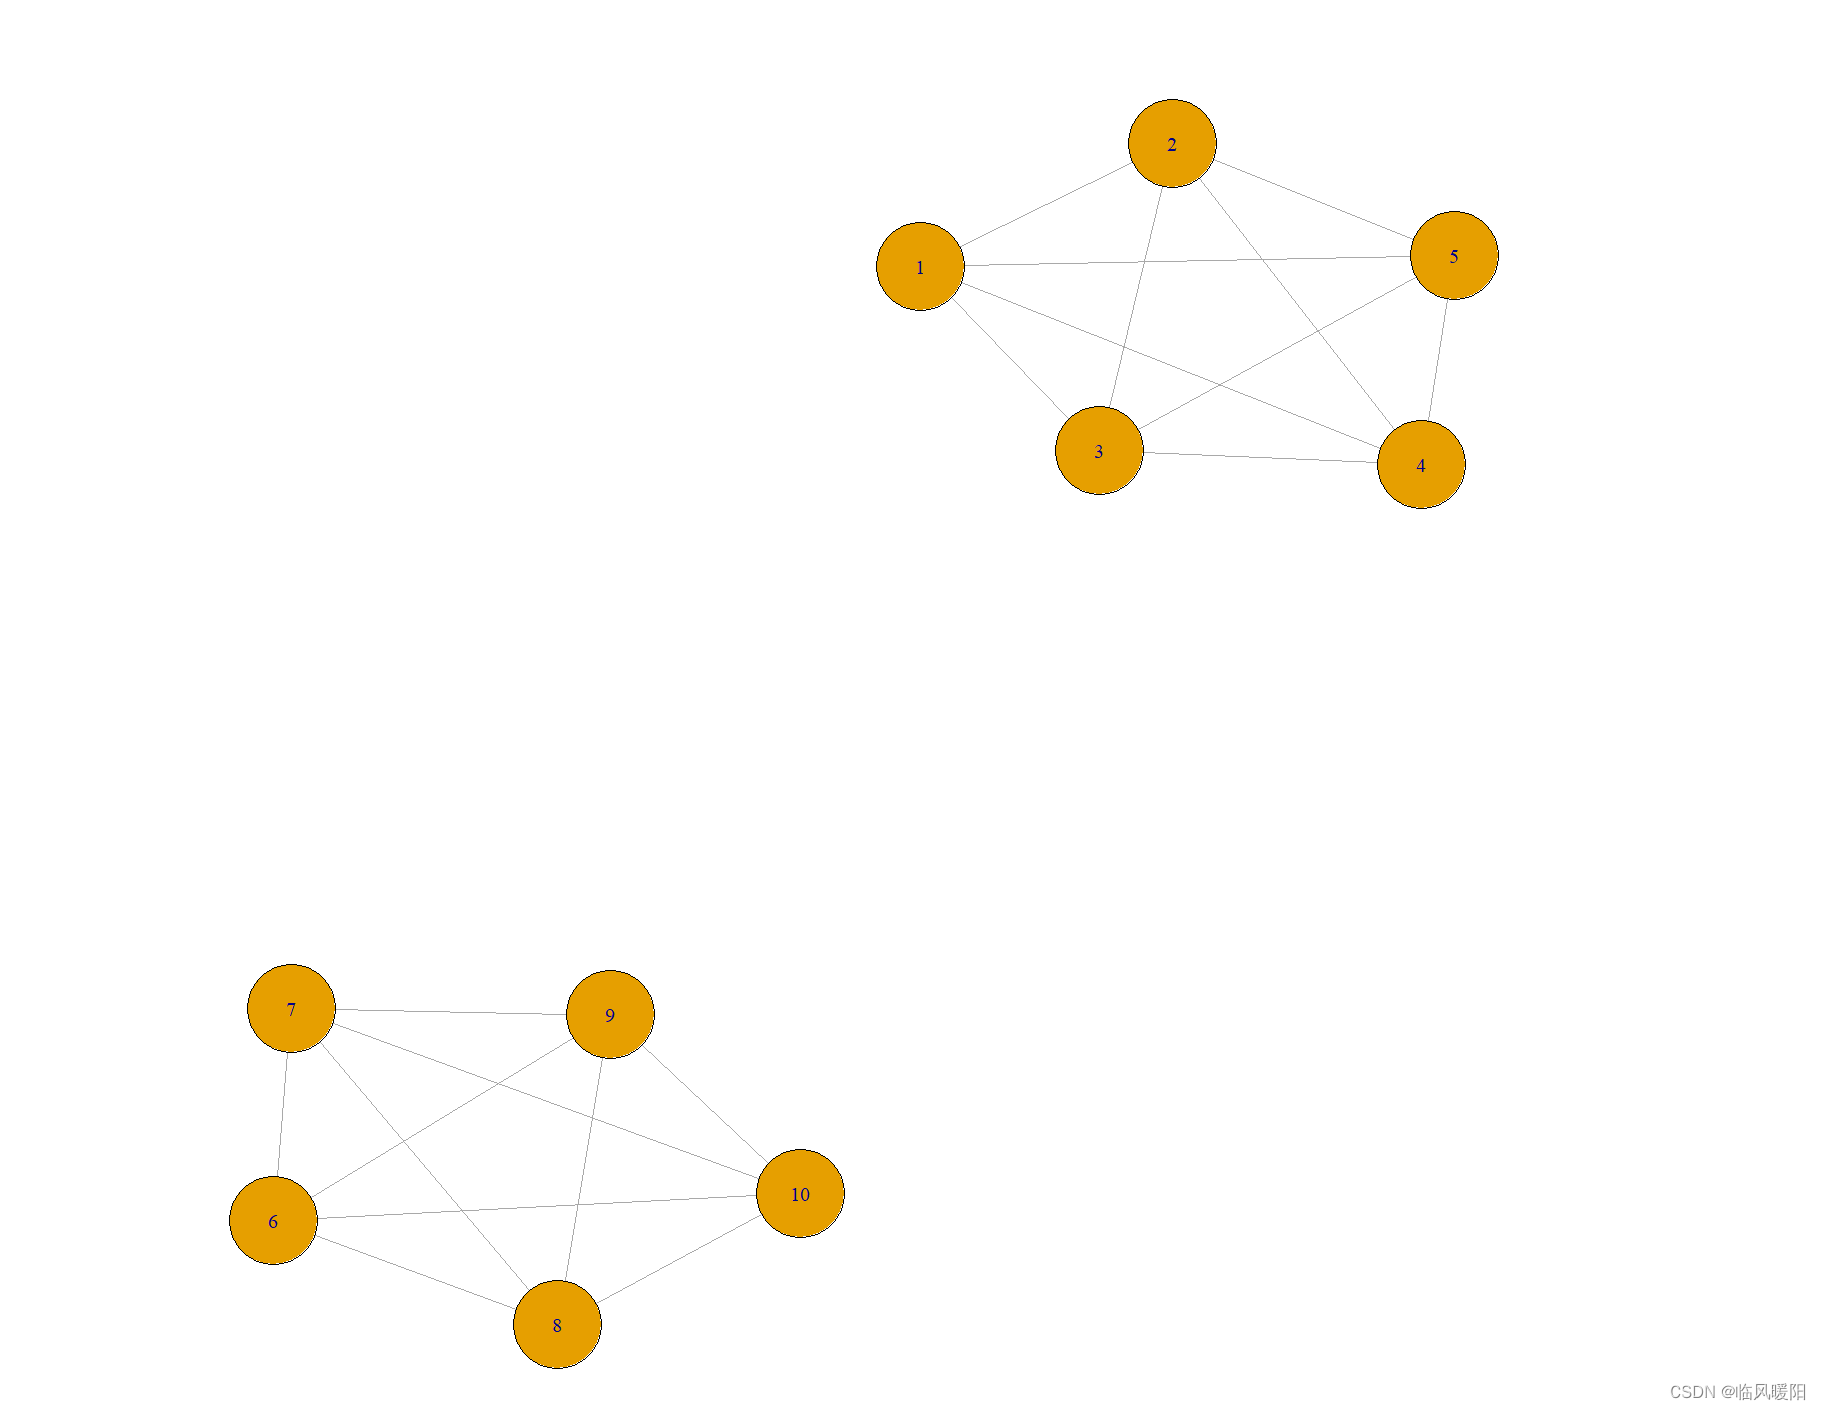
g <- disjoint_union(make_full_graph(5), make_full_graph(5))
plot(g)
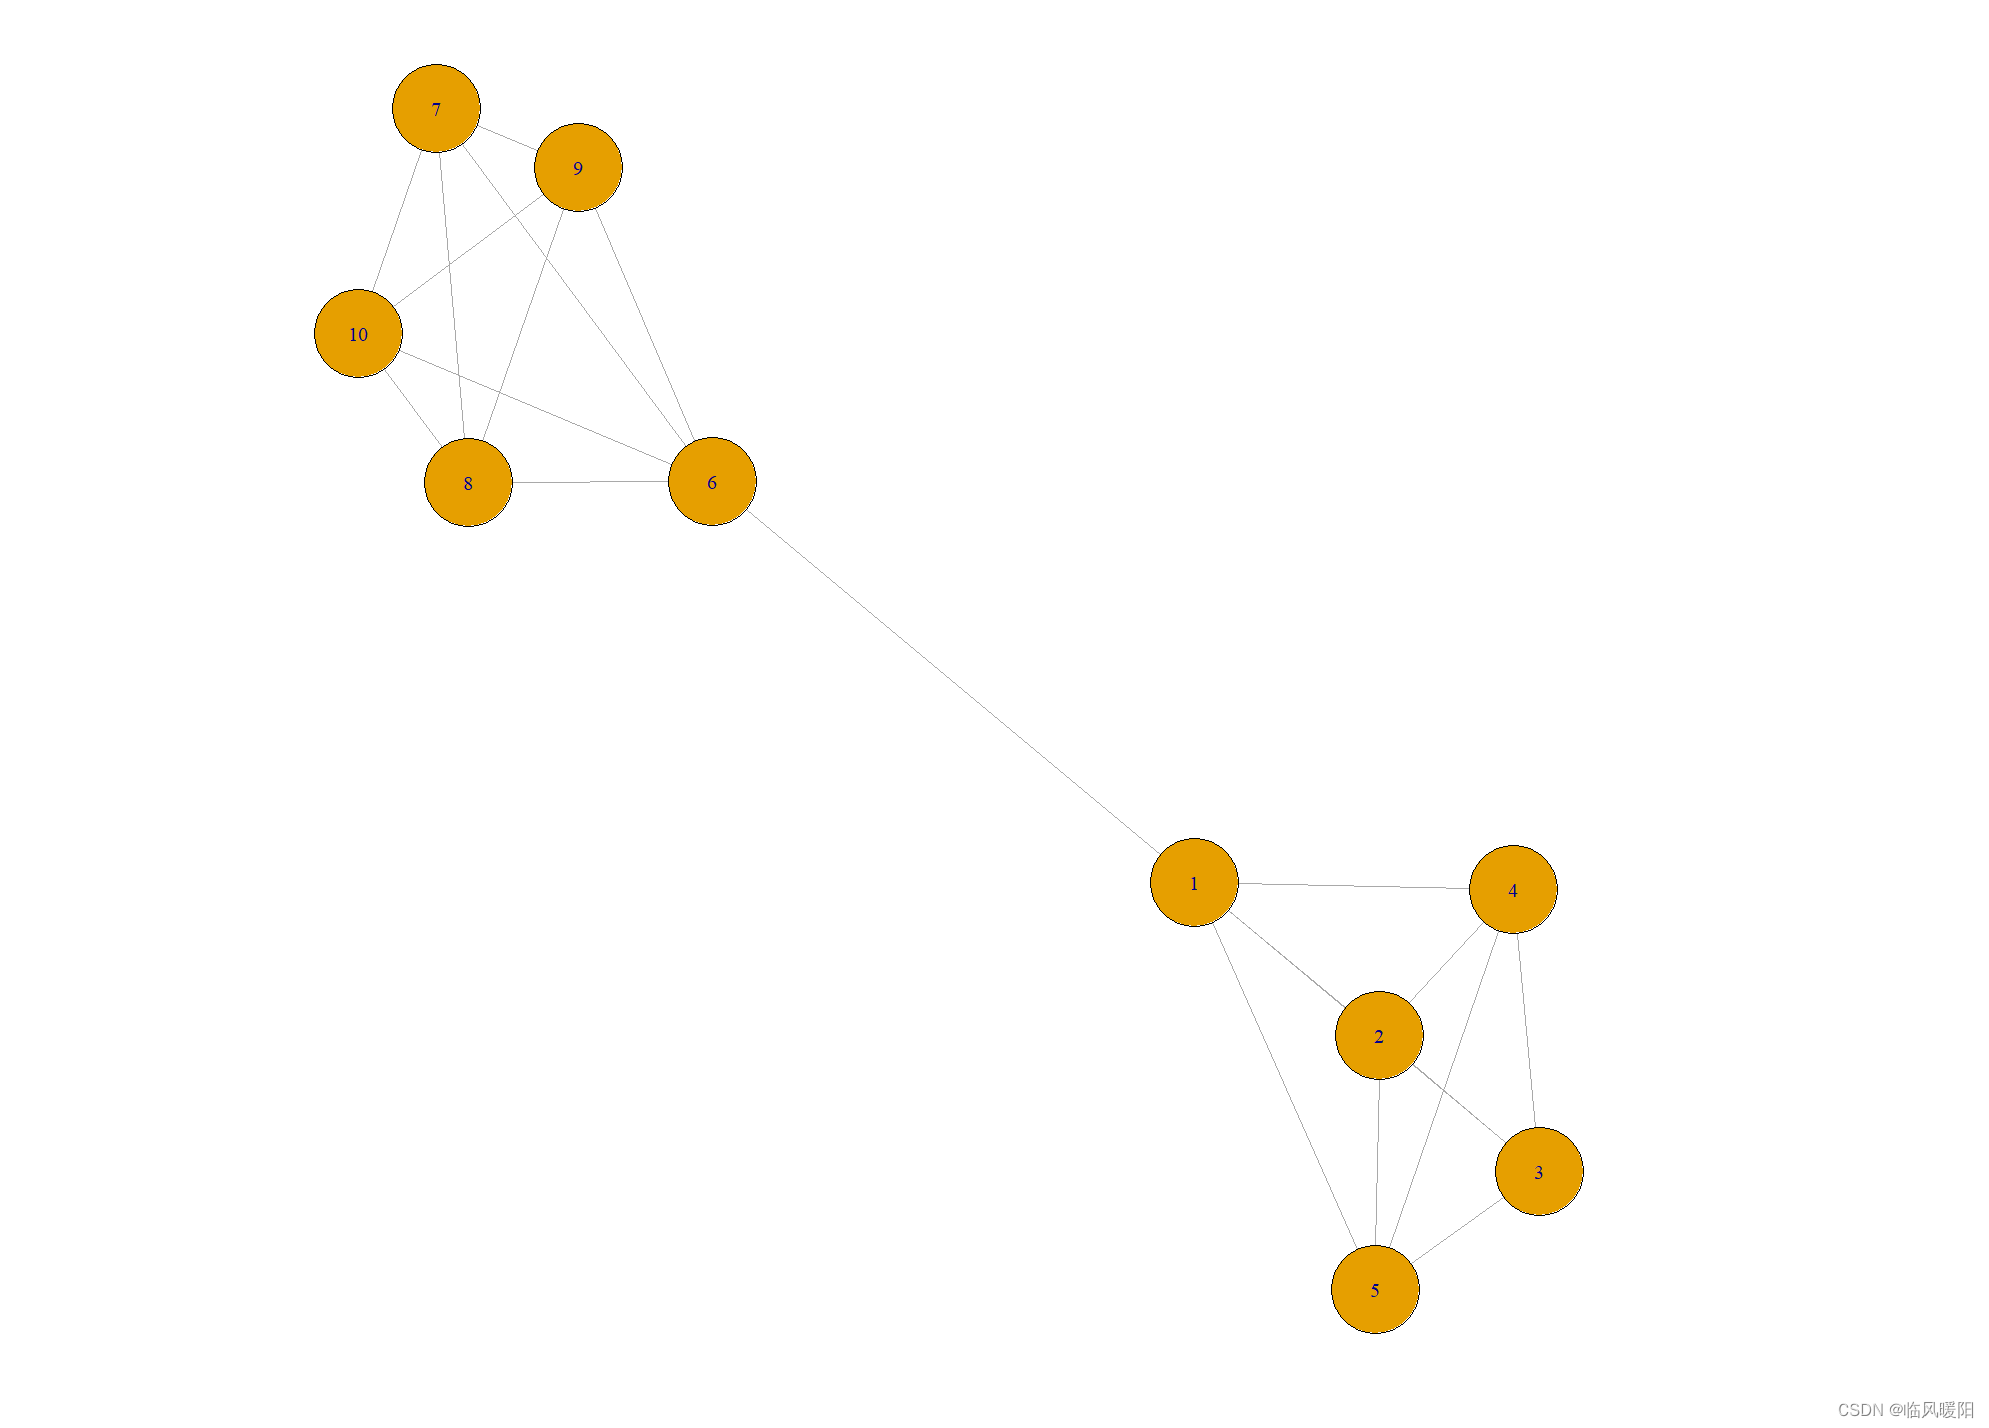
clu <- components(g)$membership
g <- add_edges(g, c(match(1, clu), match(2, clu)))
plot(g)
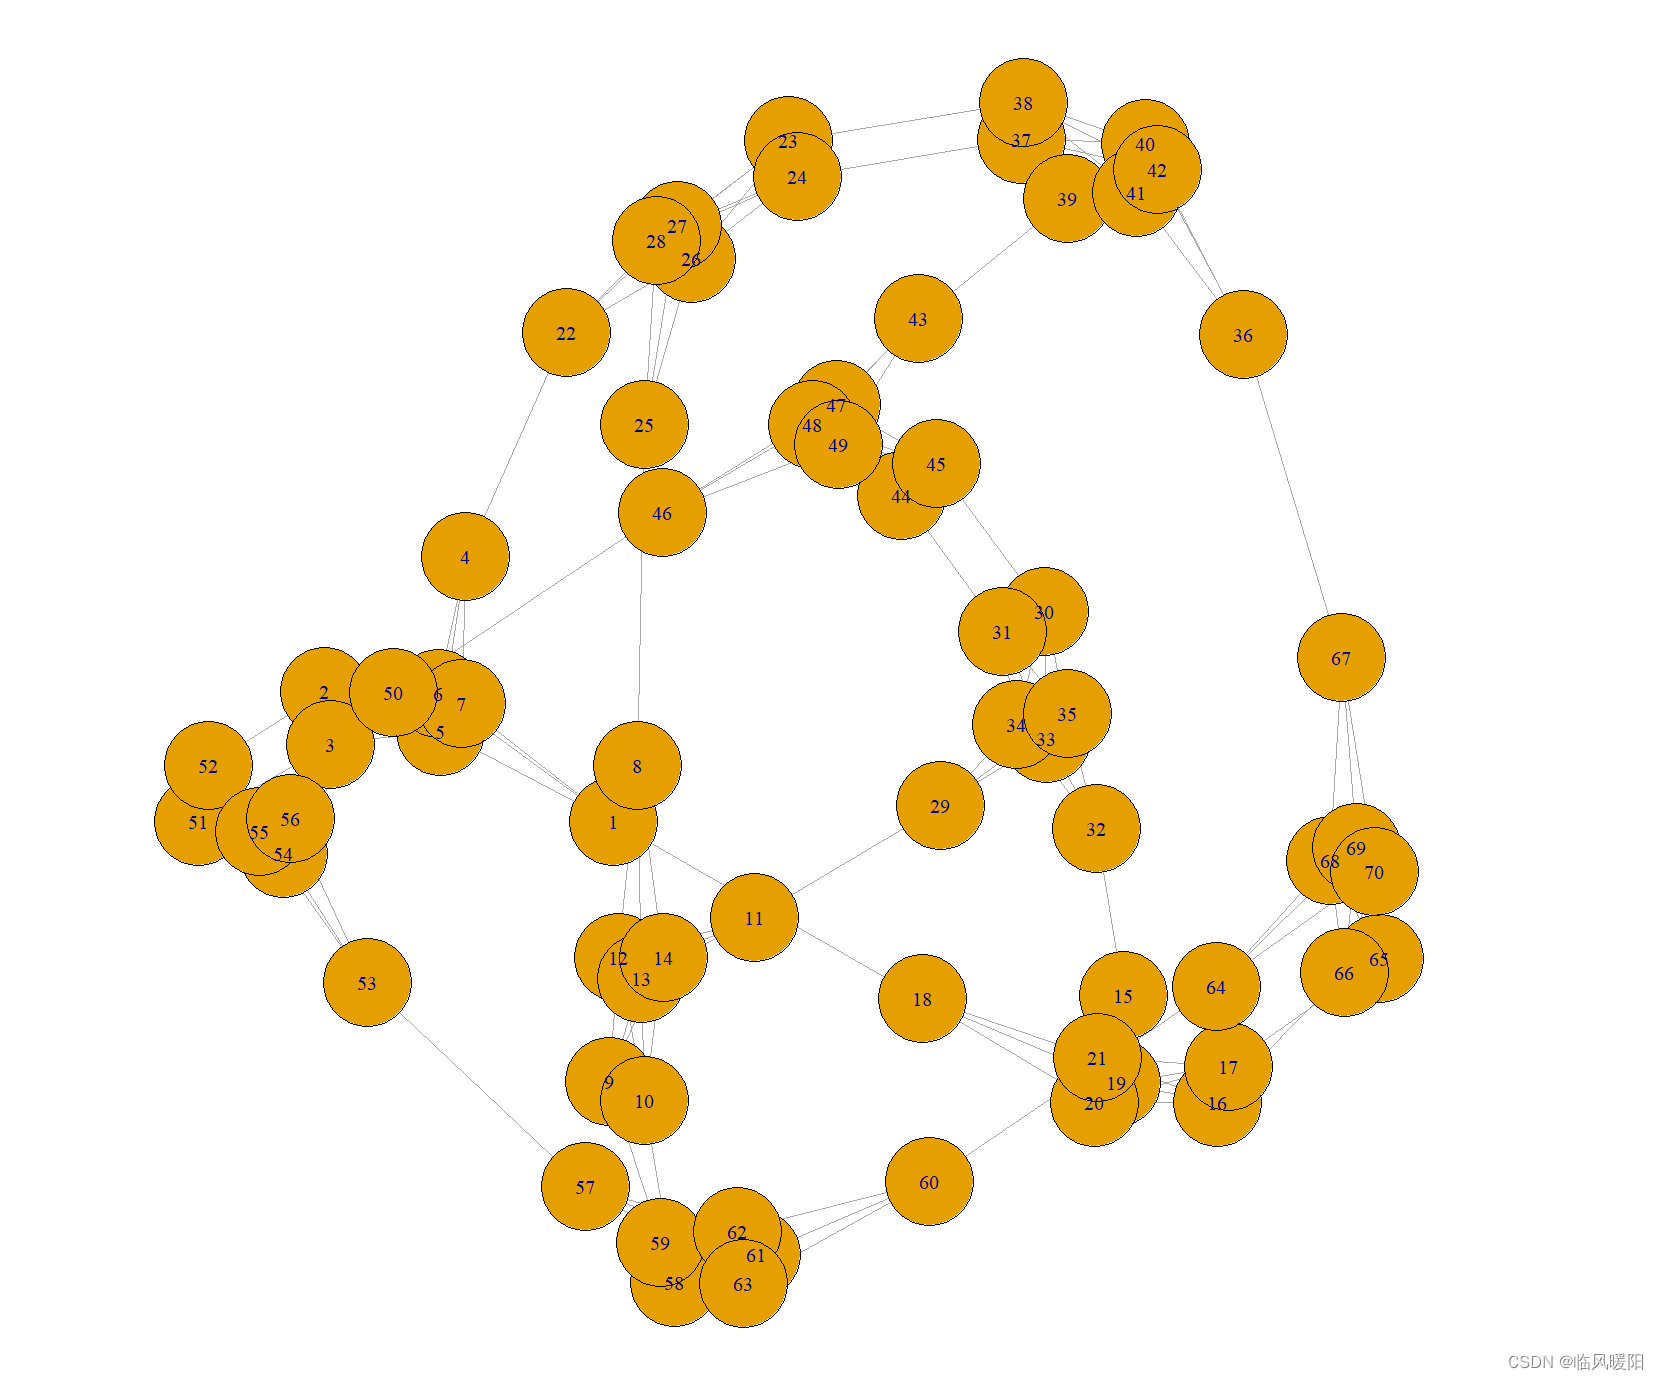
library(igraph)
g <- disjoint_union(make_full_graph(5), make_full_graph(5))
clu <- components(g)$membership
g <- add_edges(g, c(match(1, clu), match(2, clu)))
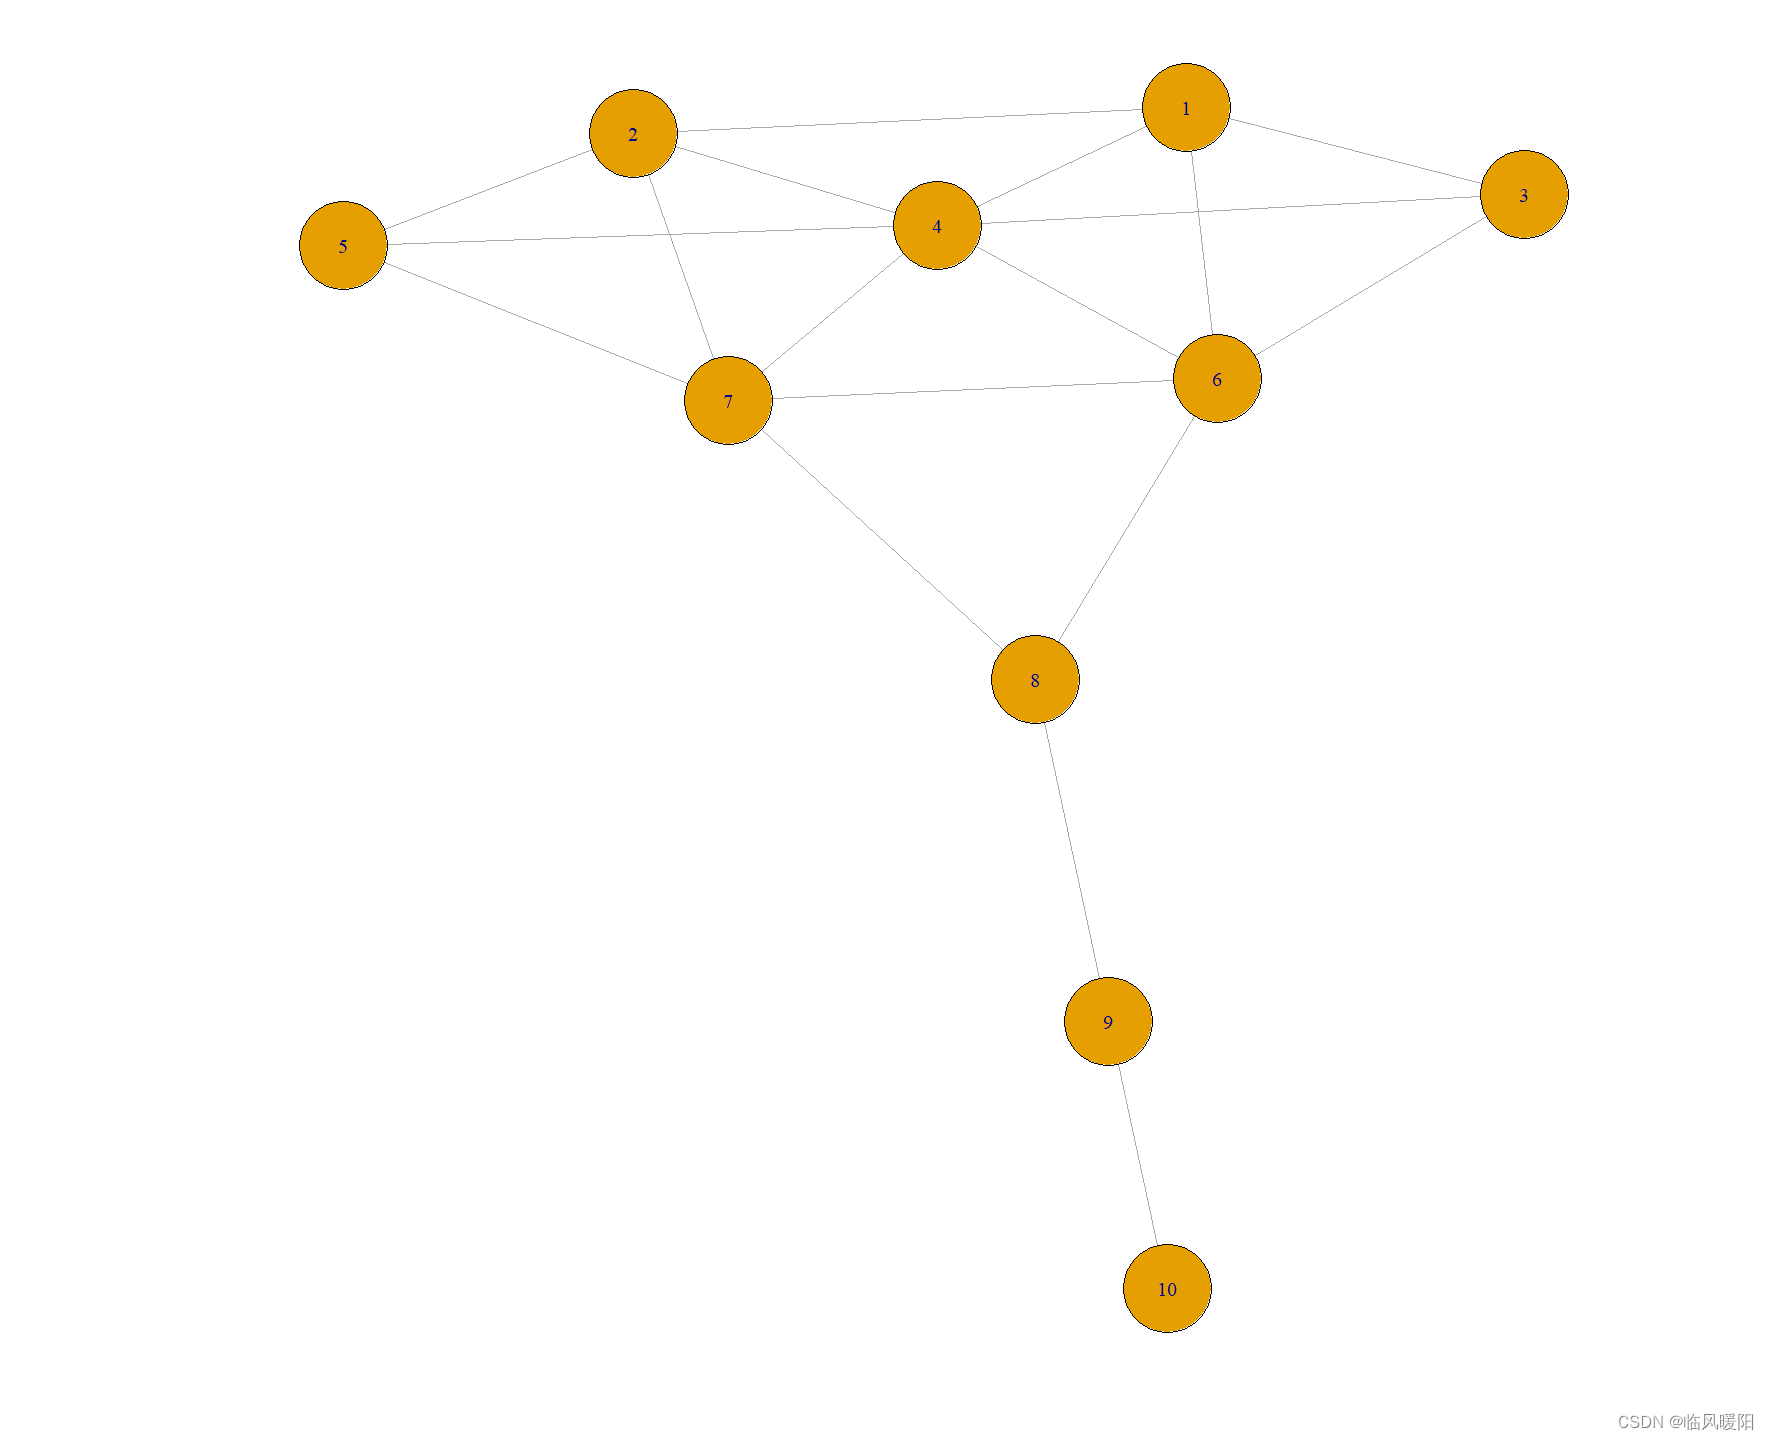
articulation_points(g)
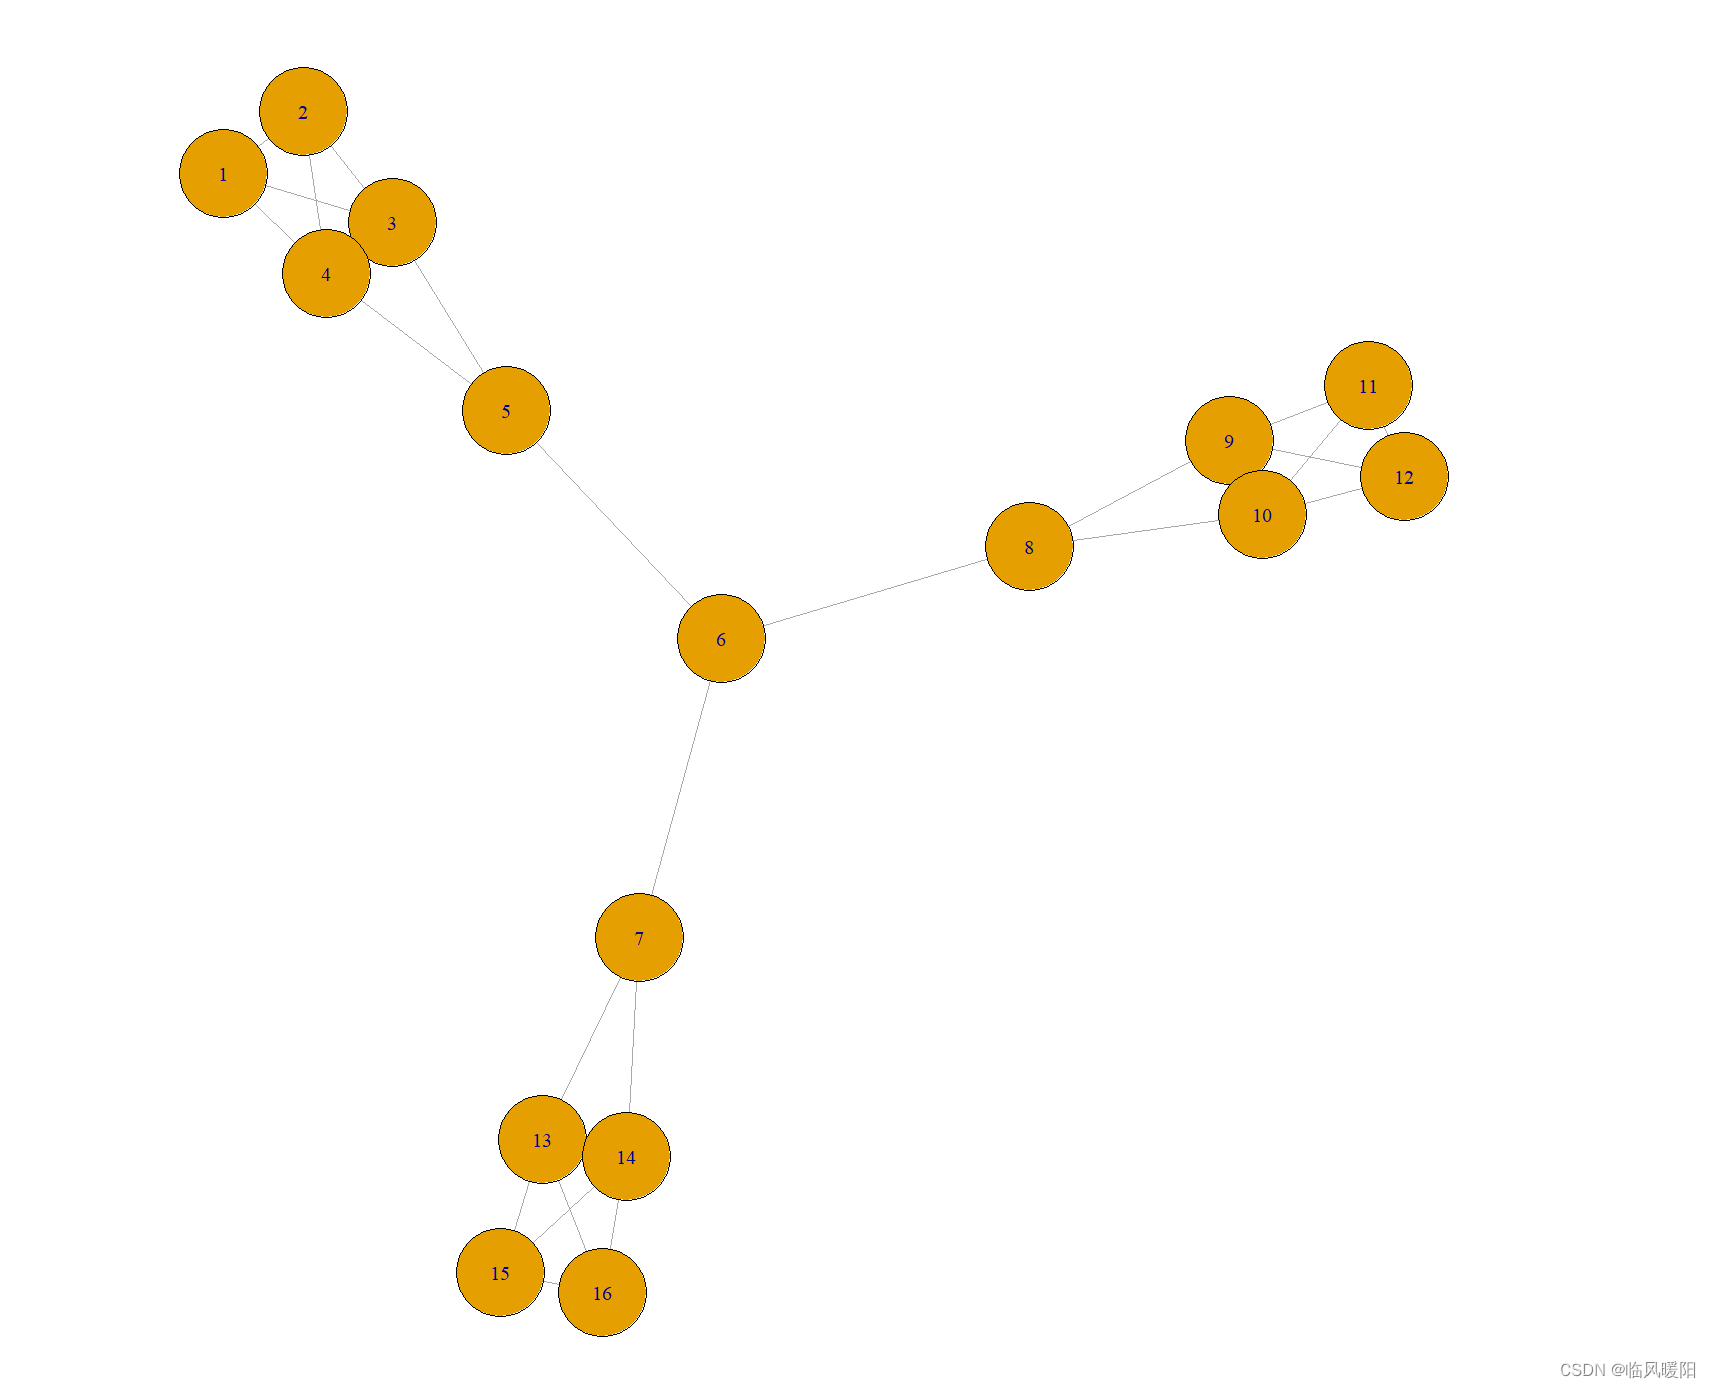
g <- make_graph("krackhardt_kite")
bridges(g)
plot(g)
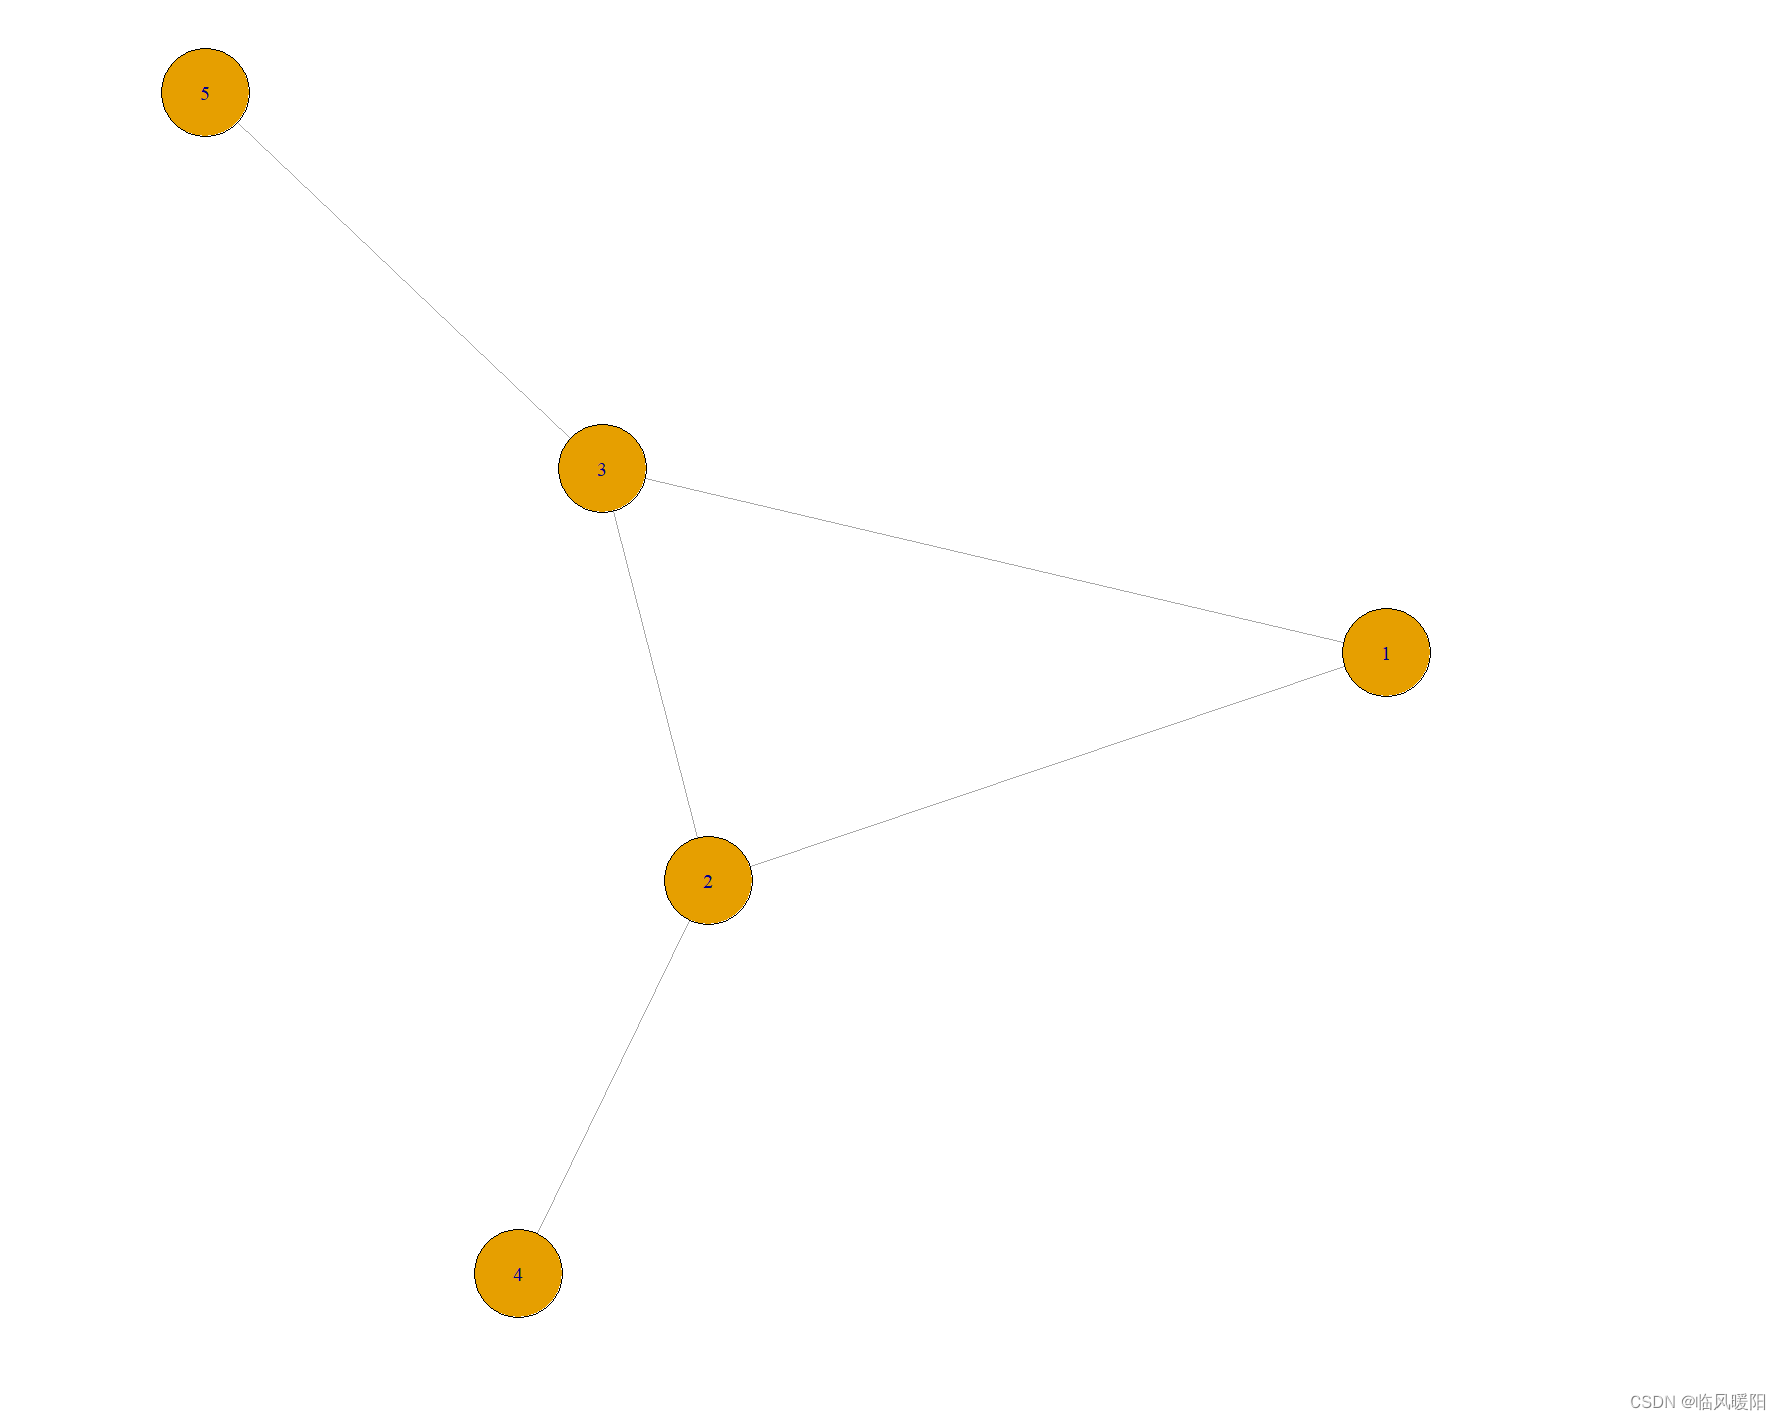
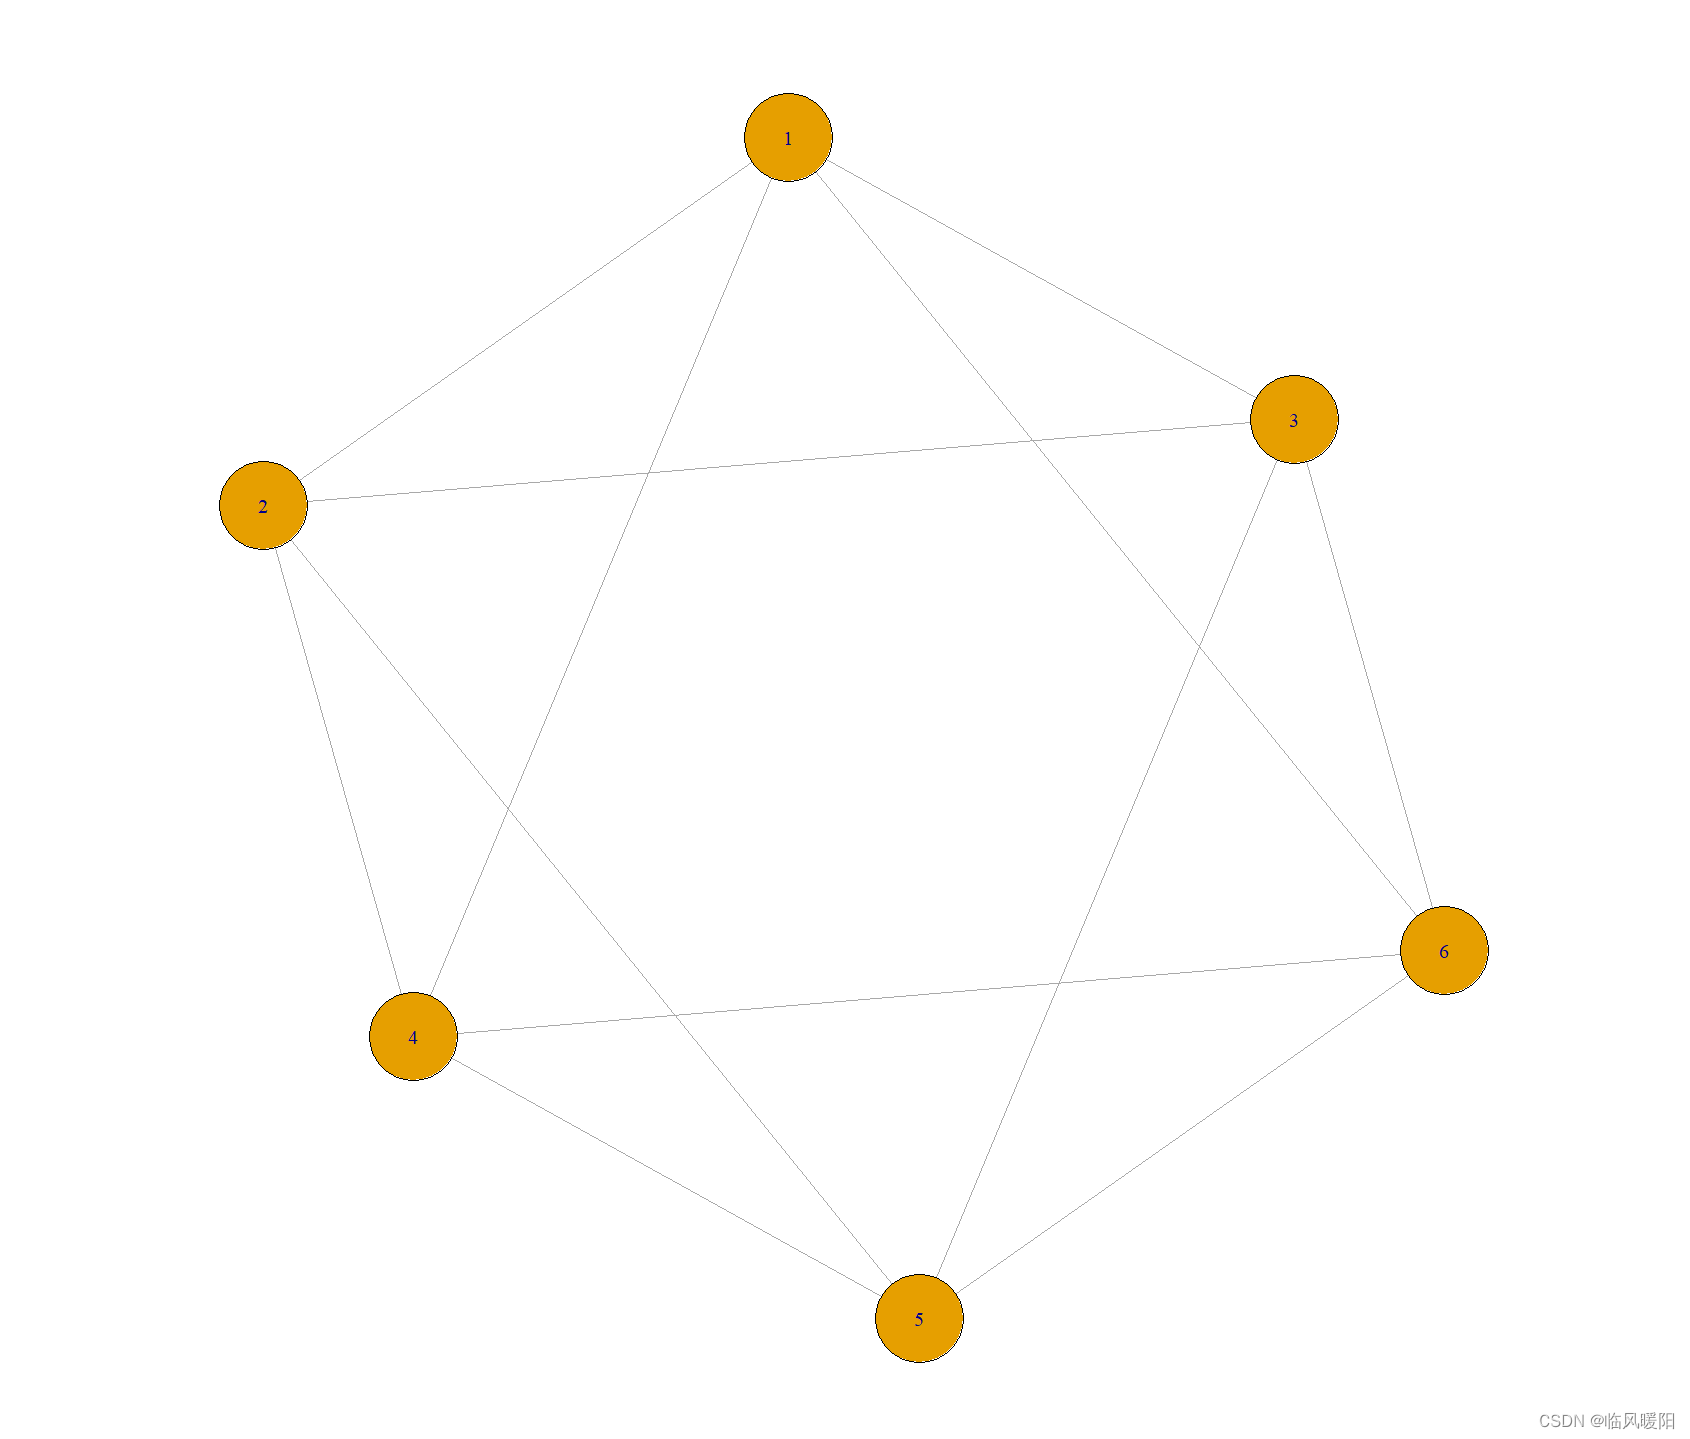
g <- make_graph("Bull")
bridges(g)
plot(g)
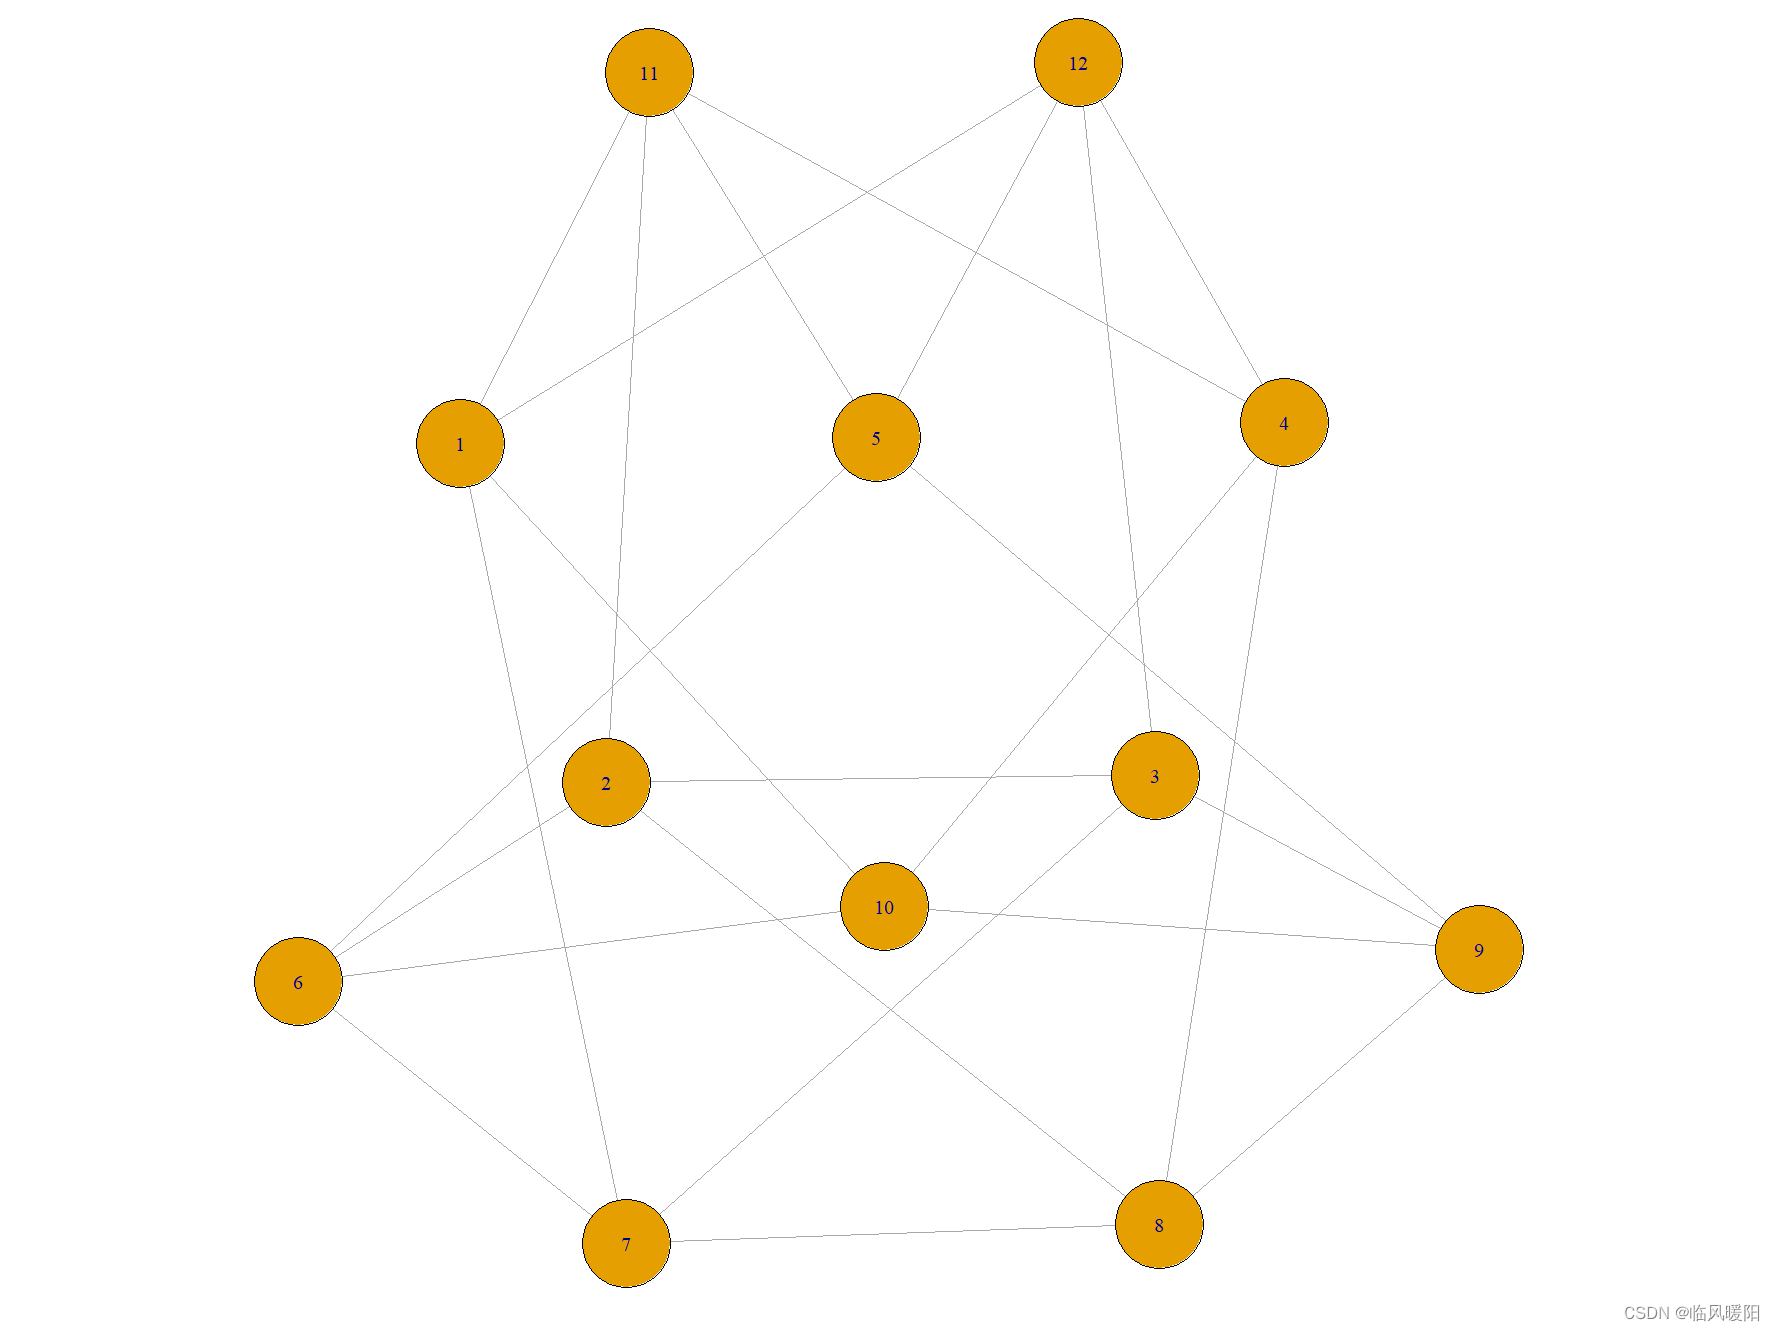
library(igraph)
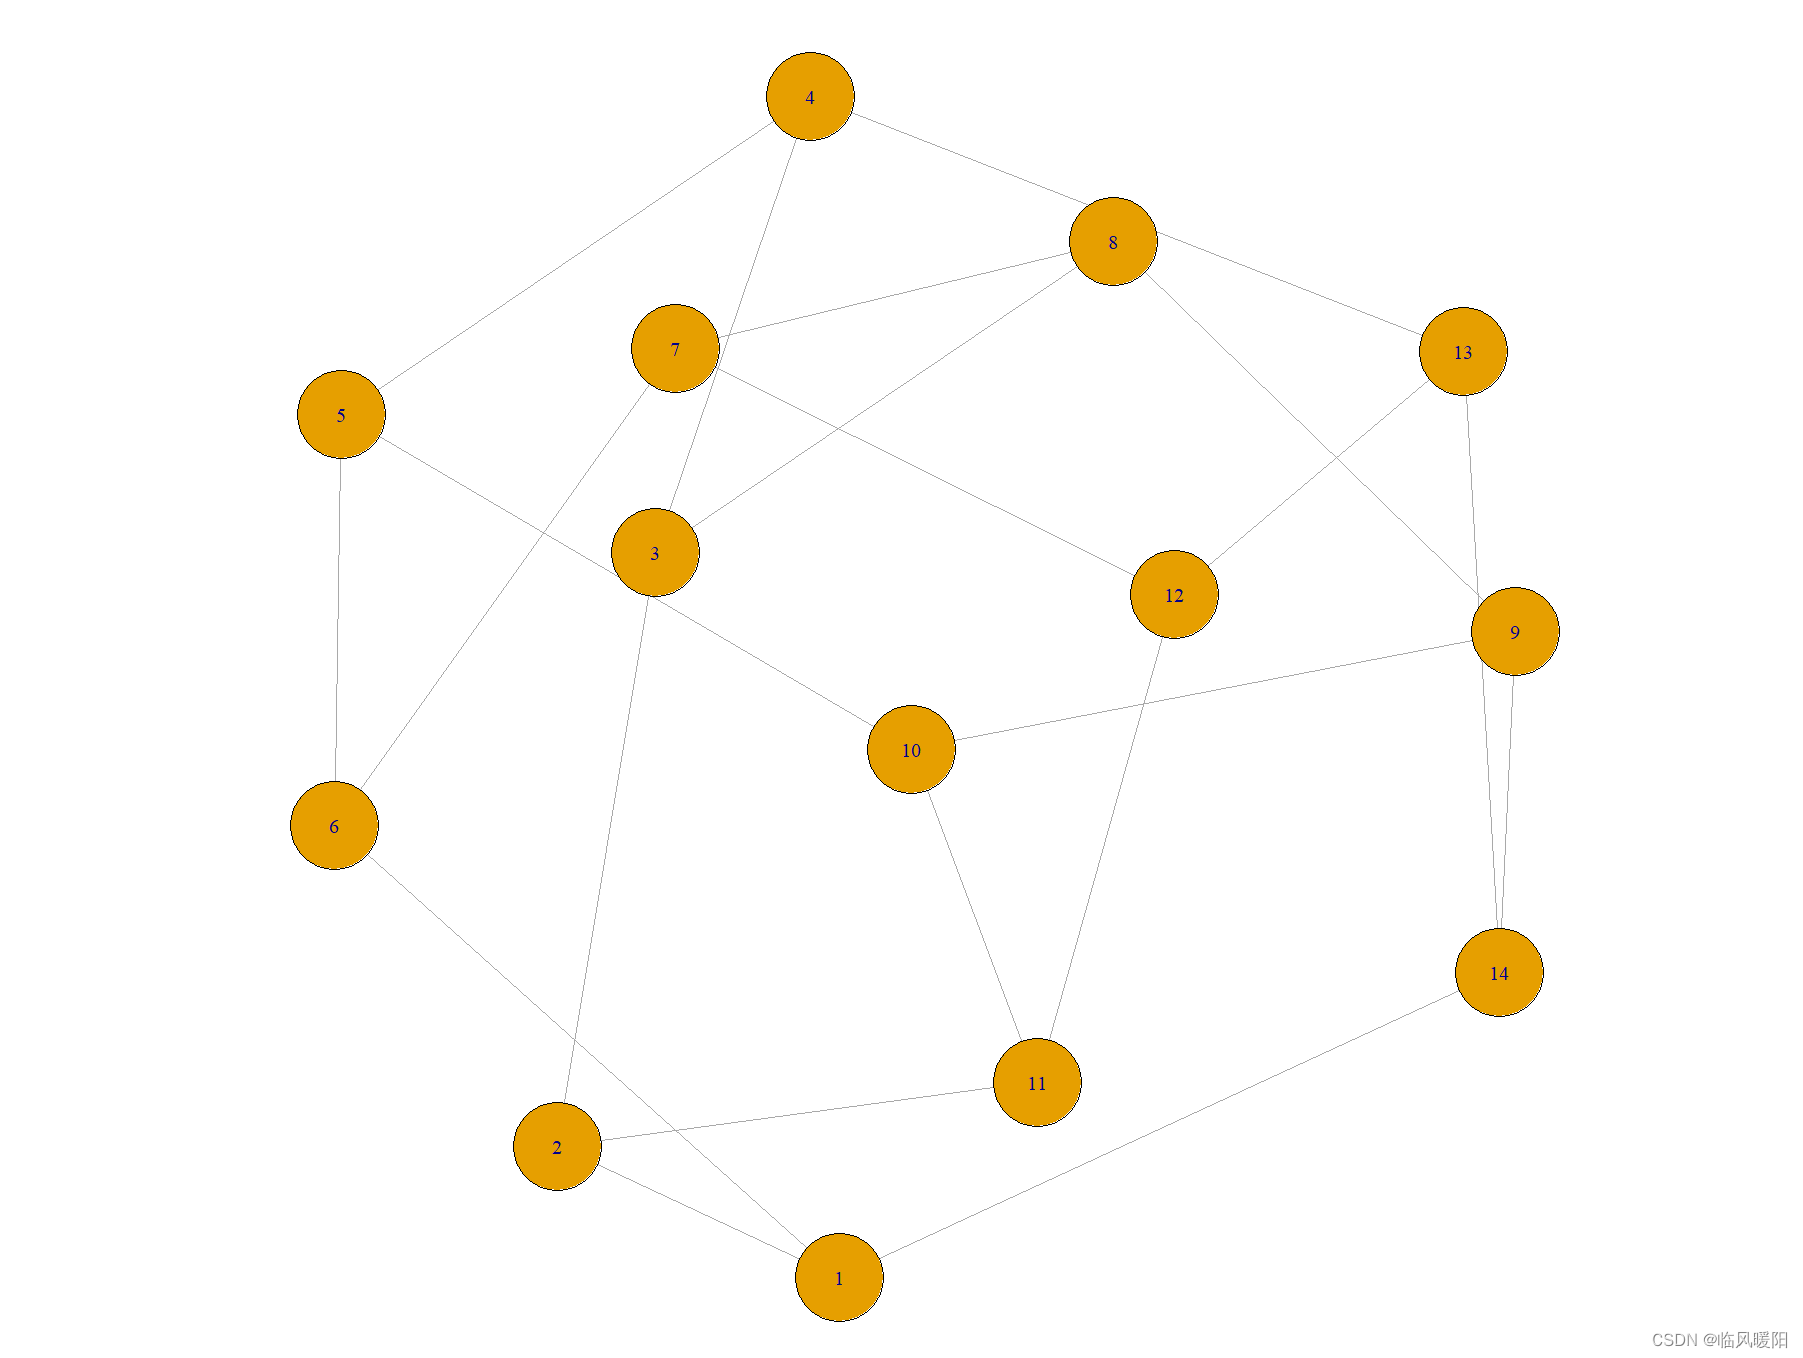
g <- make_graph("Chvatal")
bridges(g)
plot(g)
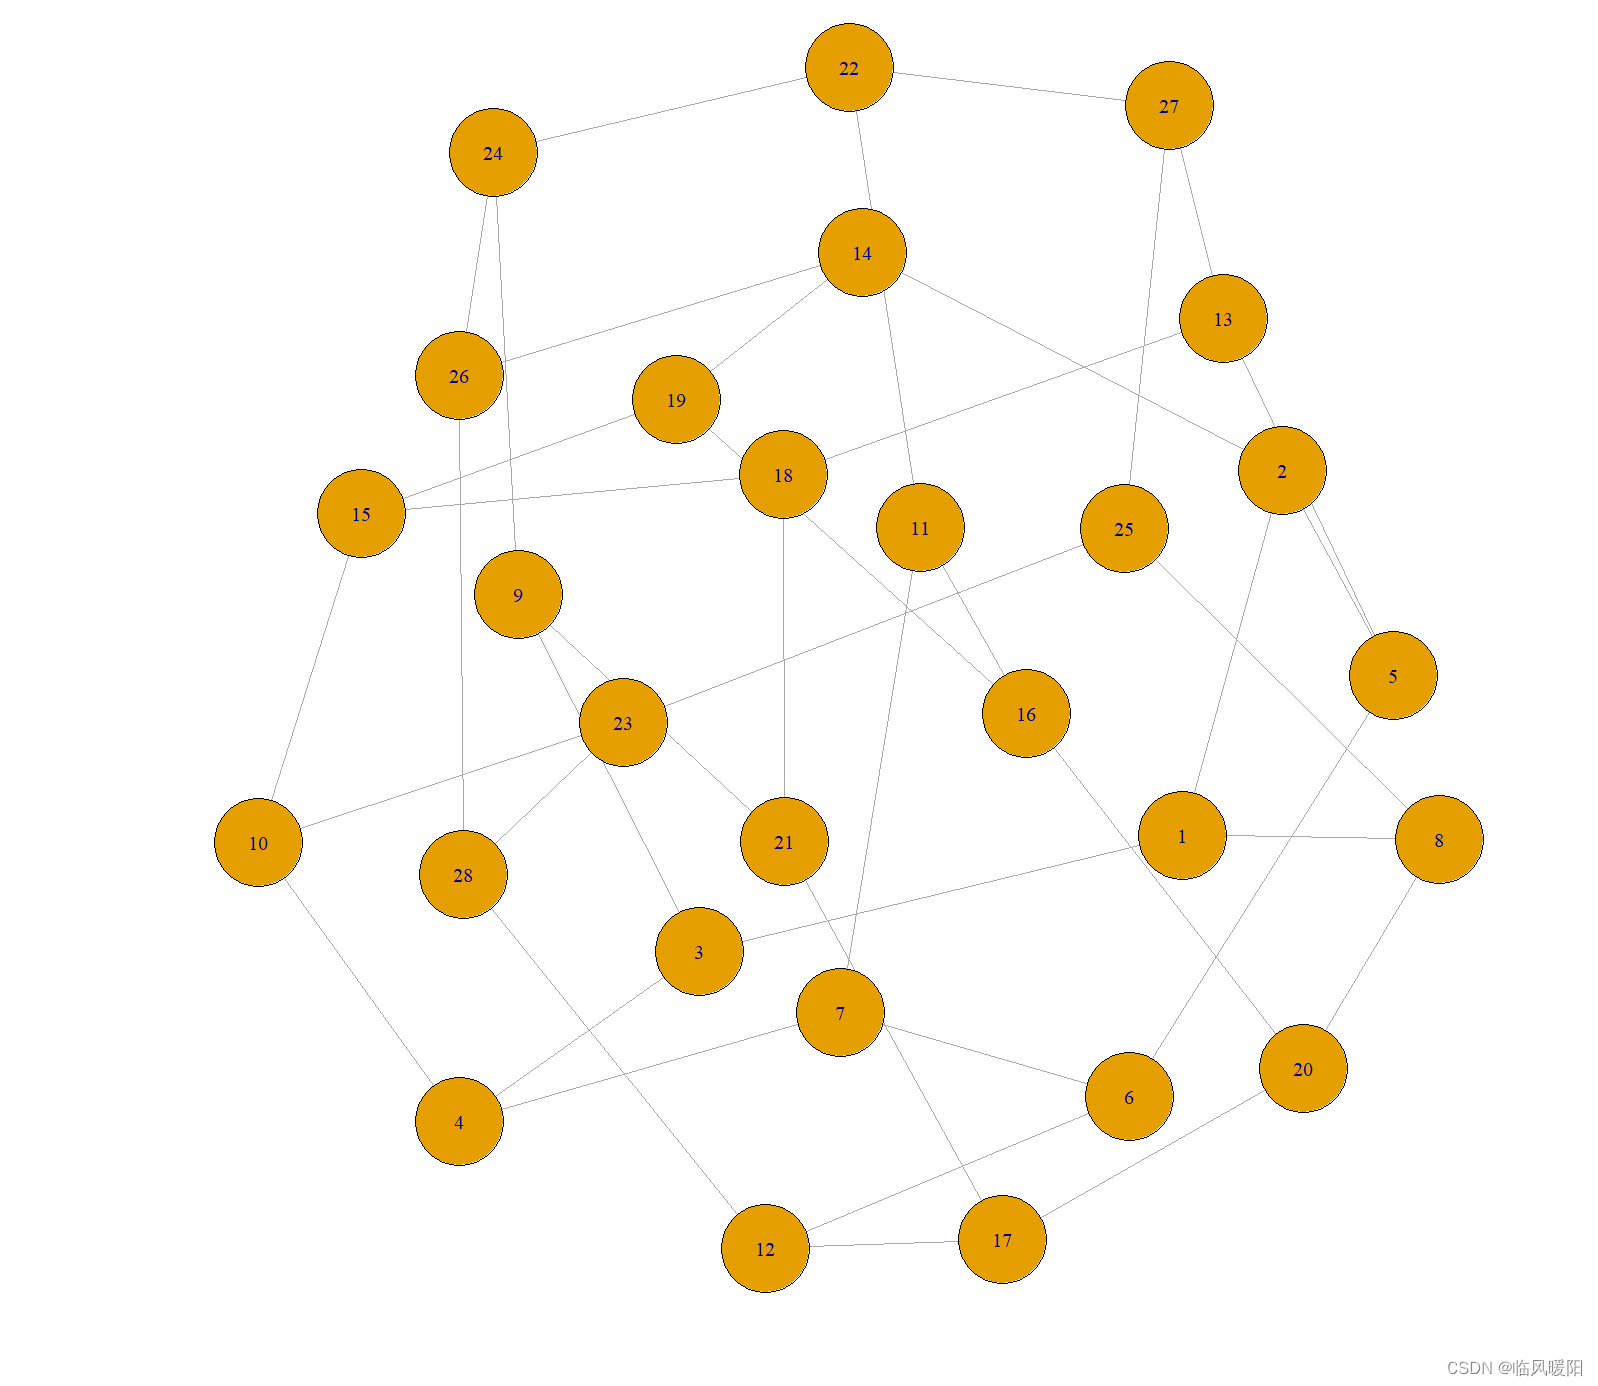
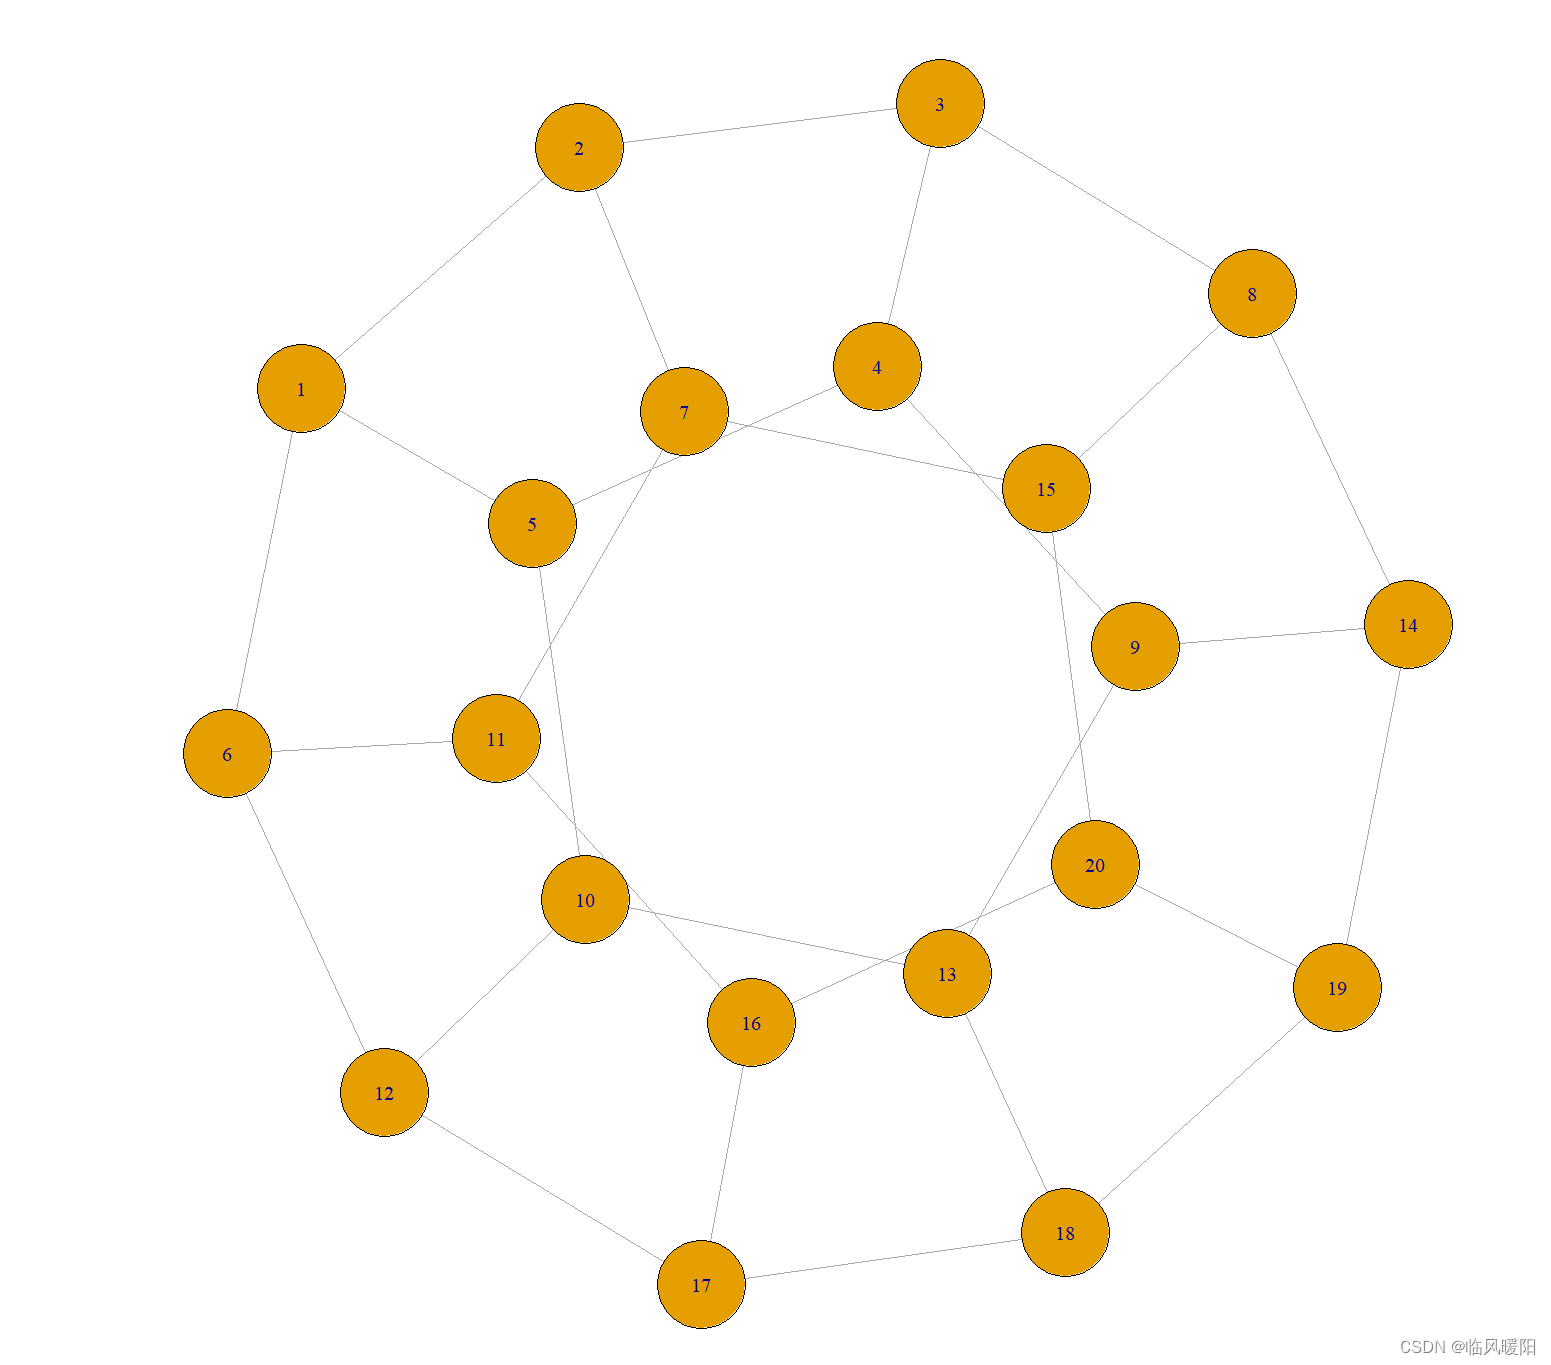
library(igraph)
g <- make_graph("Coxeter")
bridges(g)
plot(g)
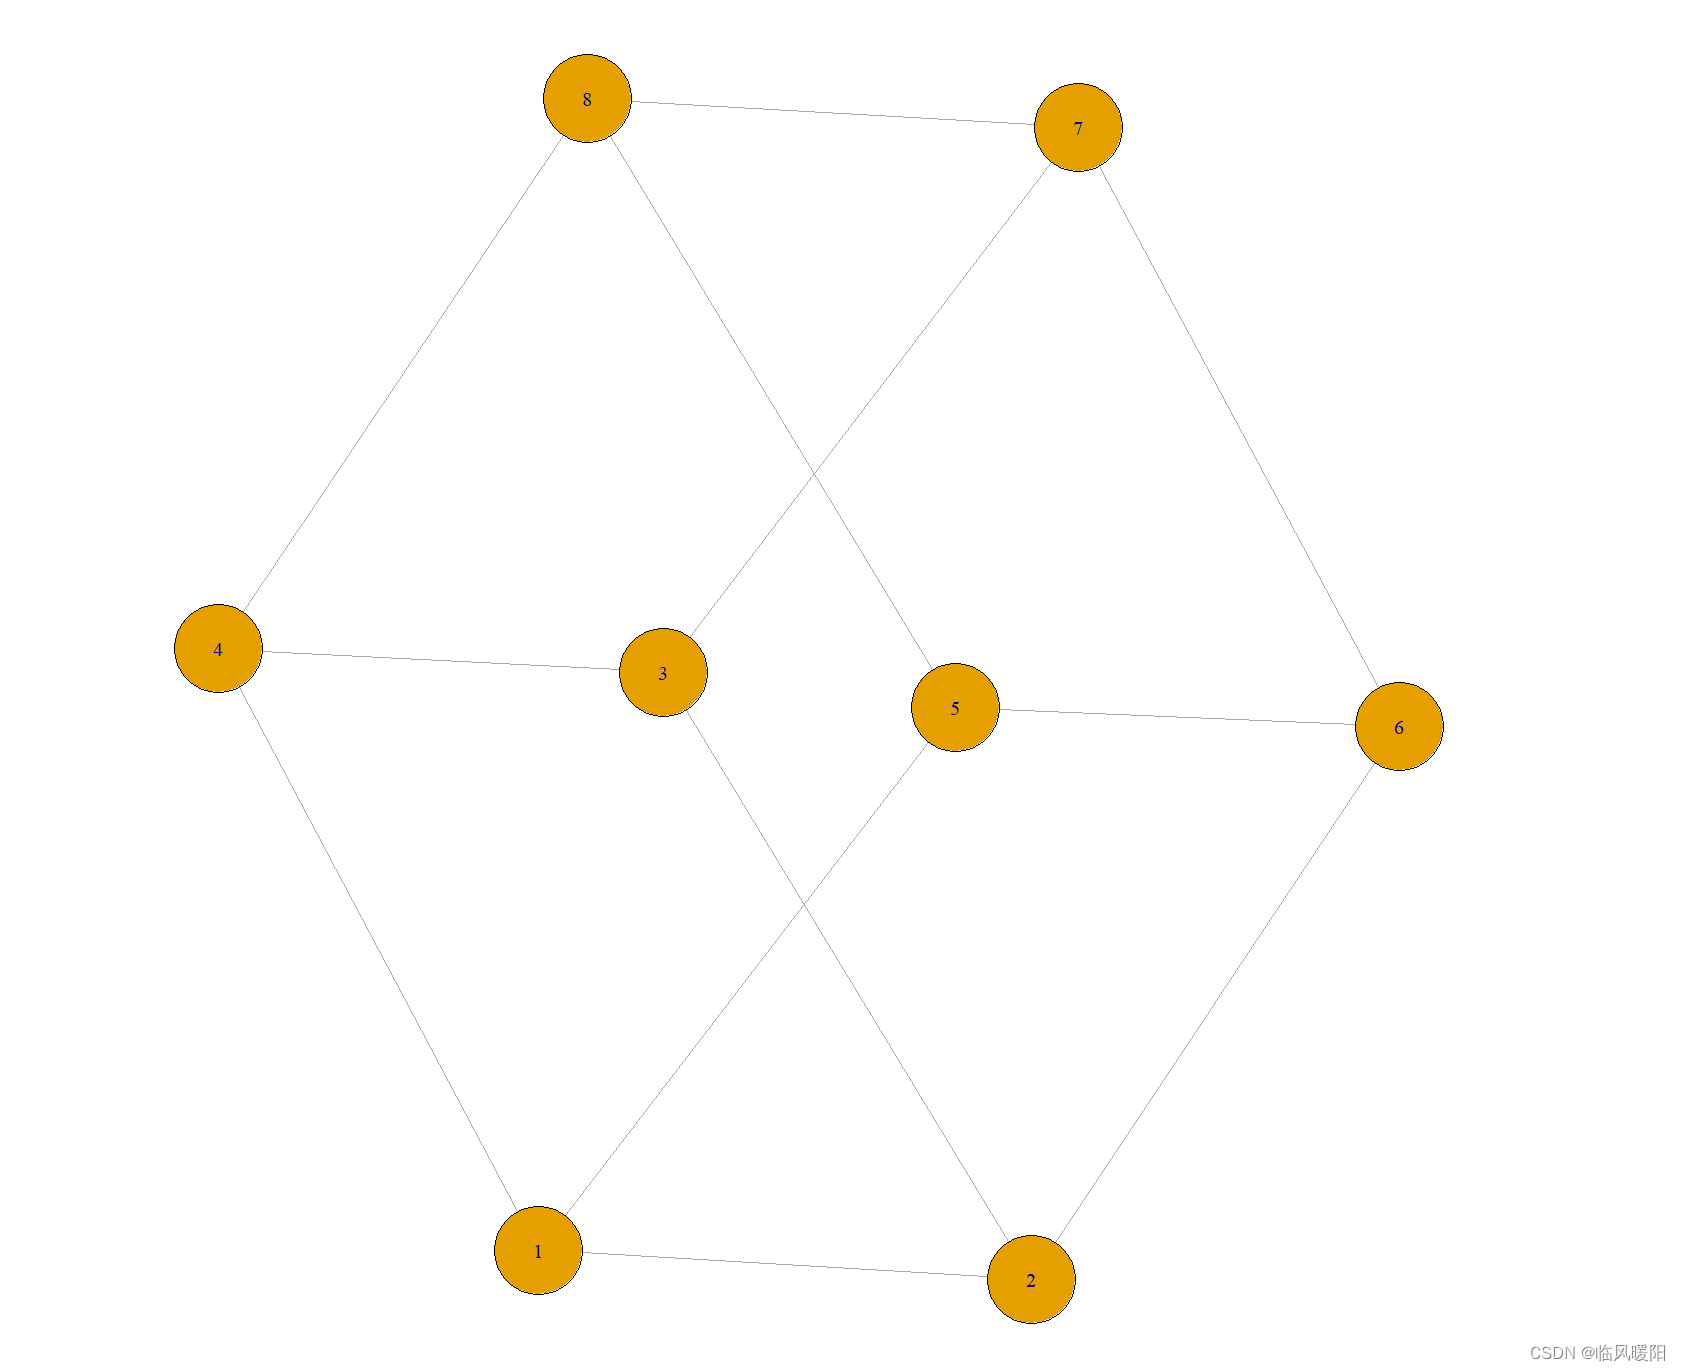
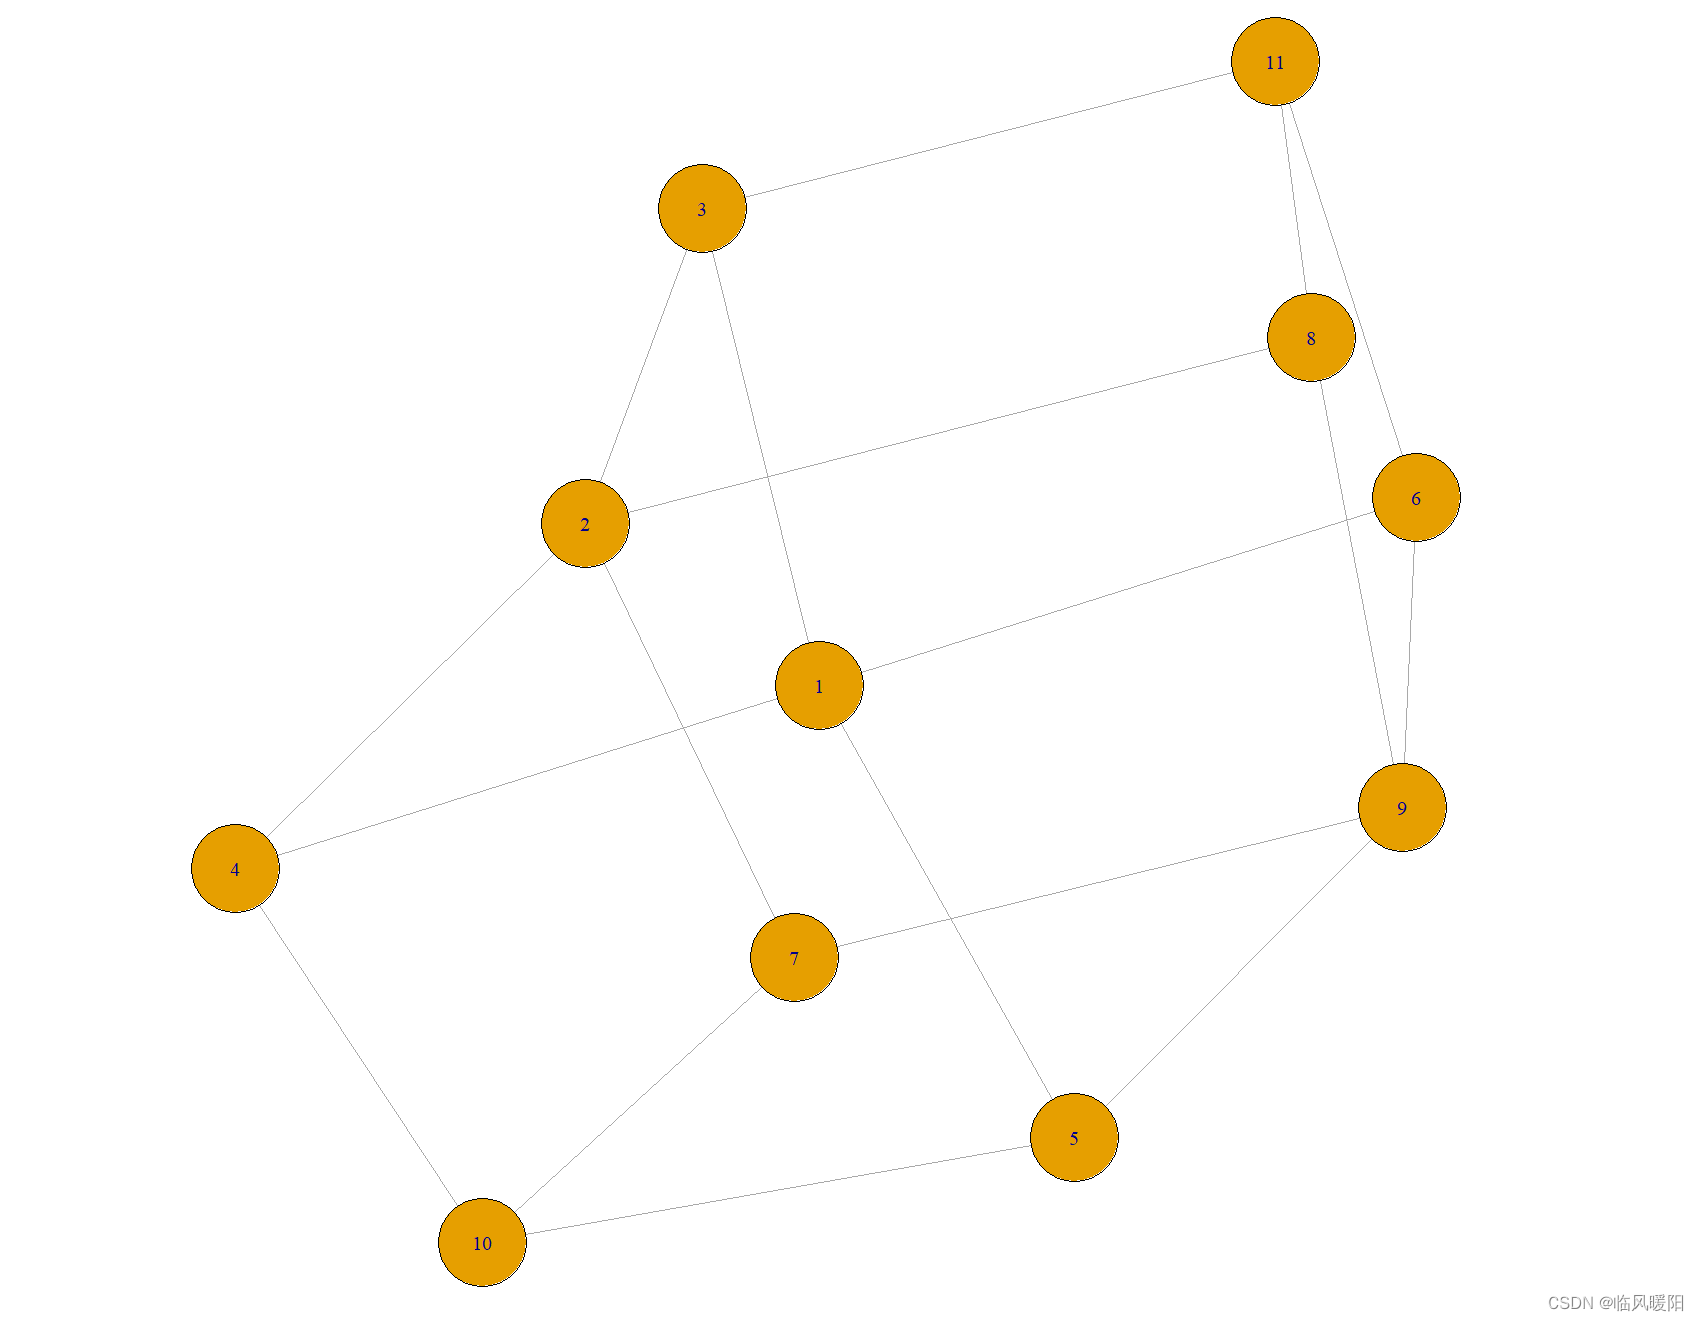
library(igraph)
g <- make_graph("Cubical")
bridges(g)
plot(g)
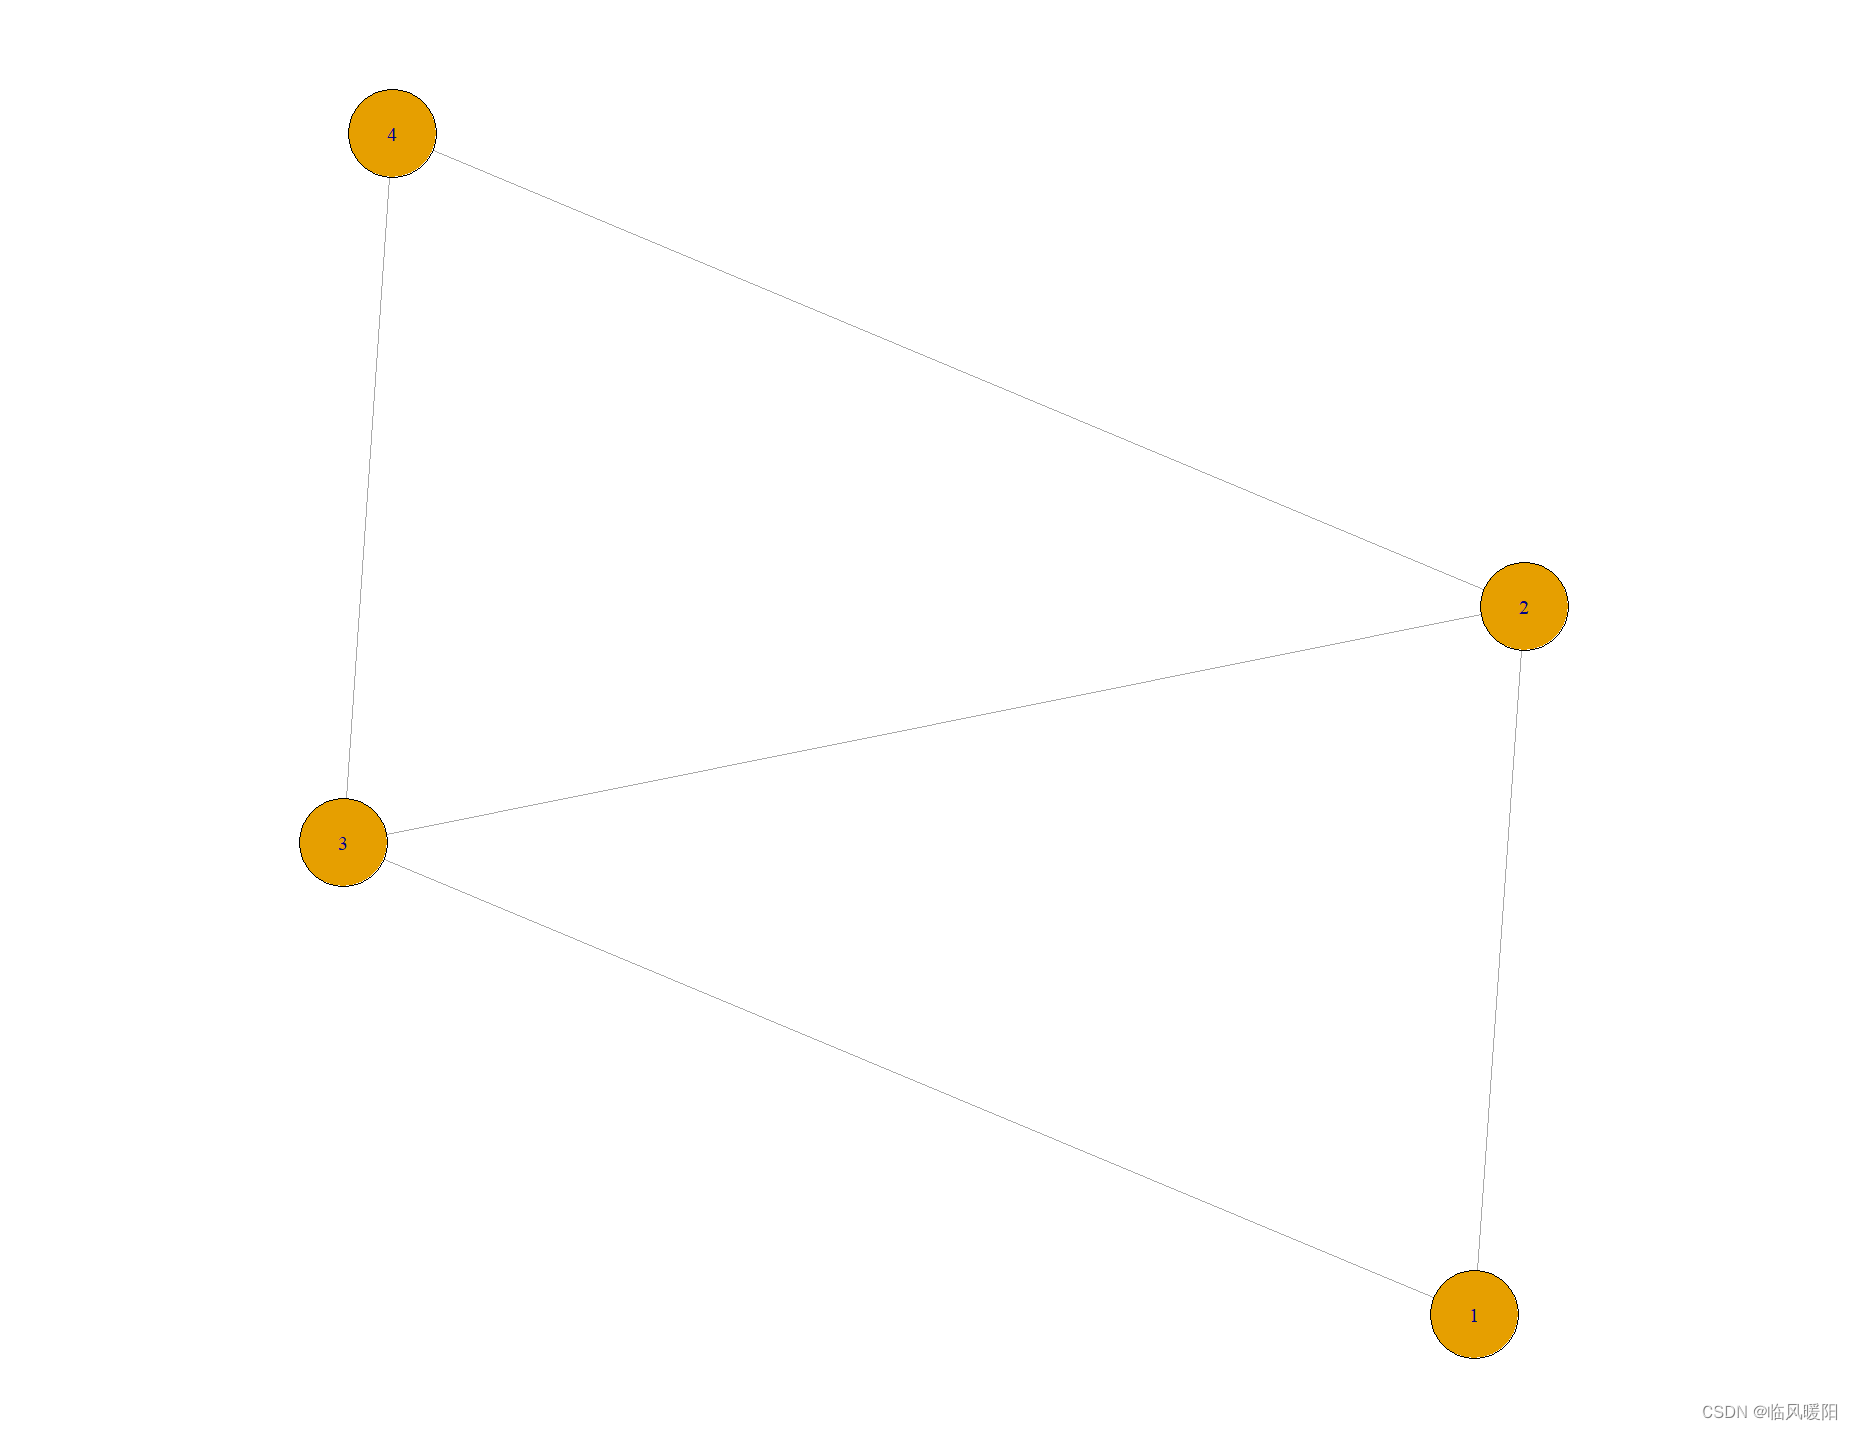
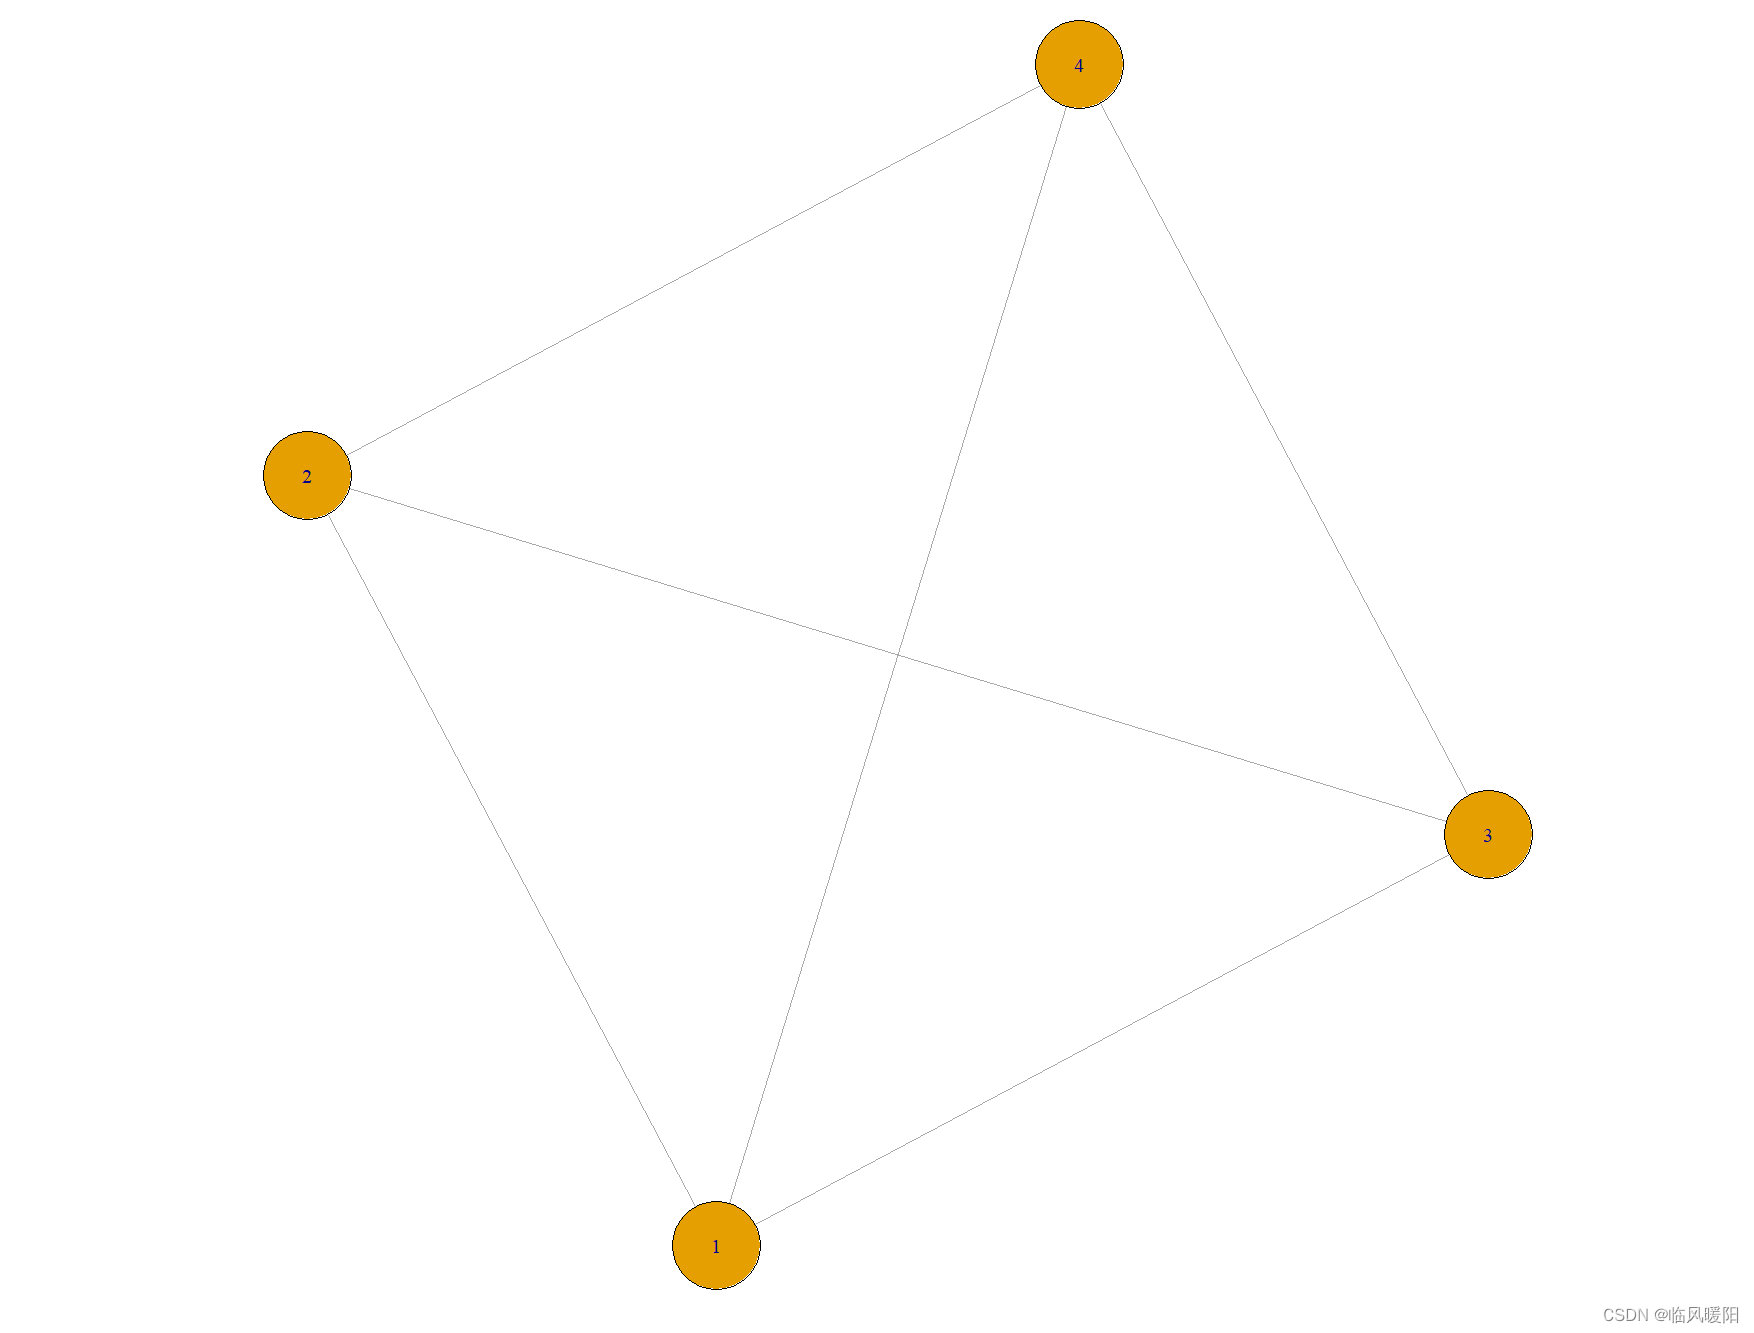
g <- make_graph("Diamond")
g <- make_graph("Dodecahedral")
g <- make_graph("Dodecahedron")
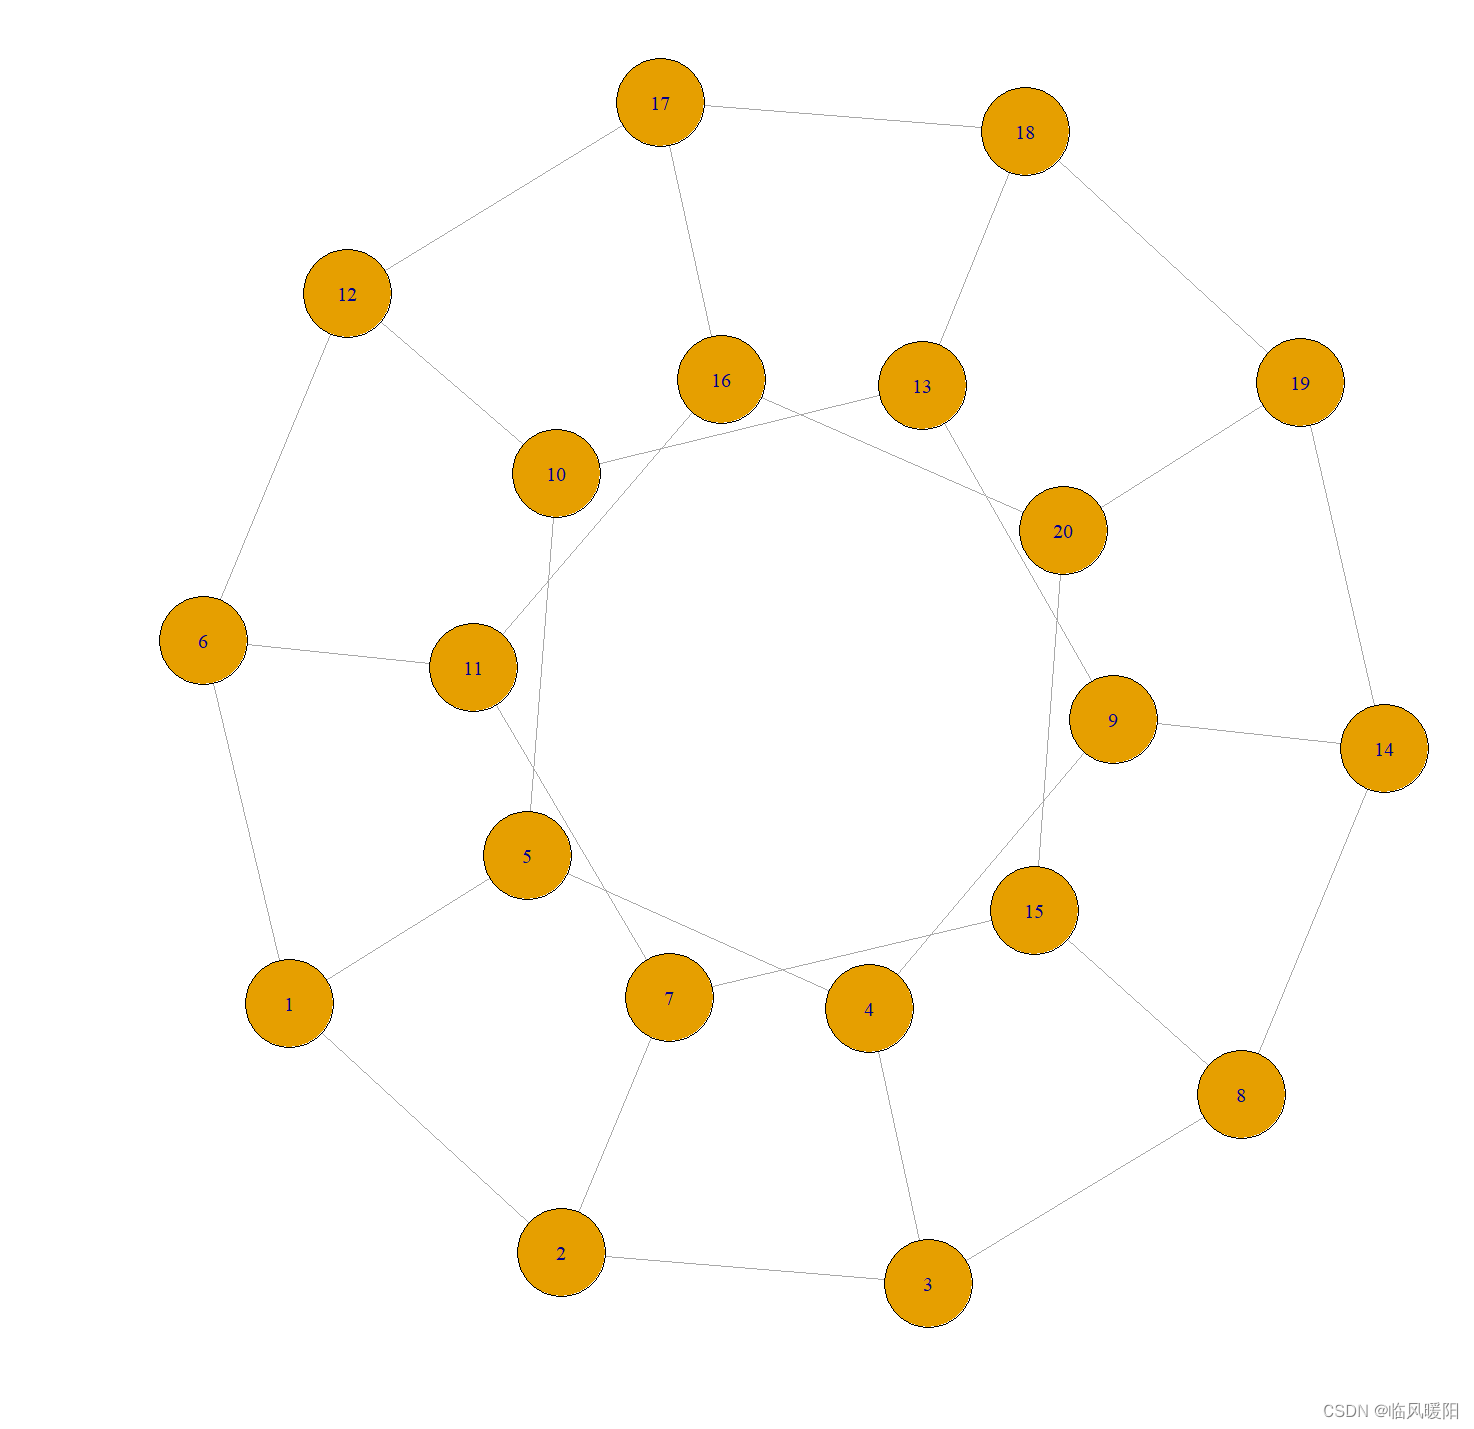
g <- make_graph("Folkman")
g <- make_graph("Franklin")
g <- make_graph("Frucht")
g <- make_graph("Grotzsch")
g <- make_graph("Heawood")
g <- make_graph("Herschel")
g <- make_graph("House")
g <- make_graph("HouseX")
g <- make_graph("Icosahedral")
g <- make_graph("Icosahedron")
g <- make_graph("Levi")
g <- make_graph("McGee")
g <- make_graph("Meredith")
g <- make_graph("Noperfectmatching")
g <- make_graph("Nonline")
g <- make_graph("Octahedral")
g <- make_graph("Octahedron")
g <- make_graph("Petersen")
g <- make_graph("Robertson")
g <- make_graph("Smallestcyclicgroup")
g <- make_graph("Zachary")

g <- make_graph("Walther")
g <- make_graph("Uniquely3colorable")
g <- make_graph("Tutte")
g <- make_graph("Thomassen")
g <- make_graph("Tetrahedral")
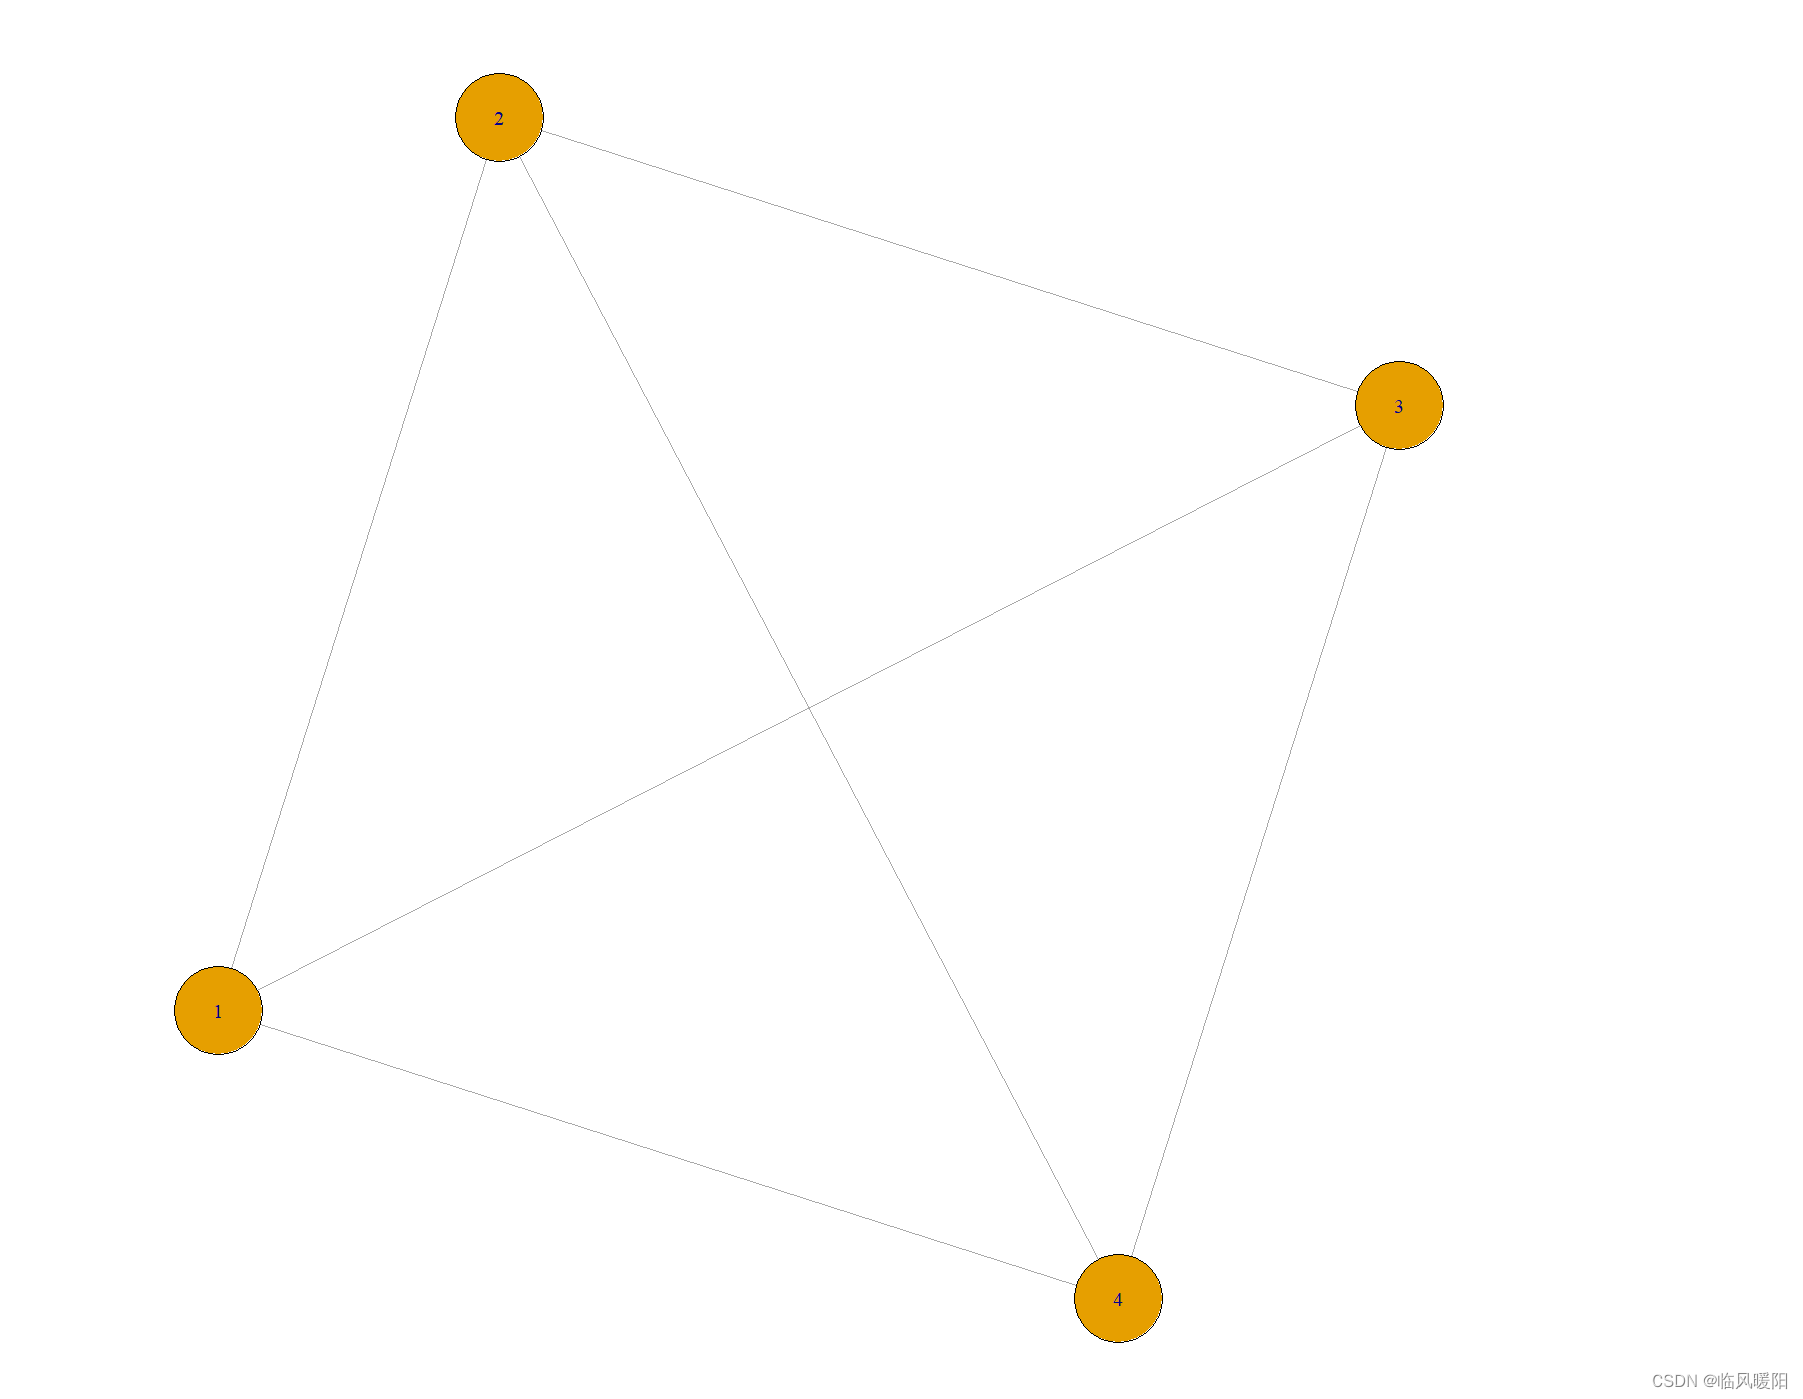
g <- make_graph("Tetrahedron")
参考文献:《Network Analysis and Visualization》