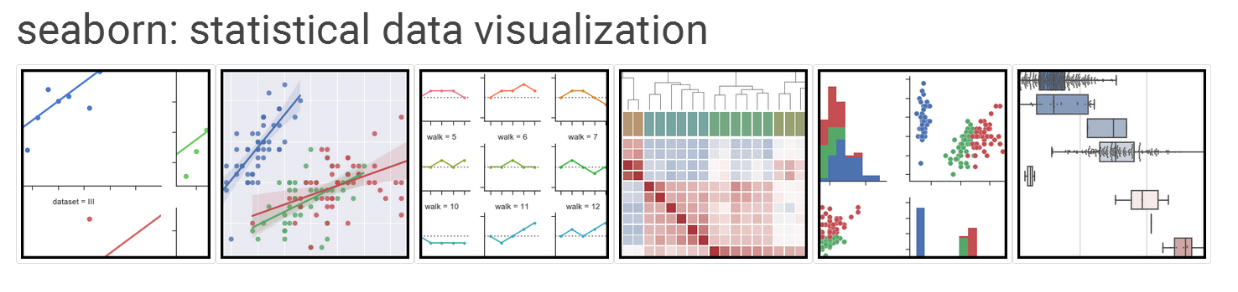
Seaborn-1Style
import seaborn as sns
import numpy as np
import matplotlib as mpl
import matplotlib.pyplot as plt
# %matplotlib inline
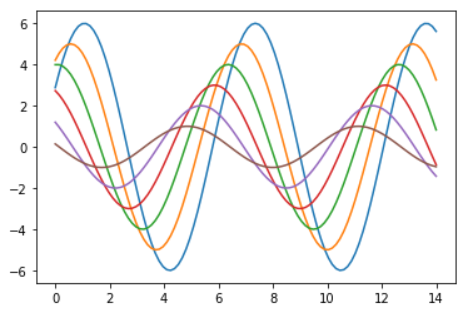
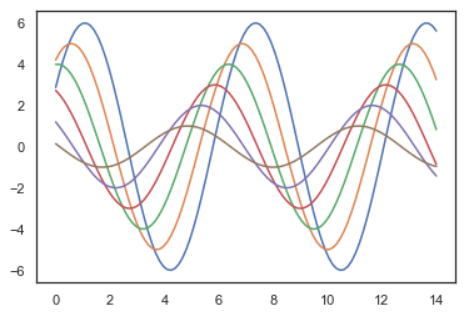
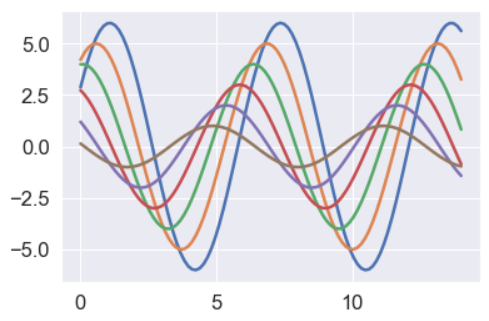
def sinplot(flip=1):
x = np.linspace(0, 14, 100)
for i in range(1, 7):
plt.plot(x, np.sin(x + i * .5) * (7 - i) * flip)
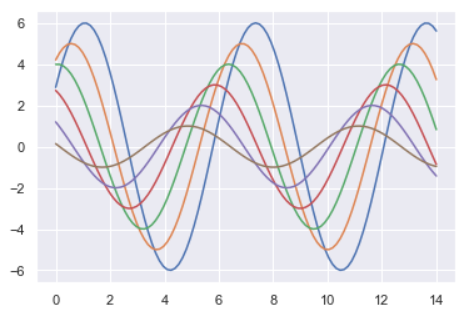
sinplot()
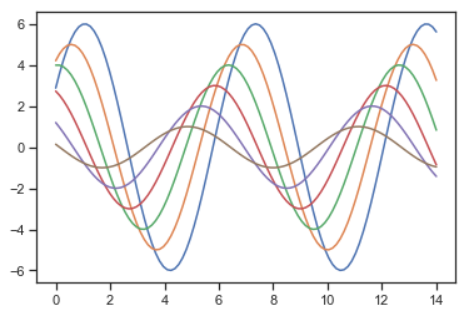
sns.set()
sinplot()
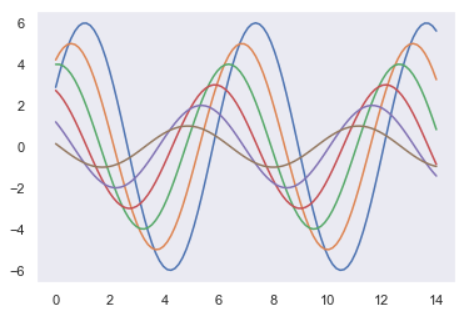
'''
5种主题风格
darkgrid
whitegrid
dark
white
ticks
'''
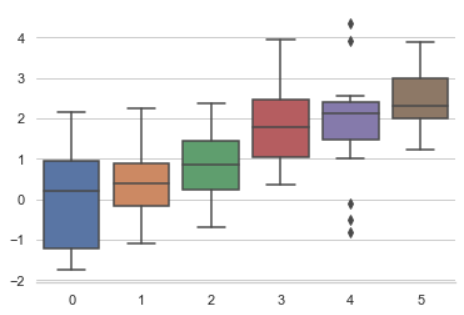
sns.set_style("whitegrid")
data = np.random.normal(size=(20, 6)) + np.arange(6) / 2
sns.boxplot(data=data)

data
'''
array([[ 0.63986007,  2.14485399,  1.01131002,  1.40268475,  2.339169  ,
         3.22343471],
       [ 0.52113843,  0.83365849,  1.56715032,  0.7159742 ,  0.35526665,
         2.64698869],
       [ 0.26712799,  1.93107107,  0.11208568, -0.09777214,  1.0448611 ,
         2.89050072],
       [-0.23100111, -0.21345777,  0.45369097,  2.55874325,  2.02284598,
         2.34599155],
       [ 0.13584382,  1.03477685,  1.65613141,  1.57249385,  1.26252323,
         1.2502523 ],
       [-0.98887618,  2.12578215,  0.50486762,  1.07129467,  0.29844895,
         2.83149809],
       [ 0.2791657 ,  0.70301803,  1.68786681, -0.72639551,  3.02613673,
         2.09390095],
       [ 0.97237265,  1.60585848, -0.23019449,  0.94411186,  2.47911711,
         3.75833174],
       [ 2.36644874,  1.74865381,  0.49079692,  1.84241922,  2.13008836,
         3.74685447],
       [ 1.49364838,  0.19296167,  0.75148434,  1.68317246,  2.3352623 ,
         2.77883528],
       [ 0.54814897, -0.03756201,  2.30158484,  0.35876512,  1.43424766,
         1.20749153],
       [ 1.01546528,  0.70699355,  0.80075029,  1.92595054, -0.46382634,
         2.35953131],
       [-0.68841373,  0.46816329,  1.62756676,  1.38552499,  1.99805172,
         3.91744223],
       [-1.24971189,  2.30894878,  0.56885806,  1.61251681,  1.92630285,
         4.16217846],
       [-0.77979552, -0.29186602,  1.21501248,  2.95481369,  0.82249344,
         2.77935004],
       [ 0.05522944, -0.23371659,  1.62287008,  0.2330687 ,  3.1935013 ,
         4.41159611],
       [ 3.37032537, -0.32074589,  3.84291451,  2.23170646,  1.11824526,
         3.56219305],
       [ 2.23227077,  2.94561766, -1.28387574,  5.67984199,  1.72101898,
         3.73012338],
       [ 1.36362738,  0.83392614,  0.09145057,  2.0837733 ,  2.33104093,
         3.14713488],
       [ 0.27535606,  0.61696806,  1.35029868,  0.95423693,  4.08083078,
         1.63515582]])
'''

sns.set_style("dark")
sinplot()
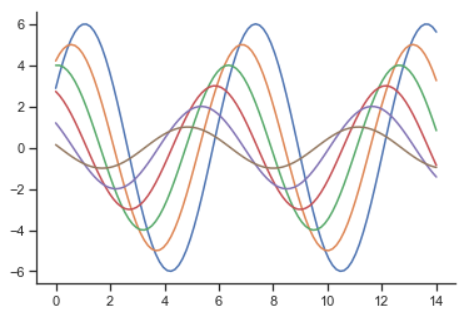
sns.set_style("white")
sinplot()
sns.set_style("ticks")
sinplot()
sinplot()
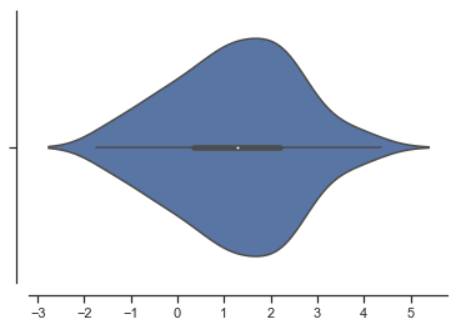
sns.despine()
#f, ax = plt.subplots()
sns.violinplot(data)
sns.despine(offset=10) # offset 设置图像离轴线的距离
sns.set_style("whitegrid")
sns.boxplot(data=data, palette="deep")
sns.despine(left=True)
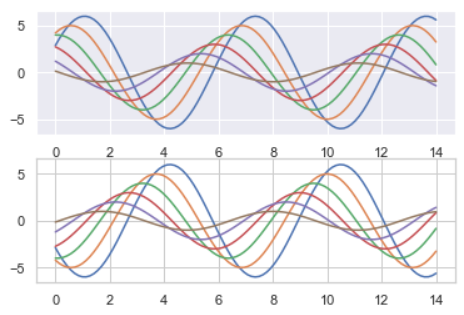
with sns.axes_style("darkgrid"):
    plt.subplot(211)
    sinplot()
plt.subplot(212)
sinplot(-1)
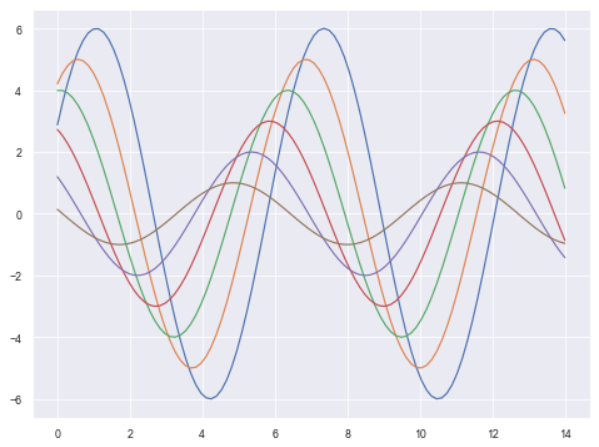
sns.set()

sns.set_context("paper")
plt.figure(figsize=(8, 6))
sinplot()
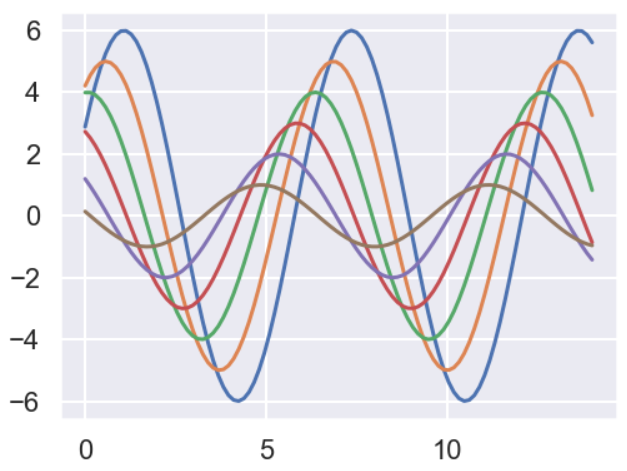
sns.set_context("talk")
plt.figure(figsize=(8, 6))
sinplot()

sns.set_context("poster")
plt.figure(figsize=(8, 6))
sinplot()
sns.set_context("notebook", font_scale=1.5, rc={"lines.linewidth": 2.5})
sinplot()
Seaborn-2Color

import numpy as np
import seaborn as sns
import matplotlib.pyplot as plt
%matplotlib inline
sns.set(rc={"figure.figsize": (6, 6)})

调色板
颜色很重要
color_palette()能传入任何Matplotlib所支持的颜色
color_palette()不写参数则默认颜色
set_palette()设置所有图的颜色

分类色板
current_palette = sns.color_palette()
sns.palplot(current_palette)

6个默认的颜色循环主题: deep, muted, pastel, bright, dark, colorblind

圆形画板
当你有六个以上的分类要区分时,最简单的方法就是在一个圆形的颜色空间中画出均匀间隔的颜色(这样的色调会保持亮度和饱和度不变)。这是大多数的当他们需要使用比当前默认颜色循环中设置的颜色更多时的默认方案。

最常用的方法是使用hls的颜色空间,这是RGB值的一个简单转换。

sns.palplot(sns.color_palette("hls", 8))

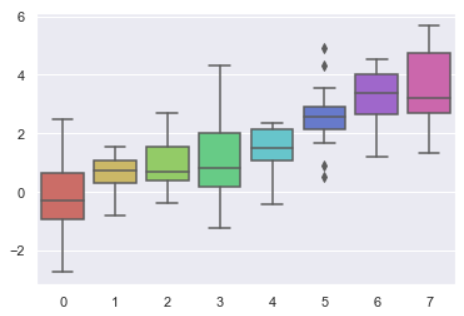
data = np.random.normal(size=(20, 8)) + np.arange(8) / 2
sns.boxplot(data=data,palette=sns.color_palette("hls", 8))
hls_palette()函数来控制颜色的亮度和饱和
l-亮度 lightness
s-饱和 saturation

sns.palplot(sns.hls_palette(8, l=.7, s=.9))

sns.palplot(sns.color_palette("Paired",8))

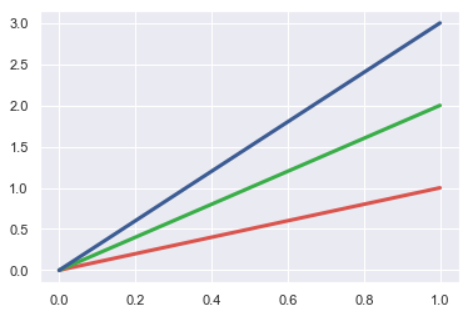
使用xkcd颜色来命名颜色
xkcd包含了一套众包努力的针对随机RGB色的命名。产生了954个可以随时通过xdcd_rgb字典中调用的命名颜色。

plt.plot([0, 1], [0, 1], sns.xkcd_rgb["pale red"], lw=3)
plt.plot([0, 1], [0, 2], sns.xkcd_rgb["medium green"], lw=3)
plt.plot([0, 1], [0, 3], sns.xkcd_rgb["denim blue"], lw=3)
colors = ["windows blue", "amber", "greyish", "faded green", "dusty purple"]
sns.palplot(sns.xkcd_palette(colors))

连续色板
色彩随数据变换,比如数据越来越重要则颜色越来越深

sns.palplot(sns.color_palette("Blues"))

如果想要翻转渐变,可以在面板名称中添加一个_r后缀

sns.palplot(sns.color_palette("BuGn_r"))

cubehelix_palette()调色板
色调线性变换

sns.palplot(sns.color_palette("cubehelix", 8))

sns.palplot(sns.cubehelix_palette(8, start=.5, rot=-.75))

sns.palplot(sns.cubehelix_palette(8, start=.75, rot=-.150))

light_palette() 和dark_palette()调用定制连续调色板

sns.palplot(sns.light_palette("green"))

sns.palplot(sns.dark_palette("purple"))

sns.palplot(sns.light_palette("navy", reverse=True))

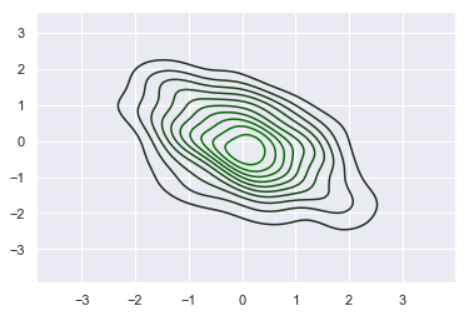
x, y = np.random.multivariate_normal([0, 0], [[1, -.5], [-.5, 1]], size=300).T
pal = sns.dark_palette("green", as_cmap=True)
sns.kdeplot(x, y, cmap=pal);
sns.palplot(sns.light_palette((210, 90, 60), input="husl"))