工作中需要制作一个看板,选型选用antV G2进行开发。
由于项目前端是使用Vue,于是研究了antVG2在Vue中的使用。
1.安装antv/g2
在IDEA下面Terminal中输入
npm install @antv/g2 --save
安装完成后为如下状态

2.创建一个Vue文件,引入antV/g2
import G2 from '@antv/g2';
3.创建一个函数,函数内部创建一个Chart对象,并在挂载时调用(这里我创建了两个函数,创建Chart对象所需的参数定义在data(){}中,后面会说)
test:function () {
        const data = this.basicColumnChartProp.data;
        // Step 1: 创建 Chart 对象
        const chart = new G2.Chart({
            container: this.basicColumnChartProp.container, // 指定图表容器 ID
            width : this.basicColumnChartProp.width, // 指定图表宽度
            height : this.basicColumnChartProp.height // 指定图表高度
        });
        // Step 2: 载入数据源
        chart.source(data);
        // Step 3:创建图形语法,绘制柱状图,由 genre 和 sold 两个属性决定图形位置,genre 映射至 x 轴,sold 映射至 y 轴
        chart.interval().position('genre*sold').color('genre')
        // Step 4: 渲染图表
        chart.render();
    },
    basicBarChart:function () {
        let data = this.basicBarChartProp.data;
        let chart = new G2.Chart({
            container: this.basicBarChartProp.container,
            width:this.basicBarChartProp.width,
            height:this.basicBarChartProp.height
        });
        chart.source(data);
        chart.axis('country', {
            label: {
                offset: 12
            }
        });
        chart.coord().transpose();
        chart.interval().position('country*population');
        chart.render();
    }
},
//在挂载时调用两个函数
mounted() {
    this.test();
    this.basicBarChart();
},
4.在data块中声明图表所需参数
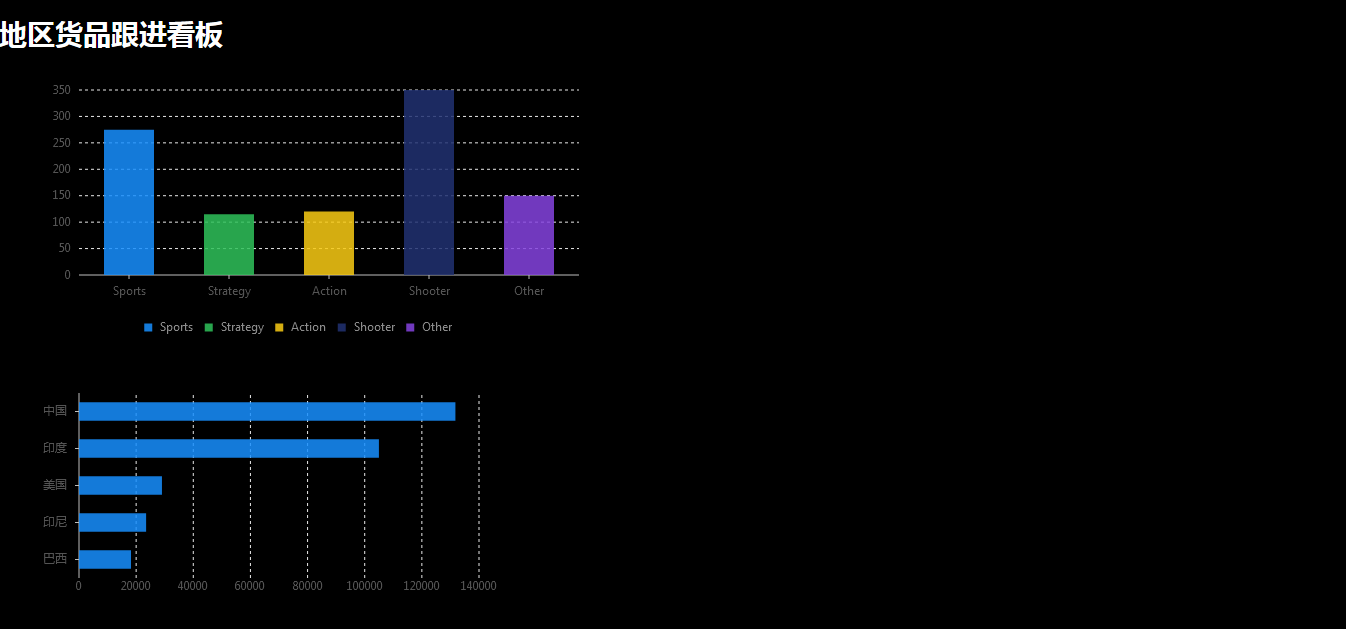
data(){
    return{
        title:'地区货品跟进看板',
        basicColumnChartProp:{
            data:[{ genre: 'Sports', sold: 275 },
                { genre: 'Strategy', sold: 115 },
                { genre: 'Action', sold: 120 },
                { genre: 'Shooter', sold: 350 },
                { genre: 'Other', sold: 150 }],
            container:'c1', //图表所绑定的div id
            width:600,
            height:300
        },
        basicBarChartProp:{
            container:'mountNode', //图表所绑定的div id
            width:500,
            height:300,
            data:[
                {
                    country: '巴西',
                    population: 18203
                }, {
                    country: '印尼',
                    population: 23489
                }, {
                    country: '美国',
                    population: 29034
                }, {
                    country: '印度',
                    population: 104970
                }, {
                    country: '中国',
                    population: 131744
                }
            ]
        }
    }
},
5.在模板<template>中创建div
<template>
  <div>
    <div><h1 style="color: white">{{title}}</h1></div>
    <span>
      <div id="c1"></div>
      <div id="mountNode"></div>
    </span>
  </div>
</template>
6.我想将单个Vue组件的背景设置成黑色,这利用了两个钩子函数beforeCreate (),beforeDestroy ()
beforeCreate () {
    document.querySelector('body').setAttribute('style', 'background:#000000')
},
beforeDestroy () {
    document.querySelector('body').removeAttribute('style')
}
设置好路由,打开网页,看其效果
完整代码如下:
<template>
  <div>
    <div><h1 style="color: white">{{title}}</h1></div>
    <span>
      <div id="c1"></div>
      <div id="mountNode"></div>
    </span>
  </div>
</template>

<script>
    import G2 from '@antv/g2';
    export default {
        name: "spectaculars",
        data(){
            return{
                title:'地区货品跟进看板',
                basicColumnChartProp:{
                    data:[{ genre: 'Sports', sold: 275 },
                        { genre: 'Strategy', sold: 115 },
                        { genre: 'Action', sold: 120 },
                        { genre: 'Shooter', sold: 350 },
                        { genre: 'Other', sold: 150 }],
                    container:'c1',
                    width:600,
                    height:300
                },
                basicBarChartProp:{
                    container:'mountNode',
                    size:{'width':500,'height':300},
                    data:[
                        {
                            country: '巴西',
                            population: 18203
                        }, {
                            country: '印尼',
                            population: 23489
                        }, {
                            country: '美国',
                            population: 29034
                        }, {
                            country: '印度',
                            population: 104970
                        }, {
                            country: '中国',
                            population: 131744
                        }
                    ]
                }
            }
        },
        methods:{
            test:function () {
                const data = this.basicColumnChartProp.data;
                // Step 1: 创建 Chart 对象
                const chart = new G2.Chart({
                    container: this.basicColumnChartProp.container, // 指定图表容器 ID
                    width : this.basicColumnChartProp.width, // 指定图表宽度
                    height : this.basicColumnChartProp.height // 指定图表高度
                });
                // Step 2: 载入数据源
                chart.source(data);
                // Step 3:创建图形语法,绘制柱状图,由 genre 和 sold 两个属性决定图形位置,genre 映射至 x 轴,sold 映射至 y 轴
                chart.interval().position('genre*sold').color('genre')
                // Step 4: 渲染图表
                chart.render();
            },
            basicBarChart:function () {
                let data = this.basicBarChartProp.data;
                let chart = new G2.Chart({
                    container: this.basicBarChartProp.container,
                    width:this.basicBarChartProp.size.width,
                    height:this.basicBarChartProp.size.height
                });
                chart.source(data);
                chart.axis('country', {
                    label: {
                        offset: 12
                    }
                });
                chart.coord().transpose();
                chart.interval().position('country*population');
                chart.render();
            }
        },
        mounted() {
            this.test();
            this.basicBarChart();
        },
        beforeCreate () {
            document.querySelector('body').setAttribute('style', 'background:#000000')
        },
        beforeDestroy () {
            document.querySelector('body').removeAttribute('style')
        }
    }
</script>

<style scoped>

</style>
这里我要说一下,为什么要将图表的参数写到data中
将来展示的可能不止一两个图表,可以将这些图表的创建,写到一个js文件中,然后导入到Vue组件中,
若数据写在图表创建的过程中,也就是说写在js文件中,那样当数据变化时,或者根据需求要更改图表格式时,就要修改js文件,万一其他的模块也用到该组件呢?所以这样不利于其复用。
写入js文件中,引入Vue控件中,将图表的参数定义在Vue空间中,并通过axios获取数据,可以使该看板更加灵活,有更好的复用性。