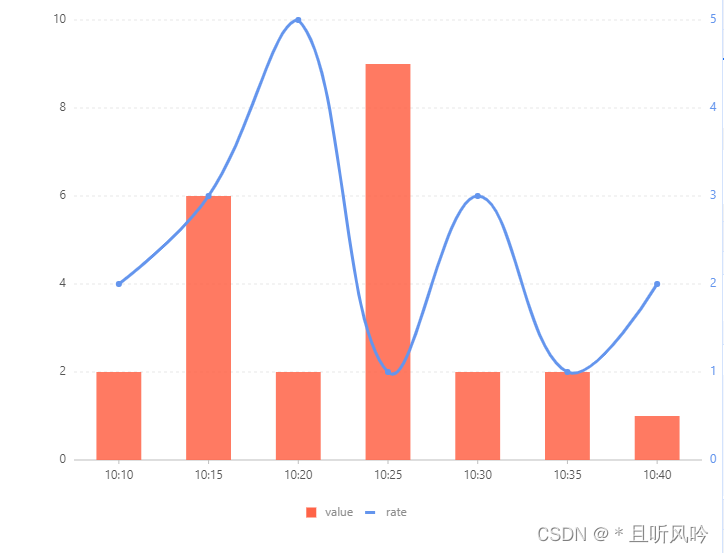
<!DOCTYPE html>
<html lang="en">
<head>
    <meta charset="UTF-8">
    <meta name="viewport" content="width=device-width,height=device-height">
    <title>柱状图+折线图双轴图表</title>
    <style>::-webkit-scrollbar{

      display:none;}html,body{

      overflow:hidden;height:100%;margin:0;}</style>
</head>
<body>
<div id="chartcontainer"></div>
<script>/*Fixing iframe window.innerHeight 0 issue in Safari*/document.body.clientHeight;</script>
<script src="https://gw.alipayobjects.com/os/antv/pkg/_antv.g2-3.5.1/dist/g2.min.js"></script>
<script>
  var data = [{


    date: '10:10',
    type: 4,
    value: 2,
    rate: 2
  }, {


    date: '10:15',
    type: 2,
    value: 6,
    rate: 3
  }, {


    date: '10:20',
    type: 13,
    value: 2,
    rate: 5
  }, {


    date: '10:25',
    type: 9,
    value: 9,
    rate: 1
  }, {


    date: '10:30',
    type: 5,
    value: 2,
    rate: 3
  }, {


    date: '10:35',
    type: 8,
    value: 2,
    rate: 1
  }, {


    date: '10:40',
    type: 13,
    value: 1,
    rate: 2
  }];

  var chart = new G2.Chart({


    container: 'chartcontainer',
    forceFit: true,
    height: window.innerHeight
  });
  chart.source(data, {


    type: {


      min: 0
    },
    rate: {


      min: 0
    },
    value: {


      min: 0
    }
  });
  chart.legend({


    custom: true,
    allowAllCanceled: true,
    items: [{


      value: 'value',
      marker: {


        symbol: 'square',
        fill: '#FF6347',
        radius: 5
      }
    }, {


      value: 'rate',
      marker: {


        symbol: 'hyphen',
        stroke: '#6495ED',
        radius: 5,
        lineWidth: 3
      }
    }]
  });
  chart.axis('rate', {


    grid: null,
    label: {


      textStyle: {


        fill: '#6495ED'
      }
    }
  });
  chart.interval().position('date*value').color('#FF6347');
  chart.line().position('date*rate').color('#6495ED').size(3).shape('smooth');
  chart.point().position('date*rate').color('#6495ED').size(3).shape('circle');
  chart.render();
</script>
</body>
</html>
页面效果:
