<!DOCTYPE html>
<html lang="en">
<head>
<meta charset="UTF-8">
<meta name="viewport" content="width=device-width,height=device-height">
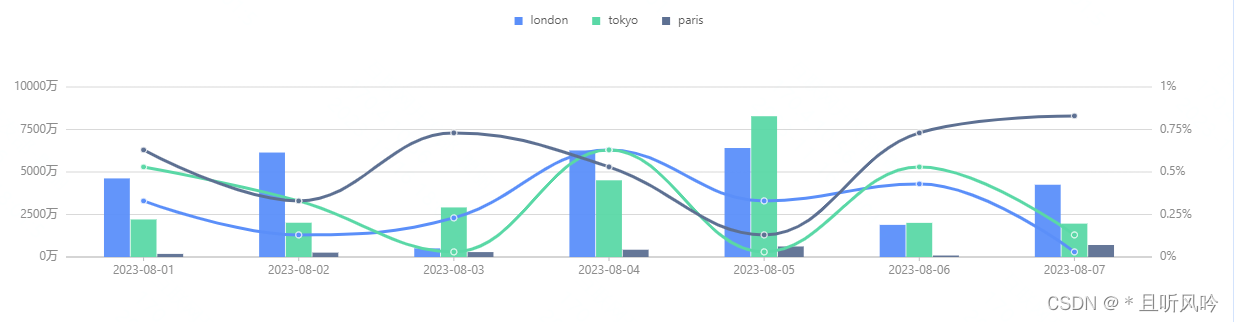
<title>分组柱状图+折线图双轴图表</title>
<style>::-webkit-scrollbar{
display:none;}html,body{
overflow:hidden;height:100%;margin:0;}
#chartcontainer {
margin: 50px auto;
text-align: center;
}
</style>
</head>
<body>
<div id="chartcontainer"></div>
<script>/*Fixing iframe window.innerHeight 0 issue in Safari*/document.body.clientHeight;</script>
<script src="https://gw.alipayobjects.com/os/lib/antv/g2/4.2.8/dist/g2.min.js"></script>
<script src="https://gw.alipayobjects.com/os/antv/pkg/_antv.data-set-0.11.1/dist/data-set.js"></script>
<script>
<!-- 浏览器引入,请使用全局命名空间 G2,如 new Chart() 改为 new G2.Chart,即可运行。 -->
const data =
[
{
date: '2023/8/1', type: 'london', value: 4623, rate: 0.33},
{
date: '2023/8/1', type: 'tokyo', value: 2208, rate: 0.53},
{
date: '2023/8/1', type: 'paris', value: 182, rate: 0.63},
{
date: '2023/8/2', type: 'london', value: 6145, rate: 0.13},
{
date: '2023/8/2', type: 'tokyo', value: 2016, rate: 0.33},
{
date: '2023/8/2', type: 'paris', value: 257, rate: 0.33},
{
date: '2023/8/3', type: 'london', value: 508, rate: 0.23},
{
date: '2023/8/3', type: 'tokyo', value: 2916, rate: 0.03},
{
date: '2023/8/3', type: 'paris', value: 289, rate: 0.73},
{
date: '2023/8/4', type: 'london', value: 6268, rate: 0.63},
{
date: '2023/8/4', type: 'tokyo', value: 4512, rate: 0.63},
{
date: '2023/8/4', type: 'paris', value: 428, rate: 0.53},
{
date: '2023/8/5', type: 'london', value: 6411, rate: 0.33},
{
date: '2023/8/5', type: 'tokyo', value: 8281, rate: 0.03},
{
date: '2023/8/5', type: 'paris', value: 619, rate: 0.13},
{
date: '2023/8/6', type: 'london', value: 1890, rate: 0.43},
{
date: '2023/8/6', type: 'tokyo', value: 2008, rate: 0.53},
{
date: '2023/8/6', type: 'paris', value: 87, rate: 0.73},
{
date: '2023/8/7', type: 'london', value: 4251, rate: 0.03},
{
date: '2023/8/7', type: 'tokyo', value: 1963, rate: 0.13},
{
date: '2023/8/7', type: 'paris', value: 706, rate: 0.83}
]
var chart = new G2.Chart({
container: 'chartcontainer',
autoFit: true,
width: 300,
height: 300,
padding: [80, 80, 50, 80]
});
chart.data(data);
chart.scale({
value: {
formatter: (val) => {
return val + '万'
},
sync: true,
nice: true,
},
rate: {
formatter: (rate) => {
return rate + '%'
},
sync: true,
nice: true,
}
});
chart.legend('type',{
position: 'top' // 设置图例的显示位置
})
chart.axis('rate', {
grid: null,
label: {
textStyle: {
fill: '#6495ED'
}
}
});
chart.interval().position('date*value').color('type')
.adjust([{
type: 'dodge',
marginRatio: 1 / 32
}])
chart.line().position('date*rate').color('type').size(3).shape('smooth');
chart.point().position('date*rate').color('type').size(3).shape('circle');
chart.render();
</script>
</body>
</html>
页面效果: